HAL Id: hal-00330278
https://hal.archives-ouvertes.fr/hal-00330278
Submitted on 18 Dec 2007HAL is a multi-disciplinary open access
archive for the deposit and dissemination of sci-entific research documents, whether they are pub-lished or not. The documents may come from teaching and research institutions in France or abroad, or from public or private research centers.
L’archive ouverte pluridisciplinaire HAL, est destinée au dépôt et à la diffusion de documents scientifiques de niveau recherche, publiés ou non, émanant des établissements d’enseignement et de recherche français ou étrangers, des laboratoires publics ou privés.
Ecology and biogeochemistry of contrasting trophic
environments in the South East Pacific by carbon
isotope ratios on lipid biomarkers
I. Tolosa, J.-C. Miquel, B. Gasser, Patrick Raimbault, L. Azouzi, Hervé
Claustre
To cite this version:
I. Tolosa, J.-C. Miquel, B. Gasser, Patrick Raimbault, L. Azouzi, et al.. Ecology and biogeochemistry of contrasting trophic environments in the South East Pacific by carbon isotope ratios on lipid biomarkers. Biogeosciences Discussions, European Geosciences Union, 2007, 4 (6), pp.4653-4696. �hal-00330278�
BGD
4, 4653–4696, 2007
δ13C on lipid
biomarkers from the South East Pacific
I. Tolosa et al. Title Page Abstract Introduction Conclusions References Tables Figures ◭ ◮ ◭ ◮ Back Close
Full Screen / Esc
Printer-friendly Version
Interactive Discussion
Biogeosciences Discuss., 4, 4653–4696, 2007 www.biogeosciences-discuss.net/4/4653/2007/ © Author(s) 2007. This work is licensed
under a Creative Commons License.
Biogeosciences Discussions
Biogeosciences Discussions is the access reviewed discussion forum of Biogeosciences
Ecology and biogeochemistry of
contrasting trophic environments in the
South East Pacific by carbon isotope
ratios on lipid biomarkers
I. Tolosa1, J.-C. Miquel1, B. Gasser1, P. Raimbault2, L. Azouzi3, and H. Claustre4
1
International Atomic Energy Agency – Marine Environment Laboratories, 4, quai Antoine 1er, MC 98000, Monaco
2
Laboratoire d’Oc ´eanographie et de Biog ´eochimie (UMR 6535 CNRS), Centre d’Oc ´eanologie de Marseille, Univ. de la M ´editerran ´ee, Campus de Luminy, 13288 Marseille Cx 09, France
3
BDSI, Universit ´e de Perpignan, 52 avenue Paul Alduy, 66860 Perpignan, France
4
Laboratoire d’Oc ´eanographie de Villefranche, Observatoire Oc ´eanologique, INSU/CNRS/UPMC, UMR 7093, BP 08, 06230 Villefranche-sur-Mer, France
Received: 28 November 2007 – Accepted: 28 November 2007 – Published: 18 December 2007
BGD
4, 4653–4696, 2007
δ13C on lipid
biomarkers from the South East Pacific
I. Tolosa et al. Title Page Abstract Introduction Conclusions References Tables Figures ◭ ◮ ◭ ◮ Back Close
Full Screen / Esc
Printer-friendly Version
Interactive Discussion
EGU
Abstract
The distribution of lipid biomarkers and their carbon isotope composition was inves-tigated on suspended particles from different contrasting trophic environments at six sites in the South East Pacific. High algal biomass with diatom-related lipids was cha-racteristic in the upwelling zone, whereas haptophyte lipids were proportionally most 5
abundant in the nutrient-poor settings of the centre of the South Pacific Gyre and on its easter edge. Dinoflagellate–sterols were minor contributors in all of the studied area and cyanobacteria-hydrocarbons were at maximum in the high nutrient low chlorophyll regime of the subequatorial waters at near the Marquesas archipelago.
The taxonomic and spatial variability of the relationships between carbon photosyn-10
thetic fractionation and environmental conditions for four specific algal taxa (diatoms, haptophytes, dinoflagellates and cyanobacteria) was also investigated. The carbon iso-tope fractionation factor (εp) of the diatom marker varied over a range of 16‰ along the different trophic systems. In contrast, εpof dinoflagellate, cyanobacteria and alkenone
markers varied only by 7–10‰. The low fractionation factors and small variations be-15
tween the different phytoplankton markers measured in the upwelling area likely re-veals uniformly high specific growth rates within the four phytoplankton taxa, and/or that transport of inorganic carbon into phytoplankton cells may not only occur by diffusion but by other carbon concentrating mechanisms (CCM). In contrast, in the oligotrophic zone, i.e. gyre and eastgyre, relatively highεpvalues, especially for the diatom marker,
20
indicate diffusive CO2 uptake by the eukaryotic phytoplankton. At these nutrient-poor
sites, the lowest εp values for haptophytes, dinoflagellates and cyanobacteria infer higher growth rates compared to diatoms.
1 Introduction
The sustainability of phytoplankton growth in the world ocean is basically controlled by 25
BGD
4, 4653–4696, 2007
δ13C on lipid
biomarkers from the South East Pacific
I. Tolosa et al. Title Page Abstract Introduction Conclusions References Tables Figures ◭ ◮ ◭ ◮ Back Close
Full Screen / Esc
Printer-friendly Version
Interactive Discussion
to these sources (Falkowski, 1984; Falkowski et al., 1998; Irwin et al., 2006; Litchman et al., 2006). The variability of these factors and their role in biogeochemical processes emerges from the properties of the surface mixed layer. Hence, eutrophic areas, such as upwellings, with continuous nutrient supply to the euphotic zone differ strongly from areas with a permanently nutrient-depleted surface layer. In these areas, e.g. oceanic 5
gyres, a deep pycnocline prevents surface waters from a supply with deeper, more nutrient-rich waters.
Photosynthesis is a major biogeochemical process where carbon dioxide and water are converted into organic carbon with the presence of light. The fate of this organic carbon is therefore intimately linked to the conditions of its synthesis and depends 10
strongly on the composition of the phytoplankton assemblages. For understanding the global marine carbon cycle, efforts should be made to derive information relative to these ecosystems. In addition to the now widely used chlorophyll and pigment analysis (Barlow et al., 1993; Claustre et al., 2004; Mackey et al., 1996), field data about phyto-plankton diversity might also be acquired by the distribution of accessory lipid biomark-15
ers. They provide important information on the phytoplankton composition comple-mentary to that of algal pigments, as well as on the relative importance of carbon sources from heterotrophic bacteria and other zooplankton (Dijkman and Kromkamp, 2006; Pinturier-Geiss et al., 2002; Tolosa et al., 2004).
Isotopic characterization of marine organic matter can provide insight into the condi-20
tions under which carbon fixation occurs contributing to the understanding of the global marine carbon cycle. The carbon isotopic composition (δ13C) of any photosynthetic material and their derived carbon isotope fractionation factor (εp) reflects the δ
13
C of the carbon source utilized and the modification by the processes and environmental variables involved in its production: growth rate, temperature, dissolved CO2, cell
ge-25
ometry, irradiance, etc. (Burkhardt et al., 1999a; Burkhardt et al., 1999b; Eek et al., 1999; Hayes, 1993; Laws et al., 1997; Popp et al., 1998b; Rau et al., 1996). For exam-ple, high growth rates of the phytoplankton producers are linked to highδ13C values, i.e. they are enriched in13C (Bidigare et al., 1999; Laws et al., 1995). However, they
BGD
4, 4653–4696, 2007
δ13C on lipid
biomarkers from the South East Pacific
I. Tolosa et al. Title Page Abstract Introduction Conclusions References Tables Figures ◭ ◮ ◭ ◮ Back Close
Full Screen / Esc
Printer-friendly Version
Interactive Discussion
EGU become depleted in13C with increasing the concentration of dissolved CO2(Burkhardt
et al., 1999a; Riebesell et al., 2000). This latter linkage seems to be limited in its extent, and differences of δ13C higher than 1–2‰ cannot be explained any more by the change in the CO2concentration, but they are rather accounted for by differences in the growth
rates of the phytoplankton producers and carbon uptake mechanisms (Bidigare et al., 5
1997; Burkhardt et al., 1999b, Benthien et al., 2007). Since particulate organic car-bon (POC) is a complex mixture of autotrophs, heterotrophs, and detritus, potentially clearer relationships between δ13C values and environmental conditions can be ob-tained using specific biomarkers derived from particular species or taxonomic groups (Bidigare et al., 1999; Pancost et al., 1999; Pancost et al., 1997), compared to theδ13C 10
of the bulk POC (Rau et al., 2001; Woodworth et al., 2004). This has become possible with compound-specific isotope-ratio mass spectrometry (Freeman et al., 1990; Hayes et al., 1990).
Our field study uses molecular and isotopic carbon ratios of specific lipid biomarkers to evaluate the sources of the organic matter and to explore variations in the biogeo-15
chemistry of the particulate organic matter at the different hydrodynamic and trophic environments from the South East Pacific. These include the eutrophic upwelling area off the Chilean coast, the mesotrophic and HNLC regions south of the equatorial cur-rent and the oligotrophic South Pacific Gyre, which was the major focus of this work. The major questions being addressed are:
20
1) What is the spatial distribution of lipid biomarkers of phyto-, zooplankton and bac-teria in the contrasting trophic environments of the South East Pacific?
2) What is the variability of the carbon isotope fractionation (εp) and growth rates of different phytoplankton taxa in relation to the environmental conditions character-ized by different nutrient, dissolved inorganic carbon concentrations and produc-25
tivity regimes? We discuss these results with respect to the processes of carbon uptake and assimilation within the different phytoplankton groups from the South-East Pacific Ocean.
BGD
4, 4653–4696, 2007
δ13C on lipid
biomarkers from the South East Pacific
I. Tolosa et al. Title Page Abstract Introduction Conclusions References Tables Figures ◭ ◮ ◭ ◮ Back Close
Full Screen / Esc
Printer-friendly Version
Interactive Discussion
2 Materials and methods
2.1 Sampling
Sampling and hydrographic observations were carried on board R/V “L’Atalante” be-tween October and December 2004 and were organized within the framework of the BIOSOPE (Biogeochemistry & Optics South Pacific Experiment) project which is part 5
of the JGOFS French oceanographic programme PROOF. The main hydrodynamical and trophic features for the different zones are described in Claustre et al. (2007)1.
Samples were taken at six different sites, so called “long stations”, between Tahiti and the Chilean coast (Table 1). The different explored zones exhibited contrasting trophic environments. First, a mesotrophic area downstream of the Marquesas Islands 10
(MAR) and a high nutrient low chlorophyll zone (HNL) upstream of the Islands. Second, an extremely oligotrophic area, very poor in nutrients, located in the centre of the South Pacific Gyre (GYR) and a less oligotrophic site in the east of the gyre (EGY). At the end of the transect, we studied a eutrophic zone highly enriched in nutrients and associated to the upwelling off the Chilean coast (UPW and UPX). UPW station was farther from 15
the coast than UPX and exhibited a more important water stratification.
“Challenger Oceanics” in-situ pumps were used to filter large volumes (400 to 900 l) of water from the upper 300 m of the water column, to collect suspended particles through a Nitex screen of 70µm and a precombusted (550◦C) Microquartz filter (QMF, Sartorius) of 1µm pore size.
20
2.2 Bulk measurements
Table 2 summarizes the bulk biochemical parameters of the suspended particulate matter along the transect Marquesas Islands-Chilean coast.
1
Claustre, H., Sciandra, A., and Vaulot, D.: Introduction to the special section: bio-optical and biogeochemical conditions in the South East Pacific in late 2004 – the BIOSOPE cruise, Biogeosciences Discuss., submitted, 2007.
BGD
4, 4653–4696, 2007
δ13C on lipid
biomarkers from the South East Pacific
I. Tolosa et al. Title Page Abstract Introduction Conclusions References Tables Figures ◭ ◮ ◭ ◮ Back Close
Full Screen / Esc
Printer-friendly Version
Interactive Discussion
EGU Total CO2 (CT) and total alkalinity (AT) of water samples were measured by
poten-tiometry (Azouzi et al., 2007) at all sites except UPW. The dissolved CO2concentration
was calculated from CT, alkalinity, temperature, salinity and the concentrations of si-licate and phosphate using the CO2SYS program developed for CO2 system (Lewis and Wallace, 1998). This program is based on equations of the seawater CO2system
5
(DOE, 1994) and the dissociation constants of Goyet and Poisson (1989). For the UPW site, we assumed the same concentrations as UPX, since vertical profiles for aqueous CO2 interpolated from the WOCE cruise P06 in GLODAP three-dimensional gridded
data at the two stations indicate similar concentrations.
Nutrient concentrations (nitrate, phosphate and silicate) were determined onboard 10
using an autoanalyzer (Raimbault et al., 2007).
Analysis of organic carbon was done with a “Vario EL” elemental analyser (© ele-mentar Analysensysteme GmbH) after acidification of the filter aliquots (Miquel et al., 20072).
2.3 Lipid extraction 15
Filters containing the suspended particles were spiked with internal standards (n-C24D50, anthracene-d10, pyrene-d10, perylene-d12, friedeline, 5α-androstan-3β-ol and cholanic acid), and extracted by microwave oven with 40 ml of a mixture with CH2Cl2/MeOH (3:1) at 70
◦
C for 15 min. Isolation of the neutral and acid lipid frac-tions were done following the method of Tolosa and de Mora (2004). Extractable lipids 20
were saponified using 1 ml KOH 6% in methanol/water (80:20) plus 1 ml of Milli-Q wa-ter (80◦C, 1 h). Then the neutral fraction was recovered withn-hexane and subject to fractionation by HPLC on a normal phase column (Nucleosil column, 20 cm×0.4 cm i.d. 5µm) to isolate the aliphatic hydrocarbons (F1), polycyclic aromatic hydrocarbons (F2), ketone compounds (F3) and sterol and alcohol fraction (F4). Saponified solutions 25
2
Miquel, J. C. and Gasser, B.: Downward particulate flux and carbon export in contrasting environments of the South East Pacific, Biogeosciences Discuss., in preparation, 2007.
BGD
4, 4653–4696, 2007
δ13C on lipid
biomarkers from the South East Pacific
I. Tolosa et al. Title Page Abstract Introduction Conclusions References Tables Figures ◭ ◮ ◭ ◮ Back Close
Full Screen / Esc
Printer-friendly Version
Interactive Discussion
were acidified with 1 ml HCl 6 N to pH 2 and the fatty acids obtained by hydrolysis of wax esters, triacylglycerols, steryl esters and phospholipids were extracted with hex-ane:ethyl acetate 9:1.
2.4 Gas chromatography
The sterol fraction was treated with bis-(trimethylsilyl)-trifluoroacetamide (BSTFA) 5
(200µl, 70◦C, 1 h) to convert the alcohols and sterols to their corresponding trimethylsi-lyl ethers. The acid fraction was derivatized by transesterifying the lipid extract with 500µl of 20% BF3in methanol at 80
◦
C for 1 h.
Gas chromatography (GC) was performed with a Hewlett Packard HP5890 series II equipped with a flame ionization detector and split/splitless injector. Two fused 10
silica capillary columns were employed: (A) a DB-5 fused silica capillary column (30 m×0.25 mm i.d.; film thickness 0.25µm) for neutral compounds and fatty acids and (B) a BPX-70 (SGE, 60 m×0.32 mm×0.5 um) for the fatty acids. Helium was the car-rier gas (1.2 ml min−1). The oven temperature for the DB-5 was programmed from 60◦C (0.5 min hold) to 290◦C at 6◦C min−1. The GC oven for the BPX-70 column was 15
programmed from 60◦C (0.5 min hold) to 250◦C at 6◦C min−1. Injector and detector temperatures were 270◦C and 320◦C, respectively.
Aliphatic hydrocarbons, ketones, sterols and fatty acids were quantified by internal standards (n-C24D50, friedeline, 5α-androstan-3β-ol, and cholanic acid, respectively).
Confirmation of peak identity was obtained using GC with mass spectrometric detection 20
(GC-MS) (Hewlett-Packard 5889B MS “Engine”) operated in the electron impact at 70 eV.
2.5 Compound-specific isotope analysis
The lipid biomarkers were analyzed for their stable carbon isotope composition using an HP 5890 GC equipped with a HP 7673 autoinjector and interfaced through a 25
BGD
4, 4653–4696, 2007
δ13C on lipid
biomarkers from the South East Pacific
I. Tolosa et al. Title Page Abstract Introduction Conclusions References Tables Figures ◭ ◮ ◭ ◮ Back Close
Full Screen / Esc
Printer-friendly Version
Interactive Discussion
EGU (GC/C/IRMS).
The GC/C/IRMS was equipped with a 100% methylpolysiloxane fused silica column (Ultra-1, 50 m×0.32 mm i.d.; 0.5µm film thickness) pre-connected with a press-fit con-nector (Supelco, France) to a 0.32 mm i.d. deactivated fused silica capillary retention gap of 5 m. Injections of 2µl in isooctane were made via an on-column injector. The 5
GC oven was programmed from 60 to 100◦C at 10◦C min−1, then to 310◦C at 4◦C min−1 and maintained at 310◦C for 40 min. Values reported were determined by at least three replicates to calculate the average and standard deviation. Allδ13C values are reported in the delta notation relative to the Pee Dee Belemnite (PDB) standard as follows:
δ13C=[(13C/12C)sample/(13C/12C)PDB−1] × 103
10
Corrections for the isotopic change introduced in the derivatisation of sterols, fatty al-cohols, and fatty acids were determined through derivatisation of standards of known isotopic composition and applying the equation of Jones et al. (1991). Cholesterol, methanol, 18:0 fatty acid and 18:0 FAME of known isotopic carbon composition (mea-sured by elemental analyser coupled to isotope ratio mass spectrometer), were used to 15
calibrate the GC/C/IRMS and correct the isotopic change introduced by the derivatiza-tion. The surrogate standards, 5α-androstan-3β-ol, cholanic acid and the GC internal standard friedelin of known isotopic composition served as internal isotopic standards. The precision (standard deviation) for most analytes with GC-C-IRMS signals higher than 0.5 V (m/z 44) was comparable to the instrument specifications (0.5‰).
20
2.6 Calculations of carbon isotope fractionation (εp)
Molecularεp was determined following the general equation (1) outlined in Freeman and Hayes (1992):
εp= [(δ13CO2+ 1000)/(δ13Cpp+ 1000) − 1] × 103 (1)
where CO2is its dissolved phase in the water column and Cpp the primary
photosyn-25
BGD
4, 4653–4696, 2007
δ13C on lipid
biomarkers from the South East Pacific
I. Tolosa et al. Title Page Abstract Introduction Conclusions References Tables Figures ◭ ◮ ◭ ◮ Back Close
Full Screen / Esc
Printer-friendly Version
Interactive Discussion
In this study, direct measurement ofδ13CO2 was not available. Therefore δ 13
CO2
was calculated according to the Eq. (2) of Mook (1974):
εb= [(δ13CO2+ 1000)/(δ13b + 1000) − 1] × 103= 24.12 − 9866/T (2)
where εb is the temperature-dependent carbon isotope fractionation of dissolved CO2with respect to bicarbonate,T is the absolute temperature in Kelvin, and the
refer-5
ence value ofδ13for bicarbonate (b) in sea surface water was taken as +2.2‰(Craig, 1970).
δ13Cpp (primary photosynthate) for eukaryotic organisms was estimated by using a constant isotopic fractionation between photosynthetic lipids and algal biomass, which has been estimated at 4.2‰ for alkenones (Popp et al., 1998a) This value is assumed 10
to be the same for the rest of eukaryotic photosynthetic compounds (Hayes, 1993). For prokaryote,δ13Cpp was estimated from the n-heptadecane using a constant isotopic fractionation between photosynthetic lipids and algal biomass of 8.4‰ (Sakata et al., 1997).
2.7 Estimations of growth rates and intracellular carbon demand in haptophytes 15
Carbon isotopic fractionation for phytoplankton (εp) which obtain CO2by passive diffu-sion is summarized by the expresdiffu-sion of Popp et al. (1998b):
εp= εf −β
µ(V/S)
[CO2] (3)
whereεf is the fractionation associated with the enzyme-catalyzed carbon fixation step, β is a constant, µ is the specific growth rate, V and S are the volume and surface area 20
of the alga cells and [CO2] is the concentration of dissolved CO2 external to the algal cell. Sinceβ and (V/S) are practically constant for haptophyte taxa, we can transform this constant and the variableµ into the b-value (‰µmol), which serves as a proxy for
BGD
4, 4653–4696, 2007
δ13C on lipid
biomarkers from the South East Pacific
I. Tolosa et al. Title Page Abstract Introduction Conclusions References Tables Figures ◭ ◮ ◭ ◮ Back Close
Full Screen / Esc
Printer-friendly Version
Interactive Discussion
EGU growth rate and reflects the intracellular carbon demand. This b-value was calculated
following the Eq. (4) of Bidigare et al. (1997):
b = (εf −εp) × [CO2]aq (4)
with εf values of 25‰ for eukaryotic algae utilizing Rubisco and β-carboxylase en-zymes (Bidigare et al., 1997) and [CO2]aq calculated as described in Sect. 2.2.
5
Specific growth rates (µ, (d−1)) of alkenone producing haptophytes were estimated with the following equation found by Bidigare et al. (1997) in laboratory chemostat culture experiments of Emiliania huxleyi:
µcc = (25 − εp)[CO2]/138 (5)
and applying the corrections for the effects of day length and respiration on growth rate 10
µ = [µcc/(24/tp)]0.8 (6)
whereµ is the 24-h average growth rate, tpis day length or photoperiod in hours, and the factor 0.8 adjusts the growth rate for dark respiration.
3 Results and discussion
The analytical scheme used in this study identified and quantified ∼60 individual com-15
pounds in the neutral lipid fraction and ∼40 acid compounds in the acid fraction. A summary of selected lipid biomarkers discussed in this study together with their sources is shown in Table 3. Concentrations of the selected lipid biomarkers are summarized in Table 4 and the individual carbon isotope ratio for some of the se-lected lipid biomarkers are shown in Annex A. The complete data set of concentra-20
tions and δ13C values for those possible are available on the BIOSOPE Database: http://www.obs-vlfr.fr/proof/vt/op/ec/biosope/bio.htm.
BGD
4, 4653–4696, 2007
δ13C on lipid
biomarkers from the South East Pacific
I. Tolosa et al. Title Page Abstract Introduction Conclusions References Tables Figures ◭ ◮ ◭ ◮ Back Close
Full Screen / Esc
Printer-friendly Version
Interactive Discussion
3.1 Distribution of phytoplankton, zooplankton and bacterial markers in different trophic environments
Concentrations of phytol, a non-specific marker for phototrophic organisms, if com-pared at the depth of chlorophyll maximum, were highest at the upwelling sites with 102 ng l−1 at UPW and 78 ng l−1 at UPX. The mesotrophic sites, MAR and HNL, 5
exhibited intermediate phytol concentrations of 25 to 31 ng l−1. The lowest values were measured at the oligotrophic sites, EGY (16 ng l−1) and in particular at GYR (11 ng l−1), where the chlorophyll maximum was at 175 m depth. Concentrations of diatom biomarkers, e.g. (C28∆
5,24(28)
sterol, C25HBI alkenes, C16:4FA, C20:5FA),
hap-tophytes biomarkers (total alkenones) and dinoflagellates markers (dinosterol) exhib-10
ited a similar distribution as phytol concentrations (Table 4), except in the Gyre where alkenones and dinosterol peaked at lower depths than phytol and diatom markers.
Highest concentrations of long-chain C37 and C38 alkenones were measured at the
eutrophic UPW site (27 ng l−1) but also at the two gyre sites EGY (20 ng l−1) and GYR (23 ng l−1). These peak values corresponded to the depth of chlorophyll maximum 15
except for the GYR site where the peak was situated above this maximum, at 125 m depth. A much lower concentration (6.5 ng l−1) was recorded at the MAR site. These values are much lower than those reported for suspended particles from the Bering Sea after blooms of Emiliana Huxleyi and ranging from 0.15 to 3.12µg l−1 (Harada et al., 2003), but similar to concentrations observed in suspended particles collected 20
under non-bloom conditions in the surface waters of the North Atlantic and Nordic Sea (Sicre et al., 2002), in the western Sargasso Sea (100 ng l−1) (Conte et al., 2001) and in the oligotrophic North Pacific subtropical gyre (0.5–15 ng l−1) (Prahl et al., 2005).
The C17 n-alkane, which is produced by aerobic photosynthetic bacteria and green
algae (Han and Calvin, 1969; Winters et al., 1969) exhibited a maximum concentra-25
tion of 2.3 ng l−1, below the chlorophyll maximum at the HNL site and of 1.2 ng l−1 at the same depth (70 m) as the chlorophyll maximum at the EGY site. The other sites showed concentration levels below 0.5 ng l−1 (Table 4). These concentrations were
BGD
4, 4653–4696, 2007
δ13C on lipid
biomarkers from the South East Pacific
I. Tolosa et al. Title Page Abstract Introduction Conclusions References Tables Figures ◭ ◮ ◭ ◮ Back Close
Full Screen / Esc
Printer-friendly Version
Interactive Discussion
EGU consistent with the abundance distribution of prokaryotic phototrophic organisms, with
high abundances at the HNL and EGY sites (Grob et al., 2007).
In all samples, the n-alkanols were dominated by the short-chain fatty alcohols of even carbon number (n-C14, n-C16 and n-C18), which are associated to zooplank-ton markers (Sargent et al., 1977). With the exception of the two gyre sites (GYR and 5
EGY), maximum concentrations of lineal alcohols were found below the depth of chloro-phyll maximum, at the upwelling sites (UPW, UPX) at 300 m and at the Marquesas sites (MAR, HNL) at 100 m depth. In the Gyre, maximum concentrations of n-alcohols coin-cided with the phytol maximum, though another peak (11.6 ng l−1) was registered at the surface of the GYR site. The fatty acids C20:1and C22:1, typical markers of herbivorous
10
mesozooplankton (Lee et al., 2006), exhibited the highest concentrations at the up-welling sites (UPW, UPX) at the depth of chlorophyll maximum, but also below the euphotic zone (300 m) at the MAR and UPX sites.
Similar to the phytol distribution, the concentrations of bacterial biomarkers, such as branched fatty acids, were highest at the UPW site (Table 3), whereas the concen-15
trations of zooplankton markers, such as cholesterol and n-alcohols exhibited higher abundance at UPX. In general, heterotrophic bacterial populations seemed to be as-sociated to diatom biomass, which is supported by the positive correlation between theδ13C of the branched fatty acid (i-C15 FA) and the δ
13
C of the C20:5 FA (r=0.81,
p<0.05). 20
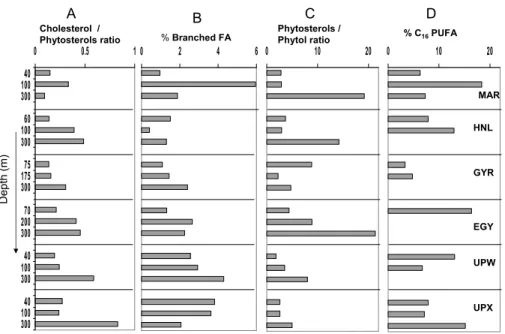
Some more insight into the phytoplankton distribution may be gained by comparing the relative contribution of the biomarkers within the total neutral lipids, which are il-lustrated in Fig. 1. The percentage of phototrophic biomarkers generally followed the chlorophyll distribution except at UPX, where phytol and diatoms markers peaked at 100 m depth. Also at HNL, phytol showed relatively high percentages down to 100 m 25
depth. This may be related to the highest relative importance of diatom sterol observed in the euphotic layer (Fig. 1b) and to the presence of diatoms which formed “balls of needles” or clusters (G ´omez et al., 2007). In contrast to the diatom biomarkers, the per-centage of total alkenones was by far highest in the gyre especially above the
chloro-BGD
4, 4653–4696, 2007
δ13C on lipid
biomarkers from the South East Pacific
I. Tolosa et al. Title Page Abstract Introduction Conclusions References Tables Figures ◭ ◮ ◭ ◮ Back Close
Full Screen / Esc
Printer-friendly Version
Interactive Discussion
phyll maximum (Fig. 1c), where also concentrations had been among the highest of all sites (Table 4). Prymnesiophytes were likely to be the major constituents of eukaryotic phytoplankton in the mixed surface layer of the gyre, suggesting that haptophytes are well adapted to the low nitrate concentrations prevailing in the oligotrophic zone of the Pacific Gyre. The C28∆
5,24(28)
sterol/alkenones ratio provides us with information about 5
the relative contribution of diatoms to prymnesiophytes. Highest ratios were obtained at the UPX site, and in particular below the euphotic zone. Haptophytes predominated over diatoms at the GYR site, especially above the chlorophyll maximum whereas the diatom signal showed a deeper maximum at 175 m corresponding to the maximum of both phytol and chlorophyll a. Dinosterol showed overall low percentages (<3%), 10
which indicated a minor contribution of dinoflagellates in the algal mixture of these Pacific waters, as it was also confirmed by pigment analyses (Ras et al., 2007).
Figure 2 illustrates other diagnostic biomarkers indices to evaluate the relative dom-inance of zooplankton and bacterial sources within each site as well as the state of the particulate material in the different zones. The cholesterol/phytosterol ratio which indi-15
cates dominance of zooplankton over phytoplankton increased with depth at all sites, and in particular at UPX. This was consistent with the substantial concentrations of n-alcohols and zooplanktonic C20:1and C22:1fatty acids found at 300 m depth. At most of the sites, the relative importance of bacterial fatty acids was higher below than at the depth of chlorophyll maximum. A contrasting image was observed at UPX where 20
this relative importance was lower. In fact, high bacterial production and a negative net community production were reported from the euphotic zone of UPX (Van Wambeke et al., 2007), which suggests rather “decomposing” conditions compared to “productive” conditions at UPW. At all sites, the ratio of phytosterols/phytol indicated more degraded phytoplankton material at depths below the chlorophyll maximum, but also above, at 25
the site of the gyre. This ratio showed a slightly more degraded material in the euphotic zone of the UPX site compared to UPW, but fresher material at 300 m depth of UPX.
The polyunsaturation index of C16 fatty acids (PUFA % of C16) is an indicator of
BGD
4, 4653–4696, 2007
δ13C on lipid
biomarkers from the South East Pacific
I. Tolosa et al. Title Page Abstract Introduction Conclusions References Tables Figures ◭ ◮ ◭ ◮ Back Close
Full Screen / Esc
Printer-friendly Version
Interactive Discussion
EGU C16:0 and C16:1FA, are synthesized during senescence, rather than during logarithmic
growth (Shin et al., 2000). The high indices observed in the euphotic zone of the UPW site and at 300 m depth of UPX suggest that these PUFA originated from diatoms at logarithmic growth. Moreover, the carbon isotope ratios of lipid biomarkers in the eu-photic zone were generally more enriched at UPW compared to UPX (Fig. 3), likely 5
indicating higher growth rates at UPW than at UPX. However, below the euphotic zone of UPX,δ13C values identified higher growth rates at depth compared to the surface. All these parameter point out that post-bloom conditions with high concentrations of animal-derived detritus prevailed at the surface of the UPX site, whereas the impor-tant signal of zooplankton and diatom markers below the euphotic layer indicated the 10
presence of zooplankton feeding on phytoplankton produced during bloom conditions. These findings are supported by the highest stock and flux measured at UPX com-pared to the UPW site (Miquel et al., 20072) and the high concentration of detritus and senescent colonial diatoms observed by microscope in samples from the euphotic zone at the UPX site (G ´omez, personal communication, 2006). These conclusions contrast, 15
however, with those derived from pigment biomarkers (Ras et al., 2007) where UPW site was characteristic of a typically mature bloom of diatoms and the phytoplankton at site UPX was probably at an early stage of development. Also, much higher nutrient concentrations at the surface of UPX site indicated a recent upwelling of deep water. Overall, these contrasted observations might be accounted for by the different turnover 20
and lability between pigment and lipid compounds which represent different pools of the particulate matter. Pigments are relatively more labile and associated with the living material. In contrast, lipids are included in both, the living and detrital particulate pools of the matter.
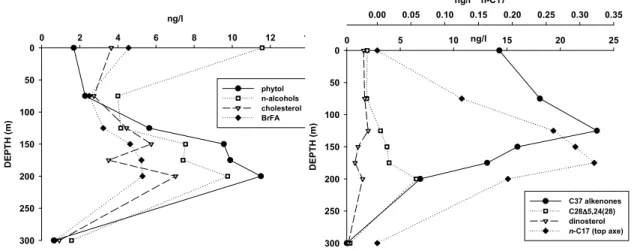
3.2 Vertical distribution of biomarkers in the center of the gyre 25
Depth profiles of selected accessory lipid biomarkers in suspended matter from the center of the Gyre are presented in Fig. 4. Phytol concentrations showed very low sur-face values and they were increasing progressively with depth, with maximum
concen-BGD
4, 4653–4696, 2007
δ13C on lipid
biomarkers from the South East Pacific
I. Tolosa et al. Title Page Abstract Introduction Conclusions References Tables Figures ◭ ◮ ◭ ◮ Back Close
Full Screen / Esc
Printer-friendly Version
Interactive Discussion
tration at 150–200 m depth. Relatively high concentrations of n-alcohols, cholesterol and branched fatty acids at the surface indicated an important heterotrophic activity in the upper waters. At higher depths (>75 m), both alcohols and cholesterol showed similar profiles as phytol, likely indicating that here, they were mainly phytoplanktonic-derived or that zooplankton biomass was strongly associated with the phytoplankton 5
abundance. Branched fatty acids which are derived from heterotropic bacteria exhib-ited the maximum concentration between 150 and 200 m depth, following the same trend as planktonic biomass. This feature indicates that the bacterial population is associated with the major planktonic biomass.
Other more specific phototrophic biomarkers, such as sterol markers for diatoms ex-10
hibited a similar profile as phytol with two maximum at 150 and 200 m depth. Only few macro diatom species, such as Nitzschia and Dactyliosolen were observed be-tween 200 and 300 m depth and a significant number of Bacteriastrum associated to a cyanobacteria symbiont was also observed around 140 m depth (G ´omez, personal communication, 2006). In contrast, the sterol marker for dinoflagellates exhibited a 15
uniform distribution from surface to 125 m depth and a deeper maximum concentra-tion at 200 m depth. Small dinoflagellates were observed in the surface waters of the Gyre center (G ´omez, personal communication, 2006). Then-alkane C17, which is
produced by cyanobacteria and other eukaryotic algae, increased with depth showing a maximum concentration between 125 and 175 m. This coincides with the maximum 20
abundances of Prochlorococcus and picoeukaryotes recorded between 100 and 200 m depth (Grob et al., 2007).
The C37 alkenones, which are specific markers for some algae of the class Hapto-phyceae/Prymnesiophyceae, including the coccolithophorid species such as Emiliana huxleyi, exhibited the maximum concentration above the deep chlorophyll maximum, at 25
125 m depth. Cell densities of different coccolitophorid taxa showed, however, different depth profiles, with a maximum peak between 150–200 m for Emiliana huxleyi whereas other taxa peaked at shallower depths (∼100 m) (Beaufort et al., 2007). These findings indicate that (i) other noncalcifying haptophytes might synthetize alkenones at
shal-BGD
4, 4653–4696, 2007
δ13C on lipid
biomarkers from the South East Pacific
I. Tolosa et al. Title Page Abstract Introduction Conclusions References Tables Figures ◭ ◮ ◭ ◮ Back Close
Full Screen / Esc
Printer-friendly Version
Interactive Discussion
EGU lower depths, (ii) that alkenones are not associated with the integrity of coccospheres
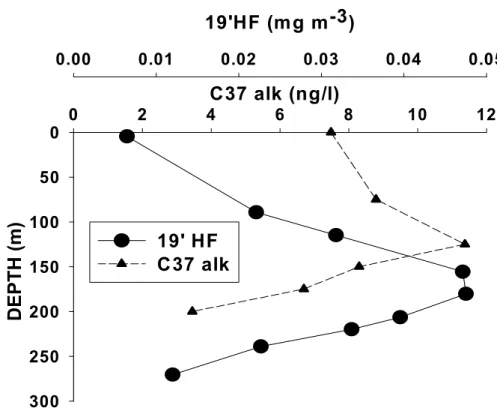
and/or (iii) that cellular alkenone concentrations varied with the physiological status and species composition of the coccolithiphorid assemblage. On the other hand, the concentration of alkenones and the accessory carotenoid 19’Hexanoyloxyfucoxanthin (19’HF) (Ras et al., 2007), characteristics of prymnesiophytes, also exhibited differ-5
ent depth distributions (Fig. 5). Such discrepancy reflects that alkenone-producers in these waters are small contributors to the 19’HF stock, and that the habitat of alkenone synthesizers diverges from that of the major phytoplankton taxa contributing to the 19’HF distribution. An analogous feature was observed at station ALOHA from the olig-otrophic North Pacific Subtropical Gyre (Prahl et al., 2005) and other studies showed 10
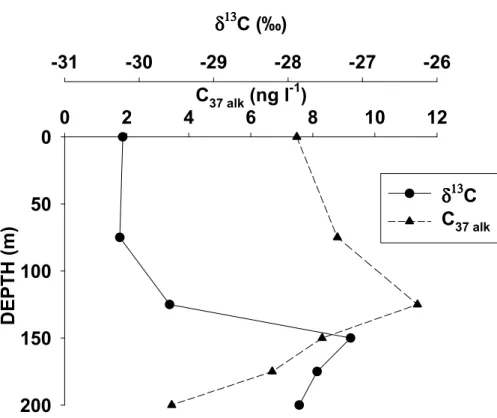
that 19′HF abundance was generally not tightly correlated with that of coccolithophorids (Dandonneau et al., 2006). Figure 6 illustrates the carbon isotope composition of the diunsaturated alkenone together with the total concentrations of C37 alkenones. More
enriched δ13C values which infer higher growth rates were obtained for those hap-tophytes inhabiting the depth of the chlorophyll maximum. However, the higher con-15
centrations of alkenones found at 125 m depth were associated to lowest growth rates which indicates a higher concentration of cellular alkenones. Similar observations were reported in nitrate-limited cultures where a small increase in the concentration of cellu-lar alkenones occurred with decreasing growth rates (Conte et al., 1998; Parrish et al., 1998).
20
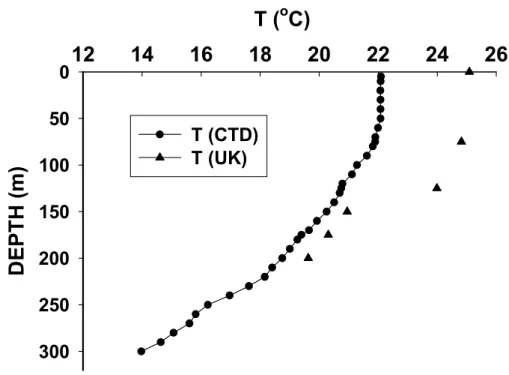
The growth unsaturation index (UK
′
37) which is widely used as a proxy of sea surface
temperature (Prahl and Wakeham, 1987) was calculated as the relative proportion of di-and triunsaturated C37 alkenones. This index was converted to a measure of tem-perature by the commonly used empirical calibration equation T =(UK
′
37−0.039)/0.034
(Prahl et al., 1988). The obtained results (Fig. 7), show that the in situ temperatures 25
of the surface layer were overestimated by 2–3 degrees. Discrepancies between the alkenone-calculated and observed temperatures might be caused by stress due to nu-trient limitation and to differences in the stage of the growth cycle (Conte et al., 1998; Epstein et al., 1998; Yamamoto et al., 2000), which result in variable alkenone
synthe-BGD
4, 4653–4696, 2007
δ13C on lipid
biomarkers from the South East Pacific
I. Tolosa et al. Title Page Abstract Introduction Conclusions References Tables Figures ◭ ◮ ◭ ◮ Back Close
Full Screen / Esc
Printer-friendly Version
Interactive Discussion
sis. Similar observations were reported in winter at ALOHA station (Prahl et al., 2005). They were explained by simply biogeographical variations observed in the alkenone vs. temperature relationship in natural waters, which may reflect differences in ge-netic and physiological status of the local alkenone-synthesizing populations. Since haptophytes have a low phosphorous requirement (critical concentrations of 0.2µM), 5
nitrogen limitation seems likely since inorganic N concentrations at the Gyre stations were well below the half-saturation constant (Ks, the concentration supporting an up-take rate one-half the maximum rate) determined for E. Huxley (≤0.5µM) (Eppley et al., 1969). Overall and according to batch cultures of haptophytes (Epstein et al., 1998), the observed increase in theUK
′
37 values with the consequent overestimation of the
tem-10
peratures, might indicate that this marine phytoplankton taxon is under nutrient-limited “stationary growth” conditions. This overestimation can also be explained by a change in the ecology of alkenone-producing algae (Popp et al., 2006) and by autoxidation of alkenones in these highly irradiated waters (Rontani et al., 2006), especially when residence times of particles are long.
15
3.3 Biogeochemical implications from carbon isotope fractionation
Stable carbon isotope differences between the inorganic carbon source and that of organic carbon synthesized by autotrophic organisms known as photosynthetic carbon fixation (εp), can assist in distinguishing between the different CO2 fixation pathways
(Table 5). Maximum carbon isotope fractionation of photoautotrophic organisms using 20
the Calvin cycle, like micro-algae and cyanobacteria is in the range of 20 to 27‰ (Popp et al., 1998b; Sakata et al., 1997). However, the εp expected for biomarkers derived
from eukaryotes can vary between 5 and 25‰ depending basically on [CO2], growth
rate and the ratio of cellular surface area to volume (Bidigare et al., 1997a; Popp et al., 1998). In contrast,εpfor prokaryotes (cyanobacteria) range between 16 and 22‰
25
because the large surface-to-volume ratio guarantees a large CO2 supply relative to
the cellular demand. Others pathways, apparently restricted to other bacteria, such as anoxygenic phototrophic bacteria, are the reversed tricarboxylic acid cycle and the
BGD
4, 4653–4696, 2007
δ13C on lipid
biomarkers from the South East Pacific
I. Tolosa et al. Title Page Abstract Introduction Conclusions References Tables Figures ◭ ◮ ◭ ◮ Back Close
Full Screen / Esc
Printer-friendly Version
Interactive Discussion
EGU 3-hydroxypropionate pathway, both of which are characterized by significantly smaller
isotope effects (εpof 2–14 ‰) (van der Meer et al., 2001).
We observed higher taxonomic variations inεp for eukaryotic algae growing in the oligotrophic areas (variations of ∼10 ‰) compared to the eutrophic sites of the up-welling (variations of 3 to 7‰). The variation of the carbon isotope fractionation for 5
the diatom marker covered a range of ∼16‰ along the different trophic systems. In contrast,εpof dinoflagellate and alkenone markers varied much less ca. 10 and 7‰, respectively.
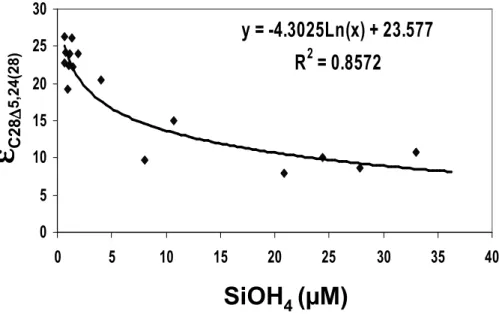
The carbon isotope fractionation of diatom markers exhibited a significant, nega-tive logarithmic correlation with measured silicate concentrations (εp=−4.3 ln[SiOH4]
10
+23.57, n=16, r=0.96, p<0.01, Fig. 8), whereas lower correlations were found with the other nutrients, nitrates and phosphates. Lower correlations were also obtained with theεpof dinoflagellates and no correlation was observed betweenεpof alkenone and nutrients. These findings confirm (Pancost et al., 1999) that silicate is likely one of the essential nutrients which control theεp and growth rates of diatoms in the Pacific 15
ocean.
The carbon isotope fractionation of diatom and dinoflagellate markers showed a neg-ative, linear correlation with [CO2]aq (rdiatom=0.94 (Fig. 9a), rdinoflagellate=0.91, n=16,
p<0.01). These relationships deviate from the previously reported general oceanic trend (Rau et al., 2001) and culture studies (Burkhardt et al., 1999a) where carbon 20
isotope fractionation increases (δ13C decrease) when [CO2]aq increases. However,
this apparent deviation has also been observed in Peruvian upwelling waters where it was suggested that a diatom carbon concentrating mechanism (CCM) was likely the cause of the lower εp of diatoms in these waters with high [CO2]aq. A much lower
correlation (r=0.75, n=14, p< 0.01) and a slope close to zero was observed for the εp
25
of alkenone (Fig. 9b) which agrees with other studies that showed the small effect of [CO2]aqon isotope fractionation in E. Huxleyi compared to potential changes ofεpdue
to growth rate and carbon uptake mechanisms (Benthien et al., 2007; Bidigare et al., 1997). No correlation was found between [CO2] and theεpofn-C17 (rCO2=0.37, n=6,
BGD
4, 4653–4696, 2007
δ13C on lipid
biomarkers from the South East Pacific
I. Tolosa et al. Title Page Abstract Introduction Conclusions References Tables Figures ◭ ◮ ◭ ◮ Back Close
Full Screen / Esc
Printer-friendly Version
Interactive Discussion
p=0.46) which is also consistent with a previous work (Popp et al., 1998b) who found for Synechococcus thatεpis independent of the concentration of dissolved CO2, likely
because its cell geometry guarantees a large CO2supply.
Overall, the lower isotope fractionation factors and smaller variations between the dif-ferent eukaryotic markers measured in the upwelling area might indicate uniformly high 5
growth rates for the three phytoplankton taxa, diatoms, haptophytes and dinoflagellates and/or that phytoplankton may employ carbon concentrating mechanisms (CCM) other than diffusion, which actively transport inorganic carbon into cells. Similar findings were reported by other authors (Pancost et al., 1999; Pancost et al., 1997; Rau et al., 2001; Werne and Hollander, 2004) who invoked that an active transport of bicarbonate 10
into the cell may still play a role in the carbon isotope fractionation by phytoplankon in upwelling areas with high concentrations of CO2.
In contrast, the GYR and EGY sites exhibited the highest carbon isotope fractiona-tion factors for eukaryotic algae and in particular for the diatom marker. Their values reached 25–26‰ which is close to the maximum isotope fractionation of eukaryotic 15
algae utilizing Rubisco andβ-carboxylase enzymes (Goericke et al., 1994; Laws et al., 1997). Such highεpvalues cannot be obtained by bicarbonate uptake and are
indica-tive of diffusive CO2 uptake. Moreover, active uptake of carbon in oligotrophic sites
is rather unlikely because of the higher metabolic energy required and CCM may be inhibited by the low oceanic concentrations of certain trace metals (Morel et al., 1994). 20
In these oligotrophic sites, lowestεp values were measured for the haptophytes and
dinoflagellates, which might infer higher growth rates for these organisms compared to diatoms.
In the mesotrophic areas of the Marquesas Islands (MAR and HNL sites),εpvalues
for alkenone producers and dinosterol were also lower than those for diatoms, but still 25
higher than those estimated in the upwelling area. The similarεpvalues for alkenones
measured in the poor-nitrated waters of the Gyre and in the high nutrient waters of the HNL site suggest that nitrogen and phosphate are not the limiting nutrients affecting carbon isotope fractionation by the prymnesiophyte algae. This finding contrasts with
BGD
4, 4653–4696, 2007
δ13C on lipid
biomarkers from the South East Pacific
I. Tolosa et al. Title Page Abstract Introduction Conclusions References Tables Figures ◭ ◮ ◭ ◮ Back Close
Full Screen / Esc
Printer-friendly Version
Interactive Discussion
EGU a study from the NE Pacific where nitrogen starvation seemed to affect the εpvalues
for alkenones (Eek et al., 1999) and adds further support to the “trace-metal-growth-rate” hypothesis (Bidigare et al., 1997), which suggested that micronutrients control growth regardless of the concentrations of PO4. Overall, the relatively lowεpvalues for
alkenones from the oligo- and mesotrophic waters seem to indicate the use of a CCM 5
other than diffusion. However, recent studies provided clear evidence that haptophytes have developed an inefficient but regulated CCM, with a direct uptake of HCO−3 (Rost
et al., 2003). The highestεp for dinoflagellates at the GYR and EGY sites are likely
associated to lower growth rates and might be explained by the low N:P ratios since optimum dinoflagellate growth occurs at ratios ranging between 6 and 15 (Hodgkiss 10
and Ho, 1997).
The carbon isotope fractionation derived from n-C17 alkane reached the values of
17–19‰ in the mesotrophic waters of the HNL and MAR sites, which are within the range of 16–22‰ reported for cyanobacteria biomass (Sakata et al., 1997). In contrast, the low carbon isotope fractionations (8 to 12‰) obtained for n-C17 in the oligotrophic 15
waters of the GYR and EGY sites as well as in the eutrophic waters of the upwelling area are suggestive of microorganisms which use CO2-concentrating mechanisms. Despite substantial advances over the past few years, in the understanding of the mechanism and genes involved in cyanobacterial CCMs (Badger and Price, 2003), the induction of the CCM mechanism remains to be determined (McGinn et al., 2003; 20
Woodger et al., 2005). On the other hand, since similarεpvalues were measured in
the upwelling area for biomarkers derived from eukaryotic plankton, it cannot be ruled out thatn-C17in the upwelling sites is mainly derived from some eukaryotic source.
The b-values and growth rates for alkenone-producing haptophytes varied almost tenfold, ranging from 65 to 500‰µmol kg−1and from 0.21 to 1.7 d−1, respectively. The 25
highest growth rates were estimated in the waters of the Chilean upwelling, followed by the EGY (0.47 d−1), the GYR (0.35 d−1) and finally the MAR and HNL (0.27–0.29 d−1) sites. The lowest values were found in the surface waters of the Gyre (0.21 d−1). Over-all, our b-values and growth rates compare to those reported for the Bering Sea,
Ara-BGD
4, 4653–4696, 2007
δ13C on lipid
biomarkers from the South East Pacific
I. Tolosa et al. Title Page Abstract Introduction Conclusions References Tables Figures ◭ ◮ ◭ ◮ Back Close
Full Screen / Esc
Printer-friendly Version
Interactive Discussion
bian Sea, Southern Ocean and equatorial Pacific at 140◦W (84–136µmol kg−1 and 0.2–0.4 d−1) (Bidigare et al., 1997; Harada et al., 2003; Laws et al., 2001) but they are slightly higher than those reported from the Peru upwelling zone (197–397µmol kg−1 and 0.5–1 d−1) (Bidigare et al., 1997). This is probably related to the strength of the upwelling as indicated by the higher nutrient and CO2concentrations of our samples.
5
The b-values for the alkenone synthesizer phytoplankton correlated with concentra-tions of silicate, nitrate and phosphate concentraconcentra-tions. However, these correlaconcentra-tions might not indicate that the nutrients themselves are the growth limiting factor, since a natural correlation between concentrations of dissolved CO2 and nutrients occurred. Instead, specific growth rate may be controlled by some trace micronutrient that co-10
varies with CO2, silicate, nitrates and phosphate concentrations (Bidigare et al., 1997;
Shaked et al., 2006).
4 Summary and conclusions
Our results along the different trophic systems, showed that source-specific algal biomarkers and compound specific isotope analyses largely responded to the com-15
position of the phytoplankton and to the different processes of carbon acquisition. It has become clear that natural variability in carbon isotope fractionation among algal taxa, is a consequence of multiple factors. Although further studies are needed to clearly define the relationship betweenεpand the specific-growth rates of the different phytoplankton taxa, our field study illustrates the large shift in isotopic fractionation by 20
the different groups of phytoplankton taxa which should reflect the high variability in growth rates and carbon assimilation mechanisms. As a summary, we identified the upwelling zone as the one with highest algal biomass, most developed carbon concen-tration mechanisms and highest growth rates. In contrast, the oligotrophic area of the Gyre was characterized by the lowest concentration levels of phyto, zoo- and bacterial 25
markers, extremely deep concentration maxima, relatively high contribution of hapto-phytes and high carbon isotope fractionation factors indicative of low growth rates and
BGD
4, 4653–4696, 2007
δ13C on lipid
biomarkers from the South East Pacific
I. Tolosa et al. Title Page Abstract Introduction Conclusions References Tables Figures ◭ ◮ ◭ ◮ Back Close
Full Screen / Esc
Printer-friendly Version
Interactive Discussion
EGU higher diffusive CO2uptake.
Acknowledgements. We thank J. Orr and C. Goyet for helpful science discussions. D. Tailliez and C. Bournot are warmly thanked for their efficient help in CTD rosette management and data processing. This is a contribution of the BIOSOPE project of the LEFE-CYBER program. This research was funded by the Centre National de la Recherche Scientifique (CNRS), the
5
Institut des Sciences de l’Univers (INSU), the Centre National d’Etudes Spatiales (CNES), the European Space Agency (ESA), The National Aeronautics and Space Administration (NASA) and the Natural Sciences and Engineering Research Council of Canada (NSERC). The IAEA is grateful for the support provided to its Marine Environment Laboratories by the Government of the Principality of Monaco.
10
References
Azouzi, L., Gonc¸alves Ito, R., Touratier, F., and Goyet, C.: Anthropogenic carbon in the eastern South Pacific Ocean, Biogeosciences Discuss., 4, 1815–1837 2007.
Badger, M. R. and Price, G. D.: CO2concentrating mechanisms in cyanobacteria: molecular components, their diversity and evolution, J. Exp. Bot., 54, 609–622, 2003.
15
Baker, E. W. and Louda, J. W.: Thermal aspects in chlorophyll geochemistry, in: Adv. Org. Geochem., 1981, edited by: M. Bjorøy, Wiley, Chichester, 401–421, 1983
Barlow, R. G., Mantoura, R. F. C., Gough, M. A., and Fileman, T. W.: Pigment signatures of the phytoplankton composition in the northeastern Atlantic during the 1990 spring bloom, Deep Sea-Res. Pt. II, 40, 459–477, 1993.
20
Beaufort, L., Couapel, M., Buchet, N., and Claustre, H.: Calcite production by Coccolithophores in the South East Pacific Ocean: from desert to jungle, Biogeosciences Discuss., 4, 3267– 3299, 2007,
http://www.biogeosciences-discuss.net/4/3267/2007/.
Benthien, A., Zondervan, I., Engel, A., Hefter, J., Terbruggen, A., and Riebesell, U.: Carbon
25
isotopic fractionation during a mesocosm bloom experiment dominated by Emiliania huxleyi: Effects of CO2concentration and primary production, Geochim. Cosmochim. Ac., 71, 1528–
1541, 2007.
Bidigare, R. R., Fluegge, A., Freeman, K. H., Hanson, K. L., Hayes, J. M., Hollander, D., Jasper, J. P., King, L. L., Laws, E. A., Milder, J., Millero, F. J., Pancost, R. D., Popp, B. N., Steinberg,
BGD
4, 4653–4696, 2007
δ13C on lipid
biomarkers from the South East Pacific
I. Tolosa et al. Title Page Abstract Introduction Conclusions References Tables Figures ◭ ◮ ◭ ◮ Back Close
Full Screen / Esc
Printer-friendly Version
Interactive Discussion P. A., and Wakeham, S. G.: Consistent fractionation of C in nature and in the laboratory:
growth-rate effects in some haptophyte algae, Global Biogeochem. Cy., 11, 279–292, 1997. Bidigare, R. R., Hanson, K. L., Buesseler, K. O., Wakeham, S. G., Freeman, K. H., Pancost, R.
D., Millero, F. J., Steinberg, P. A., Popp, B. N., Latasa, M., Landry, M. R., and Laws, E. A.: Iron-stimulated changes in13C fractionation and export by equatorial Pacific phytoplankton:
5
Toward a paleogrowth rate proxy, Paleoceanography, 14, 589–595, 1999.
Burkhardt, S., Riebesell, U., and Zondervan, I.: Effects of growth rate, CO2 concentration,
and cell size on the stable carbon isotope fractionation in marine phytoplankton, Geochim. Cosmochim. Ac., 63, 3729–3741, 1999a.
Burkhardt, S., Riebesell, U., and Zondervan, I.: Stable carbon isotope fractionation by marine
10
phytoplankton in response to daylength, growth rate, and CO2availability, Mar. Ecol.-Progr. Ser., 184, 31–41, 1999b.
Claustre, H., Hooker, S. B., Van Heukelem, L., Berthon, J.-F., Barlow, R., Ras, J., Sessions, H., Targa, C., Thomas, C. S., van der Linde, D., and Marty, J.-C.: An intercomparison of HPLC phytoplankton pigment methods using in situ samples: application to remote sensing and
15
database activities, Mar. Chem., 85, 41–61, 2004.
Conte, M. H., Thompson, A., Eglinton, G., and Green, J. C.: Lipid biomarker diversity in the coc-colithophorid Emiliania huxleyi (Prymnesiophyceae) and the related species Gephyrocapsa oceanica, J. Phycol., 31, 272–282, 1995.
Conte, M. H., Thompson, A., Lesley, D., and Harris, R. P.: Genetic and Physiological Influences
20
on the Alkenone/Alkenoate Versus Growth Temperature Relationship in Emiliania huxleyi and Gephyrocapsa Oceanica, Geochim. Cosmochim. Ac., 62, 51–68, 1998.
Conte, M. H., Weber, J. C., King, L. L., and Wakeham, S. G.: The alkenone temperature signal in western North Atlantic surface waters, Geochim. Cosmochim. Ac., 65, 4275–4287, 2001. Craig, H.: Abyssal carbon 13 in the South Pacific, J. Geophys. Res. 75, 691–695, 1970.
25
Dandonneau, Y., Montel, Y., Blanchot, J., Giraudeau, J., and Neveux, J.: Temporal variability in phytoplankton pigments, picoplankton and coccolithophores along a transect through the North Atlantic and tropical southwestern Pacific, Deep Sea- Res. Pt. I, 53, 689–712, 2006. Dijkman, N. A. and Kromkamp, J. C.: Phospholipid-derived fatty acids as chemotaxonomic
markers for phytoplankton: application for inferring phytoplankton composition, Mar.
Ecol.-30
Progr. Ser., 324, 113–125, 2006.
DOE: Handbook of Methods for Analysis of the Various Parameters of the Carbon Dioxide System in Seawater; version 2, edited by: Dickson, A. G. and Goyet, C., ORNL/CDIAC-74,
BGD
4, 4653–4696, 2007
δ13C on lipid
biomarkers from the South East Pacific
I. Tolosa et al. Title Page Abstract Introduction Conclusions References Tables Figures ◭ ◮ ◭ ◮ Back Close
Full Screen / Esc
Printer-friendly Version
Interactive Discussion
EGU
1994.
Eek, M. K., Whiticar, M. J., Bishop, J. K. B., and Wong, C. S.: Influence of nutrients on carbon isotope fractionation by natural populations of Prymnesiophyte algae in NE Pacific, Deep Sea-Res. Pt II, 46, 2863–2876, 1999.
Eppley, R. W., Rogers, J. N., and McCarthy, J. J.: Half-saturation constants for uptake of nitrate
5
and ammonium by marine phytoplankton, Limnol. Oceanogr., 14, 912–920, 1969.
Epstein, B. L., D’Hondt, S., Quinn, J. G., Zhang, J., and Hargraves, P. E.: An effect of dissolved nutrient concentrations on alkenone-based temperature estimates, Paleoceanography, 13, 122–126, 1998.
Falkowski, P. G.: Physiological responses of phytoplankton to natural light regimes, J. Plankton
10
Res., 6, 295–307, 1984.
Falkowski, P. G., Barber, R. T., and Smetacek, V.: Biogeochemical controls and feedbacks on ocean primary production, Science, 281, 200–206, 1998.
Freeman, K. H. and Hayes, J. M.: Fractionation of carbon isotopes by phytoplankton and esti-mates of ancient CO2levels, Global Biogeochem. Cy., 6, 185–198, 1992.
15
Freeman, K. H., Hayes, J. M., Trendel, J. M., and Albrecht, P.: Evidence from carbon iso-tope measurements for diverse origins of sedimentary hydrocarbons, Nature, 343, 254–256, 1990.
Goericke, R., Montoya, J. P., and Fry, B.: Physiology of isotopic fractionation in algae and cyanobacteria. In: Stable Isotopes in Ecology and Environmental Science, Blackwell Science
20
Publishers, 187–221, 1994.
G ´omez, F., Claustre, H., Raimbault, P., and Souissi, S.: Two High-Nutrient Low-Chlorophyll phytoplankton assemblages: the tropical central Pacific and the offshore Per ´u-Chile Current, Biogeosciences Discuss., 4, 1535–1554, 2007,
http://www.biogeosciences-discuss.net/4/1535/2007/.
25
Goyet, C. and Poisson, A.: New determination of carbonic acid dissociation constants in sea-water as a function of temperature and salinity, Deep Sea-Res., 36, 1635–1654, 1989. Grob, C., Ulloa, O., Claustre, H., Huot, Y., Alarc ´on, G., and Marie, D.: Contribution of
pi-coplankton to the total particulate organic carbon concentration in the eastern South Pacific, Biogeosciences, 4, 837–852, 2007,
30
http://www.biogeosciences.net/4/837/2007/.
Han, J. and Calvin, M.: Hydrocarbon Distribution of Algae and Bacteria, and Microbiological Activity in Sediments, P. Natl. Acad. Sci. USA, 64, 436–443, 1969.
BGD
4, 4653–4696, 2007
δ13C on lipid
biomarkers from the South East Pacific
I. Tolosa et al. Title Page Abstract Introduction Conclusions References Tables Figures ◭ ◮ ◭ ◮ Back Close
Full Screen / Esc
Printer-friendly Version
Interactive Discussion Harada, N., Shin, K. H., Murata, A., Uchida, M., and Nakatani, T.: Characteristics of alkenones
synthesized by a bloom of Emiliania Huxleyi in the Bering Sea, Geochim. Cosmochim. Ac., 67, 1507–1519, 2003.
Hayes, J. M.: Factors controlling13C contents of sedimentary organic compounds: Principles and evidence, Mar. Geol., 113, 111–125, 1993.
5
Hayes, J. M., Freeman, K. H., Popp, B. N., and Hoham, C. H.: Compound-specific isotopic anal-yses: A novel tool for reconstruction of ancient biogeochemical processes, Org. Geochem., 16, 1115–1128, 1990.
Hodgkiss, I. J. and Ho, K. C.: Are changes in N:P ratios in coastal waters the key to increased red tide blooms?, Hydrobiologia, 352, 141–147, 1997.
10
Irwin, A. J., Finkel, Z. V., Schofield, O. M. E., and Falkowski, P. G.: Scaling-up from nutrient physiology to the size-structure of phytoplankton communities, J. Plankton Res., 28, 459– 471, 2006.
Jones, D. M., Carter, J. F., Eglinton, G., Jumeau, E. J., and Fenwick, C. S.: Determination of δxzC values of sedimentary straight chain and cyclic alcohols by gas chromatography/isotope
15
ratio mass spectrometry, Biol. Mass Spetrom., 20, 641–646, 1991.
Kaneda, T.: Iso- and anteiso-fatty acids in bacteria: biosynthesis, function, and taxonomic significance. Microbiol. Rev., 55, 288-302, 1991.
Laws, E. A., Bidigare, R. R., and Popp, B. N.: Effect of growth rate and CO2 concentration
on carbon isotopic fractionation by the marine diatom Phaeodactylum tricornutum, Limnol.
20
Oceanogr., 42, 1552–1560, 1997.
Laws, E. A., Popp, B. N., Bidigare, R. R., Kennicutt, M. C., and Macko, S. A.: Dependence of phytoplankton carbon isotopic composition on growth rate and [CO2]aq: Theoretical consid-erations and experimental results, Geochim. Cosmochim. Ac., 59, 1131–1138, 1995. Laws, E. A., Popp, B. N., Bidigare, R. R., Riebesell, U., Burkhardt, S., and Wakeham, S.
25
G.: Controls on the molecular distribution and carbon isotopic composition of alkenones in certain haptophyte algae, Geochem. Geophy. Geosy., 2, 2000GC000057, 2001.
Lee, R. F., Hagen, W., and Kattner, G.: Lipid storage in marine zooplankton, Mar. Ecol.-Progr. Ser., 307, 273–306, 2006.
Lewis, E., and Wallace, D. W. R.: Program Developed for CO2 System Calculations.
30
ORNL/CDIAC-105. Carbon Dioxide Information Analysis Center, Oak Ridge National Lab-oratory, U.S. Department of Energy, Oak Ridge, Tennessee, 1998.
Multi-BGD
4, 4653–4696, 2007
δ13C on lipid
biomarkers from the South East Pacific
I. Tolosa et al. Title Page Abstract Introduction Conclusions References Tables Figures ◭ ◮ ◭ ◮ Back Close
Full Screen / Esc
Printer-friendly Version
Interactive Discussion
EGU
nutrient, multi-group model of present and future oceanic phytoplankton communities, Bio-geosciences, 3, 585–606, 2006,
http://www.biogeosciences.net/3/585/2006/.
Mackey, M. D., Mackey, D. J., Higgins, H. W., and Wright, S. W.: CHEMTAX - a program for estimating class abundances from chemical markers: application to HPLC measurements of
5
phytoplankton, Mar. Ecol.-Progr. Ser., 144, 265–283, 1996.
McGinn, P. J., Price, G. D., Maleszka, R., and Badger, M. R.: Inorganic Carbon Limitation and Light Control the Expression of Transcripts Related to the CO2-Concentrating Mechanism in the Cyanobacterium Synechocystis sp. Strain PCC6803, Plant Physiol., 132, 218–229, 2003.
10
Mook, W. G., Bommerson, J. C., and Staverman, W. H.: Carbon isotope fractionation between dissolved bicarbonate and gaseous carbon dioxide, Earth Planet. Sc. Lett., 22, 169–176, 1974.
Morel, F. M. M., Reinfelder, J. R., Roberts, S. B., Chamberlain, C. P., Lee, J. G., and Yee, D.: Zinc and carbon co-limitation of marine phytoplankton, Nature, 369, 740–742, 1994.
15
Muhlebach, A. and Weber, K.: Origins and fate of dissolved sterols in the Weddell Sea, Antarc-tica, Org. Geochem., 29, 1595–1607, 1998.
Pancost, R. D., Freeman, K. H., and Wakeham, S. G.: Controls on the carbon-isotope compo-sitions of compounds in Peru surface waters, Org. Geochem., 30, 319–340, 1999.
Pancost, R. D., Freeman, K. H., Wakeham, S. G., and Robertson, C. Y.: Controls on carbon
20
isotope fractionation by diatoms in the Peru upwelling region, Geochim. Cosmochim. Ac., 61, 4983–4991, 1997.
Parrish, C. C., Wells, J. S., Yang, Z., and Dabinett, P.: Growth and lipid composition of scallop juveniles, Placopecten magellanicus, fed the flagellate Isochrysis galbana with varying lipid composition and the diatom Chaetoceros muelleri, Mar. Biol., 133, 461–471, 1998.
25
Pinturier-Geiss, L., Mejanelle, L., Dale, B., and Karlsen, D. A.: Lipids as indicators of eutrophi-cation in marine coastal sediments, J. Microbiol. Meth., 48, 239–257, 2002.
Popp, B. N., Kenig, F., Wakeham, S. G., Laws, E. A., and Bidigare, R. R.: Does growth rate affect ketone unsaturation and intracellular carbon isotope variability in Emiliania huxleyi?, Paleoceanography, 13, 35–41, 1998a.
30
Popp, B. N., Laws, E. A., Bidigare, R. R., Dore, J. E., Hanson, K. L., and Wakeham, S. G.: Effect of phytoplankton cell geometry on carbon isotopic fractionation, Geochim. Cosmochim. Ac., 62, 69–77, 1998b.
BGD
4, 4653–4696, 2007
δ13C on lipid
biomarkers from the South East Pacific
I. Tolosa et al. Title Page Abstract Introduction Conclusions References Tables Figures ◭ ◮ ◭ ◮ Back Close
Full Screen / Esc
Printer-friendly Version
Interactive Discussion Popp, B. N., Prahl, F. G., Wallsgrove, R. J., and Tanimoto, J.: Seasonal patterns of alkenone
production in the subtropical oligotrophic North Pacific, Paleoceanography, 21, PA1004, doi:10.1029/2005PA001165, 2006.
Prahl, F. G., Muehlhausen, L. A., and Zahnle, D. L.: Further evaluation of long-chain alkenones as indicators of paleoceanographic conditions, Geochim. Cosmochim. Ac., 52, 2303–2310,
5
1988.
Prahl, F. G., Popp, B. N., Karl, D. M., and Sparrow, M. A.: Ecology and biogeochemistry of alkenone production at Station ALOHA, Deep Sea-Res. Pt I, 52, 699–719, 2005.
Prahl, F. G. and Wakeham, S. G.: Calibration of unsaturation patterns in long-chain ketone compositions for palaeotemperature assessment, Nature, 330, 367–369, 1987.
10
Raimbault, P., Garcia, N. and Cerutti, F.: Distribution of inorganic and organic nutrients in the South Pacific Ocean; -evidence for long-term accumulation of organic matter in nitrogen-depleted waters, Biogeosciences Discuss., 4, 3041–3087, 2007,
http://www.biogeosciences-discuss.net/4/3041/2007/.
Rau, G. H., Chavez, F. P., and Friederich, G. E.: Plankton 13C/12C variations in Monterey
15
Bay, California: evidence of non-diffusive inorganic carbon uptake by phytoplankton in an upwelling environment, Deep Sea-Res. Pt. I, 48, 79–94, 2001.
Ras, J., Claustre, H. and Uitz, J.: Spatial variability of phytoplankton pigment distributions in the Subtropical South Pacific Ocean: comparison between in situ and predicted data, Biogeosciences Discuss., 4 3409–3451, 2007.
20
Rau, G. H., Riebesell, U., and Wolf-Gladrow, D.: A model of photosynthetic C fractionation by marine phytoplankton based on diffusive molecular CO2uptake, Mar. Ecol.-Progr. Ser., 133,
275–285, 1996.
Riebesell, U., Revill, A. T., Holdsworth, D. G., and Volkman, J. K.: The effects of varying CO2 concentration on lipid composition and carbon isotope fractionation in Emiliania
hux-25
leyi, Geochim. Cosmochim. Ac., 64, 4179–4192, 2000.
Robinson, N., Eglinton, G., Brassell, S. C., and Cranwell, P. A.: Dinoflagellate origin for sedi-mentary 4αmethylsteroids and 5α(H)-stanols, Nature, 308, 419–422, 1984.
Rontani, J.-F., Marty, J.-C., Miquel, J.-C., and Volkman, J. K.: Free radical oxidation (autoxi-dation) of alkenones and other microalgal lipids in seawater, Org. Geochem., 37, 354–368,
30
2006.
Rost, B., Riebesell, U., Burkhardt, S., and Sultemeyer, D.: Carbon acquisition of bloom-forming marine phytoplankton, Limnol. Oceanogr., 48, 55–67, 2003.