Development of an Integrated Microfluidic Platform for
Oxygen Sensing and Delivery
by
Adam P. Vollmer B.S. Mechanical Engineering
Stanford University, 2002
SUBMITTED TO THE DEPARTMENT OF MECHANICAL ENGINEERING IN PARTIAL FULFILLMENT OF THE REQUIREMENTS FOR THE DEGREE OF
MASTER OF SCIENCE IN MECHANICAL ENGINEERING AT THE
MASSACHUSETTS INSTITUTE OF TECHNOLOGY _______________
JUNE 2005
OF TECHNOLOGYJ UN 1
6
2005
C 2005 Massachusetts Institute of Technology.All rights reserved
LIBRARIES
Signature of Author:
Department of Mechanical Engineering May 6, 2005
Certified by:
Todd Thorsen Assistant Professor of Mechanical Engineering \A Thesis Supervisor Certified by:IA1
C b: Richard Gilbert Visiting Scientist, Department of echanical Engineering Thesis Supervisor Accepted by:
Lallit Anand Graduate Officer, Department of Mechanical Engineering
Development of an Integrated Microfluidic Platform for
Oxygen Sensing and Delivery
by
Adam P. Vollmer
Submitted to the Department of Mechanical Engineering on May, 6,
2005 in Partial Fulfillment of the Requirements for the Degree of Master
of Science in Mechanical Engineering
Abstract
Treatment for end stage lung disease has failed to benefit from advances in medical technology that have produced new treatments for cardiovascular disease, certain cancers, and other major illnesses in recent years. As a result, end stage lung disease remains a devastating condition with few therapeutic options. To address the need for improved methods of respiratory life support, a novel technology was developed capable of generating oxygen directly from water present in blood plasma. This technology is intended to provide a self-contained, mobile oxygen supply suitable for implantation or extracorporeal oxygenation in support of an acute or chronically disabled lung. The core technology couples an optoelectronic metal oxide film with a microfluidic capillary network to facilitate oxygen exchange with flowing blood and replicate pulmonary capillary respiration. This thesis focuses on the optimization of this microfluidic capillary network with respect to hemocompatibility, mass transfer, and dissolved oxygen detection.
Microfluidic capillary devices were fabricated from silicone rubber using multilayer soft lithography to create dense 2D networks of bifurcating channels. To quantify the effectiveness of mass transfer in various channel geometries under differing experimental conditions, a mathematical model of oxygen convection and diffusion was generated. A novel integrated optical oxygen sensor based on an oxygen-quenched luminescent dye was developed to detect oxygen concentrations within the microfluidic device. Mass transfer within the microfluidic oxygenator was characterized experimentally, employing the integrated optical sensor, and analytically, using the convective model. Excellent agreement was found between experimental and analytical results.
We conclude that the microfluidic platform achieves rapid and efficient diffusion of oxygen into a liquid medium, effectively mimicking the function of the pulmonary system. The combination of precise oxygen delivery and detection, integrated into a miniature device, is widely applicable both to the photolytic artificial lung and to a broader class of applications related to detection of chemical species in biological microdevices.
Thesis Supervisors: Todd Thorsen
Title: Assistant Professor of Mechanical Engineering Richard Gilbert
Acknowledgements
Scores of friends and colleagues have contributed to making my experience at MIT more (and less) productive, more enlightening, and more rewarding than would ever have been possible without their advice, encouragement, and good company.
I would like to thank Todd Thorsen and Richard Gilbert for sharing their wisdom and good humor as my thesis advisors. You challenged me to maximize my experience as a graduate student by exploring new scientific directions. A special thanks to Harry Lee for selflessly providing an unlimited supply of good advice and guidance in my research efforts, and to Prof. Ronald Probstein for enlightening me in the science of mass transfer.
A special thank you goes out to the other half of the Thorsen group, JP Urbanski, whose fine taste in quality music, deep love of coffee and muffins, and masterful skills with the one-liner made the lab a good place to be. Thanks for helping to pass countless hours in the HML - sharing a desk with anyone else will never compare.
Thank you to my collective roommates over the past two years, Israel, Kyle, Hunt, Mo, Jess, Pete, Kathie (almost) and others. Yes, there are a lot of you. At the times when it felt like I lived in the lab, thanks for reminding me of all the good things I had to look forward to at home. Israel, thank you especially for Science Explorers. I may have learned more while dodging out of lab to build bottle rockets and volcanoes than I learned in my research and coursework combined.
Brady, thanks for staying close even though you were very far away.
Finally, thank you to my family, Mom, Dad, Eric, and Joanie. You have inspired me to be here. Thank you for always being there to share my excitement.
Contents
A b stra ct... 3
Acknowledgements ... 5
C o n ten ts ... 7
List of Tables and Figures... 9
1. In trod u ction ... 13
1.1 Mechanical respiration for treatment of lung disease ... 14
1.2 Development and applications of a photolytic oxygenator... 15
1.2.1 Organ Preservation... 16
1.2.2 Implantable Artificial Lung ... 16
1.2.3 Additional micro-biological applications ... 17
2. Fundamental Technologies ... 19
2.1 Photolytic Oxygen Generation: Concept ... 19
2.2 Photolytic Oxygen Generation: Validation... 22
2.3 Multilayer soft lithography microfluidics... 24
2.3.1 Microfluidics: Optimizing diffusion-limited mass transport ... 24
2.3.2 Multilayer soft lithography microfluidic fabrication ... 25
3. Conceptualization of multi-layer microfluidic device ... 29
3.1 Microfluidic device design: Primary objectives ... 29
3.1.1 Hemocompatibility ... 29
3.1.2 Macrofluidic and microfluidic flow regimes ... 30
3.1.3 Blood oxygenation... 31
3.2 Device construct and passive oxygenation ... 31
4. Network Design: Evolutions... 37
4.1 Scaling laws and capillary geometry ... 37
4.1.1 Scaling laws: geometric limitations ... 39
5. Optimization and Characterization of Mass Transfer ... 47
5.1 Dimensional analysis of convective mass transfer ... 47
5.2 Experimental protocol and introduction to oxygen sensing ... 49
5.3 Clarke electrode oxygen sensing ... 50
5.3.1 Operational principles of Clarke electrode oxygen sensing ... 50
5.3.2 Inherent limitations of the Clarke electrode... 52
5.4 Optical oxygen sensing ... 55
5.4.1 Operational principles of luminescent optical oxygen sensing... 55
5.4.2 Fabrication of optical sensor... 57
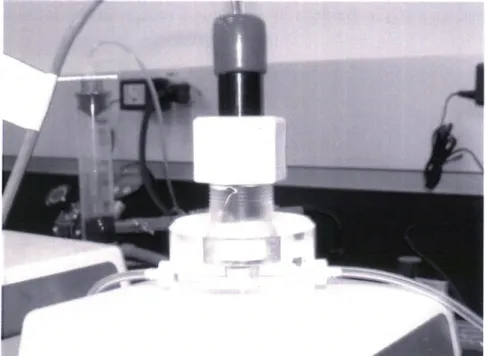
5.4.3 Optical and electrical apparatus ... 63
5.4.4 Methodology for oxygen detection: Phase-based lifetime sensing... 66
5.4.5 A protocol for sensor operation and signal post-processing ... 68
5.4.6 Sensor performance and calibration in gaseous samples... 74
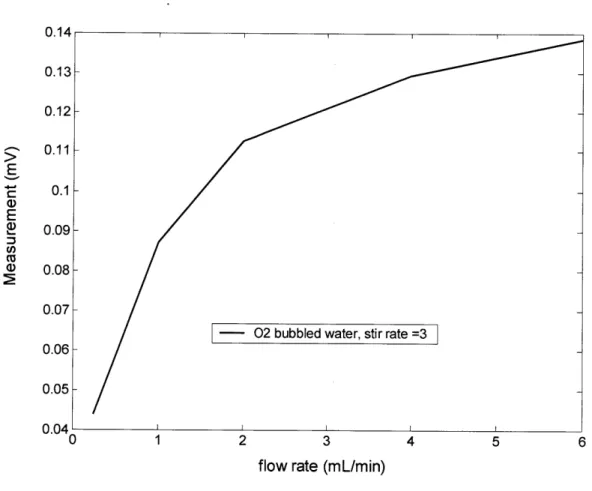
5.4.7 Sensor performance and calibration in fluidic samples ... 76
5.4.8 Photobleaching and stability... 78
5.5 Modeling of mass transfer in the microfluidic oxygenator... 79
6. H em ocom patibility... 87
6.1 Preliminary results on microchannel hemocompatibility ... 87
6.2 Future device designs for optimal blood flow ... 90
7. Sum m ary and C onclusions ... 93
A . M icrofluidic fabrication ... 97
A. 1 Fabrication of Su-8 soft lithography mold... 97
A.2 PDMS soft lithography fabrication... 98
B. Electronic circuit design for optical oxygen sensor... 101
C. Optical sensor data aquisition and Labview module... 109
List of Tables and Figures
Figure 2.1: "Sandwich" structure of elements in photolytic oxygenator design. ... 20
Figure 2.2: Dissolved 02 concentration in aqueous photolytic test cell. ... 23
Figure 2.3: Percent oxygen concentration in whole blood ... 23
Table 2.1: Approximate diffusion times for oxygen in water... 25
Figure 2.4: Polymeric stamping of a microfluidic device through soft lithography... 26
Figure 2.5: Photoresist m old... 27
Figure 2.6: M ulti-layer soft lithography ... 28
Figure 3.1: Contraction flow of a non-newtonian viscoelastic fluid ... 30
Figure 3.2: Conceived structure for photolytic oxygenation module ... 32
Figure 3.3: Sigmoidal oxygen affinity curve for blood ... 33
Figure 3.4: Cross section of fluid and gas channels in two-layer device... 34
Figure 3.5: Two-layer device for passive oxygenation... 35
Figure 4.1: Bifurcation geometry for Murray's Law ... 38
Figure 4.2: Evolution of arborizing microchannel designs... 41
Figure 4.3: Master photolithography template... 41
Figure 4.4: Channel dimension versus channel rank ... 44
Figure 4.5: Calculated channel characteristics as a function of branching rank... 45
Figure 5.1: Schematic of Clarke electrode operation... 51
Figure 5.2: Clarke 02 electrode connected in-line with fluid circuit... 52
Figure 5.3: Clarke 02 electrode oxygenation data... 53
Figure 5.6: Configuration of PtOEPK-polystyrene sensor ... 58
Figure 5.7: Microporous etched surface of glass slide ... 60
Figure 5.8: PtO EPK absorbance ... 62
Figure 5.9: M ulti-layer m icrofluidic device... 62
Figure 5.10: Optical and electrical components ... 64
Figure 5.11: Optical sensor assem bly ... 65
Figure 5.12: Signal stability comparison ... 67
Figure 5.13: Raw data signal for detection of dissolved 02 in fluid sample ... 68
Figure 5.14: Raw calibration data for 5-point oxygen concentrations... 69
Figure 5.15: Equilibrium values for phase shift in 5-point sensor calibration... 69
Figure 5.16: Individual values for phase shift in 5-point sensor calibration ... 70
Figure 5.17: Calibration datapoints versus flowrate... 71
Figure 5.18: Oxygen sensor calibration curves, normalized... 72
Figure 5.19: Thin-film PtOEPK-ps dynamic sensor response, gaseous oxygen ... 75
Figure 5.20: Stern-Volmer plot for thin-film PtOEPK-ps sensor ... 75
Figure 5.21: Dynamic sensor response for dissolved oxygen... 77
Figure 5.22: Stern-Volmer plot for detection of dissolved oxygen ... 77
Figure 5.23: Photobleaching test... 78
Figure 5.24: Geometry of the mass transfer scenario. ... 80
Figure 5.25: Sherw ood num ber... 84
Figure 5.26: Mixed-mean 02 concentration plotted versus L*... 85
Figure 6.2: Microchannel images following 5 min. blood perfusion ... 89
Figure 6.3: Microchannel image following 45 min. blood perfusion... 89
Figure 6.4: M icrofluidic chamber design... 90
Figure 6.5: "Mesh" style interwoven fluidic network design ... 91
Figure B. 1: Circuit diagram for optical oxygen sensor LED modulator ... 101
Figure B.2: Square wave and rectified wave ... 102
Figure B.3: Transimpedance amplifier and associated circuits ... 103
Figure C. 1: Simplified Labview module for digital lock-in detection... 112
Figure C.2: Labview VI front end for optical oxygen sensor ... 113
Chapter 1
Introduction
Despite major improvements across the spectrum of health care in the past 20 years, there have been few major advances in the care of patients with end-stage lung disease. While the death rate for certain cancers and cardiovascular disease has been substantially reduced, the death rate due to chronic lung disease has actually increased by over 50%. The increase in the death rate from chronic lung disease is largely on account of a relative lack of emerging therapies and inadequate technology for providing intermediate and long-term respiratory support. An estimated 250,000 deaths per year are attributed to lung disease, 150,000 of those related to acute, potentially reversible respiratory failure, and 100,000 related to chronic, irreversible respiratory failure. The total economic burden for all lung disease is in the range of 72 billion dollars annually. A particularly traumatic statistic is the mortality rate from lung disease in infants; lung disease accounts for 48% of all deaths for patients under one year of age (data from the Center for Disease Control, Atlanta). In addition to mortality, COPD poses significant quality of life impairments for its patients, in terms of challenges to employment and high levels of stress, depression, and anxiety.1'2
The pressing medical case for the development of improved technological and therapeutic options for treatment of chronic lung disease has generated considerable interest in the area in recent decades. Recent advances in lung therapy have included an improvement of techniques for performing lung transplantation.3' 4 Limitations in the number and availability of suitable donor organs, however, have made lung transplantation an unattainable option for the majority of patients. Rationing of donor lungs is particularly strict due to the large discrepancy between the numbers of donors and patients, the low yield of available lungs, and the absence of organ preservation methods during the pre-transplantation.5,6
13 CHAPTER 1: INTRODUCTION
1.1
Mechanical respiration for treatment of lung disease
Various techniques have emerged and evolved to serve as a mechanical bridge to actual organ transplantation. Positive-pressure mechanical ventilation, in its modem incarnation, is a technique that evolved from WWII military technology for the delivery of oxygen and gas to fighter pilots at high altitude.7
'Positive pressure' means that positive pressure is applied at the patient's airway through an endotracheal or tracheostomy tube. This gas pressure causes oxygen to flow into the lungs until the ventilator breath is terminated, upon which point the lung volume is purged by the elastic recoil of the expanded chest, accomplishing passive exhalation. The efficacy of mechanical ventilation is very reliant on the severity of the patient's underlying disease state. Limitations of mechanical oxygenation include its prolonged, intensive nature, and the high possibility of adverse effects including oxygen toxicity, barotrauma, altered metabolism, and malnutrition.8 These effects may in turn result in further injury to the
failing lungs, and add significantly to morbidity and mortality.
Extracorporeal membrane oxygenation (ECMO) refers to the technique of augmenting oxygenation in the bloodstream through an extracorporeal circuit whereby oxygen is supplied diffusively to the blood through a microporous membrane. ECMO has been sufficiently refined to be suitable for oxygenation during cardiac bypass surgery.9' 10 Despite its indisputable utility, ECMO is plagued by a number of functional limitations, including: 1) the requirement for a large and complex blood pump and oxygenator system, 2) the necessity for surgical cannulation, 3) the need for systemic anticoagulation, 4) a high rate of complications, including bleeding and infection, 5) biofouling due to protein adsorption and platelet adhesion on the surface of membranes, and 6) the high cost of implementation associated with labor intensive technical support. These limitations have confined ECMO largely to applications with a high probability of acute reversibility of disease prognosis."
Intravenous membrane oxygenation (IVOX) is an extension of the membrane diffusion technology upon which ECMO is based, in which a membrane-bound hollow fiber catheter is inserted to the patient intravenously to allow 02 and CO2 diffusion.
IVOX is limited by a number of the same shortcomings as ECMO. In addition to a relatively high number of adverse effects, IVOX suffers from inefficient gas exchange, supplying less than 50% of basal 02 requirements.9' 11 Realizing that a primary impediment to effective mass transfer is the slow rate of venous oxygen diffusion, modem IVOX devices have achieved greater mass transfer efficiencies by including fluidic mixing elements.'2 Such added complexities increase the overall mechanical bulk
of the device.
1.2 Development and applications of a photolytic oxygenator
In light of the limitations of current mechanical therapies for COPD - namely, their reliance on external pumping and gas supply apparatus and membrane-based diffusion, we have proposed the development of a self contained, miniaturized platform for artificial respiration. Such a device would be capable not simply of delivering oxygen to a patient's blood stream, but of generating oxygen directly in the blood stream from constituents of the blood plasma, thereby eliminating the reliance on external apparatus and facilitating an ambulatory therapeutic alternative for the treatment of chronic and acute lung disease. We propose for oxygen to be produced directly from the dissociation of water molecules in the blood plasma, a reaction that would be induced by a photo-catalytic, or photolytic, element fabricated integrally into the device. Fluidic transport in the device would be accomplished by means of an optimally designed hemocompatible microfluidic capillary network. Microfluidics deals with the transport of fluids at
extremely low Reynolds numbers, on length scales sufficiently small to begin to mimic biological processes. Accomplishing oxygen transport in a microfluidic network would have the direct effect of accomplishing efficient diffusive oxygenation across an extremely small length scale, eliminating the need for gas mixing or pumping. An integrated microfluidic photolytic oxygen generation module would be a scalable device that could be designed to incorporated a high packing density of microchannels, accommodating near-physiological fluid flow rates and achieving rapid oxygen saturation within a minimal dimension. The research that will be discussed in this thesis was
15 CHAPTER 1: INTRODUCTION
undertaken in pursuit of this objective, with a specific emphasis on the design of the microfluidic element for facilitating blood flow and effective oxygen transfer at the microfluidic scale. In light of the motivation to develop new mechanical alternatives for the treatment of lung disease, the following applications of the microfluidic photolytic oxygenation platform are proposed:
1.2.1 Organ Preservation
The donor supply of transplantable lungs could be increased by maintaining the viability of lungs harvested immediately postmortem. Ischemic shock to lung tissue reduces lung viability to less than 50% within 4 hours of circulatory arrest. It has been experimentally demonstrated that perfusion of an oxygenated blood supply after the donor's death can maintain organ viability at significantly higher levels compared to un-oxygenated organs.13 With this in mind, we envision a short term objective for the photolytic module to be the development of a mobile oxygenation/perfusion device easily suitable for organ transport and storage over the course of 12-24 hrs. Increasing the supply of available organs by maintaining more organs at a viable level would be a significant step towards alleviating demand on transplantation wait-lists and improving the degree of healthcare for lung disease patients.
1.2.2 Implantable Artificial Lung
An extension of the organ preservation device would be a small, self contained, implantable device capable of supporting and/or supplanting an ailing lung in the oxygenation of the body's pulmonary circulation. As opposed to the envisioned organ preservation device, an implantable unit would require considerably higher standards for operational lifetime, robustness, biocompatibility, packaging size, and power/electrical/optical control. As the majority of these objectives are far beyond the scope of this research, the investigation into the details regarding the artificial lung was
17
contained to a conceptualization of the theoretical structure of an integrated microfluidic/photolytic/optical/electronic device.
1.2.3 Additional micro-biological applications
Thinking beyond the application to the treatment of chronic lung disease, it is conceivable that an integrated microdevice capable of generating a controlled quantity of oxygen might find many other applications in micro-electro-mechanical (MEMS) related systems. As this thesis evolved, an increasingly important part of the research was the design and fabrication of an integrated oxygen sensor to detect gas levels within the microfluidic device. The delivery of a controlled oxygen supply and the accurate sensing of dissolved oxygen levels within a miniaturized environment is a necessity, for instance, in biological assay, bio-reactor, and tissue engineering applications. In cellular assays and bio-reactors, rapid determination of cell viability is frequently accomplished by monitoring of cellular metabolic activity via oxygen sensing. 14, 15 A controllable source of oxygen is a key constraint on cellular growth and development in tissue engineering applications. Newly implanted cells will consume the available oxygen supply within several hours, while it takes several days for angiogenesis to begin the creation of blood vessels to provide growing tissue with oxygen and nutrients.16 As integrated microfluidic devices for such biological assay, reactor, and tissue engineering applications become increasingly ubiquitous, there is a compelling need for the development of flexible, low-cost oxygen sensors that can be rapidly prototyped and fabricated. This provides a third, independent, yet compelling motivation for the research into the development of an integrated microfluidic oxygen exchanger.
Chapter 2
Fundamental Technologies
Two fundamental technologies underlie the development of an integrated micro-oxygenation module. The first is photolytic oxygen generation, the use of a thin-film fabricated transition metal structure to generate dissolved oxygen directly in the bloodstream. The second is multi-layer soft-lithography microfluidics. A microfluidic network was developed to bridge the gap between the macroscopic physiological flow rates of the body and the microscopic scales at which diffusive oxygen transfer occurs most efficiently. Details of these two technologies, as they pertain to this research, are described in the following two sections. Before beginning this section, it is necessary to emphasize that this research, and this thesis, deal almost exclusively with the microfluidic portion of the device design. A photolytic film, developed by a corporate partner, was not made available for research purposes. Therefore, this work focuses purely on the microfluidic device design as it relates to hemocompatibility, mass transfer, and oxygen sensing. It is necessary, however, to explain the fundamentals of photolytic oxygen generation to motivate the development of the microfluidic component, as the artificial respiration device may be understood best as a whole.
2.1
Photolytic Oxygen Generation: Concept
As previously described, an inherent limitation of ECMO, IVOX, or other blood-oxygenation strategies is their reliance on membrane-based diffusion to supply a quantity of oxygen to the bloodstream. Such a technology requires a refillable tank and pump, rending it essentially non-mobile. A key motivating factor for this research has been the development of a portable artificial oxygenation technology that can produce oxygen
19 CHAPTER 2: FUNDAMENTAL TECHNOLOGIES
without the reliance on external apparatus or oxygen supplies. The use of a photo-catalyic, or photolytic, film obviates the need for an external oxygen supply and pump. Photolytic oxygenation refers to the generation of dissolved oxygen directly in the bloodstream, produced by the photo-catalyzed disassociation of water molecules in the plasma. The basis for photolytic reactions, broadly defined as those chemical reactions using energy derived from light, are ubiquitous mechanisms in nature for driving metabolism. One of the best-known photolytic reactions is photosynthesis, in which green plants and certain bacteria utilize sunlight to drive the production of dissolved oxygen (DO) from water and the exchange of oxygen for carbon dioxide, while simultaneously generating ATP. This research seeks to employ a novel family of photoactive materials which simulate the function of such naturally occurring photolytic reactions. This technology would address the challenge of artificial respiration not by delivering oxygen to the blood, but by converting the water already present in the blood into dissolved oxygen. The chemical details of the photolytic technology are described below.
The envisioned structure of the photolytic oxygenator resembles a sandwich of elements, including a robust semi-conducting transition metal oxide TiO2 layer, Mn electrode films, fluidic channel, and some sort of UV light supply.
Electron Flow e---'Io
E--Anode e- e- e~ ++++
C0
Cathode Direction ofFigure 2.1: "Sandwich" structure of elements in photolytic oxygenator design.
CHAPTER 2: FUNDAMENTAL TECHNOLOGIES 21
The TiO2 layer would be deposited upon a substrate of Mn with a chemical vapor deposition (CVD) process. The schematic of this structure is shown in fig. 2.1.
The photolytic structure operates by absorbing UV light, which promotes charge separation in the nano-crystals of the TiO2 film, analogous to the generation of
electron-hole pairs in electrical semiconductor materials. Free, electrons liberated into the conducting band, are pulled from the TiO2 surface by application of an electrical potential, E. The potential E prevents "back reaction", the recombination of freed electrons with ionized elements in the TiO2 film. The resulting ionized surface of the metal oxide layer is positively charged. This surface, which is in direct contact with the bloodstream, interacts with water molecules in the blood plasma and stimulates the dissociation of H20 in a cascade of reactions, resulting in the production of, among other intermediary chemical species, dissolved oxygen (DO). This cascade of reactions occurs in four steps, which are described in detail.
PHOTOLYSIS
2H20 + hv TiO2(anatase) > H202 (Active oxygen, AO) + 2H+ + 2e- (2.1)
DISPROPORTIONATION
H202 (AO) MnO2 , Dissolved oxygen (DO) + H20 (2.2)
PROTONATION
H+ + HCO3- * H2CO3 (carbonic acid) (2.3)
DEHYDRATION
H2CO3 CarbonicAnhydrase > H20 + C02 (
CHAPTER 2: FUNDAMENTAL TECHNOLOGIES 21
In the photolysis reaction (2.1), water is dissociated by incident photonic energy to produce active oxygen (AO), H+ ions, and free electrons. In the disproportionation reaction (2.2), AO spontaneously forms dissolved oxygen (DO), 02. H+ ions react with bicarbonate in the blood plasma to form carbonic acid (2.3), and carbonic acid is converted through dehydration (2.4) into water and CO2. The principle products of the photolytic reaction, therefore, are DO and CO2. DO diffuses from the TiO2 surface into the bloodstream, where it is bound to hemoglobin in red blood cells (RBC's). An important challenge to the successful operation of the photolytic module is the chemical fixation or removal of C0 2, as CO2 binds competitively to hemoglobin and will impede the oxygenation of RBC's. This will be discussed further in the considerations regarding the design of the microfluidic unit.
2.2 Photolytic Oxygen Generation: Validation
A photolytic film fabricated at Battelle Memorial Institute was tested in a preliminary proof-of-concept experiment by collaborators Bruce Monzyk (Battelle) and coworkers. UV light filtered to a wavelength of 365nm with an intensity of 88.1mW/cm2 was delivered to a photolytic surface submerged in buffered water. To test the efficacy of oxygen generation, the electrical bias potential E = +1V, as well as the UV light, was cycled on and off, while the water's gas concentration was monitored in real-time by an electrode gas sensor. The results are shown in fig. 2.2.
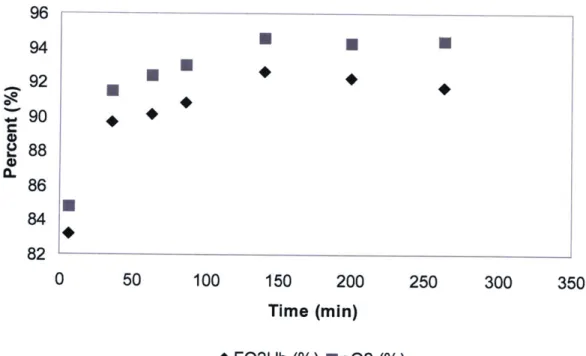
Production of dissolved oxygen was evaluated in whole blood by perfusing a photolytic test cell with whole blood at a flow rate of 80 cc/min for 250 min. Samples from the collection reservoir downstream of the photolytic test cell were intermittently measured by blood gas analysis to determine 02 concentration. Figure 2.3 shows this result, revealing that photolytic oxygenation effectively delivered a flux of DO to whole blood which approached saturation following a sufficient length of time.
CHAPTER 2: FUNDAMENTAL TECHNOLOGIES
20 40 60 80 100 120
Time (nin)
Figure 2.2: Dissolved 02 concentration in aqueous photolytic test cell. Photolytic generation of
DO occurs only when UV irradiation and bias potential E are applied simultaneously.
96 94 92 0 2 88 86 84 82 0 50 100 150 200 250 300 350 Time (min) *FO2Hb (%) sO2 (%)
Figure 2.3: Percent oxygen concentration in whole blood versus time for photolytic test cell. FO2Hb represents the fraction of oxyhemoglobin, while sO2 represents the 02 concentration
relative to saturation in the blood plasma.
90 80 70 - 50- ~40- j30- ~20- 1
0-I.
tt
0 U U U 17 El 23 I El 02.3 Multilayer soft lithography microfluidics
2.3.1 Microfluidics: Optimizing diffusion-limited mass transport
Blood flow is brought into contact with the TiO2 photolytic film through a network of microfluidic channels. The use of microfluidics is intended to overcome inherently slow diffusion rates by accomplishing diffusive mass transfer on an extremely small length scale. Figure 2.3 reveals a significant limitation of the photolytic module as it has been previously implemented. The time constant to achieve nearly saturated blood-gas concentrations is approximately 150 min, a prohibitively long time for a device that is intended to be a fast and mobile oxygenator for emergency applications. The limiting factor in the speed of fluid oxygenation is not the magnitude of oxygen generation at the metal oxide surface, but rather the speed of diffusion of oxygen molecules through the bulk fluid. Whole blood is approximately 50% plasma by volume, the remaining volume being made up of RBC's, white blood cells, platelets, and other solid volumes. Plasma is
95% water by volume, which means that the diffusivity of 02 in blood is approximately equal to the diffusivity of 02 in water.
D
02(blood)~ D
0(H
20)
=
2.4E - 9
(m^2/s)
The diffusion time for a molecule of oxygen to travel a particular distance L scales as
follows:
t ~ (2.5)
2D0
The approximate diffusion times for various length scales are shown in table 2.1. Diffusion becomes exponentially slower at large length scales, making it an extremely inefficient mechanism at macroscopic dimensions, such as those used in the photolytic flow cell experiment shown in fig. 2.3.
CHAPTER 2: FUNDAMENTAL TECHNOLOGIES 25
Length: 1 ptm 10 [tm 1 mm
Time 0.2 ms 0.02 s 200 s
Table 2.1: Approximate diffusion times for oxygen in water
To overcome the limitation of slow diffusive rates, efficient mass transfer may be accomplished either by actively mixing the fluid to increase the rate of 02 uptake, or by reducing the length scale at which diffusion occurs. Mixing is undesirable, since it risks damaging RBC's in the blood and adds additionally complexity and apparatus to the oxygenator. Instead, the photolytic oxygenator is designed to operate in a microfluidic environment, intending to take advantage of the extremely small length scales possible in microscale flow and the corresponding rapid diffusion rates. This intuitively mimics the function of the lung, a biological oxygenation device. In the lung, the pulmonary arterial system transports RBC's in micron-sized capillaries into intimate contact with the alveoli, small air-filled sacks at the terminus of the lung's airways. Transport of 02 and CO2 in
and out of the bloodstream, respectively, occurs rapidly across a thin membrane.
2.3.2 Multilayer soft lithography microfluidic fabrication
The particulars of the design and evolution of the microfluidic capillary network are discussed in detail in the following sections. Microfluidic devices are fabricated from polydimethylsiloxane (PDMS) using the technique of multi-layer soft lithography. Multi-layer soft lithography is a well documented technique for making rapidly prototyped devices suitable for biological and other applications. 17-19 In the simplest sense, soft lithography refers to the casting of polymeric stamps off of molds created using standard microfabrication techniques. A schematic of the soft lithography process is shown in fig. 2.4.
1) 2) 3) 4) 5) H M M 6)
Figure 2.4: Polymeric stamping of a microfluidic device through soft lithography Refering to fig. 2.4, steps 1-3 detail the photolithographic creation of a mold, while steps 4-6 detail the soft lithography casting of a PDMS device. In step 1), photoresist is spun coated on a silicon substrate to a desired thickness and baked, as appropriate for the particular photoresist. In step 2), the photoresist layer is illuminated with filtered UV light through a lithographic mask (chrome or transparency) to selectively cross-link the photoresist in the pattern of the mold. Simple transparency molds were used exclusively for this research, allowing feature resolution down to approximately 10-20 ptm. Following UV exposure, the photoresist is post-baked then developed with an appropriate solvent, leaving a 2-D image of patterned channels on the surface of the Si wafer. Figure 2.5 shows a patterned photoresist mold on Si wafer.
CHAPTER 2: FUNDAMENTAL TECHNOLOGIES 27
Figure 2.5: Photoresist mold, courtesy of JP Urbanski, Thorsen group, MIT
From fig. 2.4, step 4) illustrates the pouring of fluid (uncured) PDMS over the mold, which is then baked to crosslink the PDMS. Prior to pouring PDMS, the mold is treated with a silanization step to generate a Teflon-like layer of high molecular weight hydrophilic molecules over the mold surface. Silanization decreases adhesion of the
PDMS to the photoresist mold and Si wafer, facilitating easier lift-off.2 0 Solidified
PDMS is peeled from the mold (step 5), then sealed to a substrate by plasma bonding (step 6).
Multi-layer soft lithography refers to the vertical stacking of multiple layers of fluid channels separated by thin layers of PDMS. Thin layers are created by spin-coating PDMS onto a wafer and baking, then pressing a thicker layer of PDMS on top of the thin coat. PDMS is a two-part polymer, consisting of a separate monomer and hardener which are custom mixed to the desired consistency before being baked and crosslinked into a flexible rubber. A typical monomer to hardener ratio, for a single-layer microfluidic device, is 10:1. For a multi-layer device, alternating PDMS layers are mixed at different monomer/hardener ratios. Typical ratios used in a two layer device are 20:1 and 5:1 for the lower and upper layers, respectively. The imbalance of hardener at the interface between the two layers facilitates crosslinking between layers during subsequent baking, forming a strong covalent bond. The two layers are adhered by baking, which
27 CHAPTER 2: FUNDAMENTAL TECHNOLOGIES
makes the thin layer sufficiently stiff to allow peel-off. A three layer device is illustrated in fig. 2.6.
5:1
20:1 5:1
Figure 2.6: Multi-layer soft lithography
Multi-layer soft lithography permits extremely high packing density of fluidic channels, since individual PDMS layers may be on the order of 100 pm or less. A 1cm thick chip could conceivably contain 100 layers of fluid channels.
Chapter 3
Conceptualization of multi-layer
microfluidic device
A large number of considerations underlie the design of the microfluidic network, making its structure an optimization problem. The following can be defined as primary objectives for the microfluidic network design:
3.1
Microfluidic device design: Primary objectives
1) Achieve hemocompatibility with blood flow
2) Translate between macroscopic and microfluidic flow regimes 3) Facilitate rapid, efficient oxygenation of blood
3.1.1 Hemocompatibility
Perfusion of blood through an artificial environment poses numerous challenges. The surface of PDMS is extremely hydrophobic, rendering it highly susceptible to protein adsorption, platelet aggregation, and thrombogenesis (clotting). Clotting can occlude a channel and cause pressure rises, device damage, and potentially result in downstream embolism if clots are freed from the PDMS walls and carried from the device into a patient's circulation. Thrombogenesis may result from interactions with proteins, such as fibrinogen, adsorbed to channel walls, or from adverse flow conditions such as recirculation and stagnation. In the case of stagnation or recirculation, the fluid velocity is sufficiently low that the blood thickens and clots are formed. Figure 3.1 demonstrates vorticity in the flow of a non-newtonian fluid in the entrance region of a sudden area
contraction.2 Similar areas of vorticity in a shear-thinning non-newtonian fluid like blood are regions where clot formation might be expected.
Figure 3.1: Vorticity observed in contraction flow of a non-newtonian viscoelastic fluid
Hemocompatibility refers additionally to the challenge of minimizing the shear stress in the fluidic network. Excessive shear stress can damage the RBC cellular membrane, hemolyzing the cell. The magnitude of shear stress arises from the magnitude of flow rate and channel cross sectional dimensions, as well as from the geometry of the fluid path.
3.1.2 Macrofluidic and microfluidic flow regimes
Typical microfluidic flow rates are on the order of nano-liters to micro-liters per minute, or in the very highest of flow rates, milli-liters per minute. In contrast, physiological flow rates are considerably more macroscopic; blood circulates through the body at an approximate flow rate of 5-10 L/min.22 In order to achieve a near-physiological flow
rate, a microfluidic device must straddle the limit between macro and microfluidics by incorporating an extremely high packing density of channels with an individual channel geometry capable of accommodating very high micro-flow rates. As previously
CHAPTER 3: MICROFLUIDIC DEVICE CONCEPTUALIZATION
described, an upper limit on the flow rate of an individual channel is set by the RBC's susceptibility to hemolysis. There is, therefore, a tradeoff between hemocompatibility and desirable high flow rates.
3.1.3 Blood oxygenation
The microfluidic network must achieve rapid oxygen saturation in the bloodstream. As miniaturization of the overall oxygenation device is an objective, the microfluidic oxygenator should be designed so that it efficiently oxygenates the blood - that is to say, oxygenation should be accomplished in the shortest length possible. In addition to reducing the size of the device, a smaller device reduces the amount of fluidic resistance, decreasing the pressure needed to drive the blood through the microchannels, and thereby reducing the shear stress on blood cells.
The quantity of oxygen delivered to the bloodstream is a function of the fluid flow rate, the channel length, and height. Following sections will contain a detailed analysis of the optimization of the device's mass transfer characteristics.
3.2
Device construct and passive oxygenation
The 2-dimensional nature of soft lithography microfluidics lends itself well to the design of a stacked photolytic structure. Figure 3.2 demonstrates a visualization of the conceived structure for the integrated microfluidic/photolytic oxygenation module. PDMS fluidic elements are sandwiched between photolytic and accompanying electrical elements into a structure with a total height on the order of several millimeters. This structure could be stacked in repeating layers with integrated lightguides for UV illumination to achieve a very high density of fluidic channels in a compact module. In the device shown in fig. 3.2, the microfluidic element contains two parallel sets of channels, one for fluid flow (in contact with the photolytic surface), and one labeled for
'gas flow'.
T10
2Bias-Potential Electrodes
Fluid Flow
Gas Flow
PDMS Mi rofluidic Channels
Figure 3.2: Conceived structure for integrated microfluidic photolytic oxygenation module. Multi-layer PDMS microfluidic channels are sandwiched between photolytic elements. The total
thickness of the structure is on the order of several millimeters, meaning that multiple elements could be stacked back to back, achieving extremely high channel densities.
The gas flow channels shown in fig. 3.2 serve an important purpose in the design of the microfluidic module. First, they are intended to help purge CO2 generated by the
photolytic reaction from the bloodstream. In the normal function of the lungs, CO2 is
extracted from its binding to hemoglobin by the relatively low presence of CO2 in the
alveolar airways - the concentration gradient drives a flux out CO2 out of the arteries, while an oppositely directed gradient drives diffusion of 02 into the bloodstream. In a carbon dioxide-rich environment, CO2 impedes the binding of 02 to hemoglobin by
directly binding to hemoglobin to form carbamates, and by forming bicarbonate that lowers the blood's pH and decreases hemoglobin's affinity for 02.23 In effect, the presence of large concentrations of CO2 in the blood shifts the sigmoidal oxygen binding
curve, shown in fig. 3.3, to the right. In addition to being produced as a byproduct of the photolytic reaction, CO2 is present in blood entering the photolytic module, since this
CHAPTER 3: MICROFLUIDIC DEVICE CONCEPTUALIZATION
blood is flowing from the venous return where it is transporting CO2 from the tissue capillaries. 100 95.8 0 OR C .250 46-0 I 0 0 26.8 40 80 120
Oxygen partial pressure (pO, mmHg)
Figure 3.3: Sigmoidal oxygen affinity curve for blood
The gas flow channels in fig. 3.2 would serve the same purpose as the lung's alveoli, to promote 02 binding by diffusively removing CO2 generated by the photolyic reaction
from the blood. One limitation on the strategy of removing excess CO2 by diffusion
through a membrane is the need to purge the gas channel lines to maintain a CO2
gradient, potentially requiring an external pump. A primary intention of the photolytic module is to eliminate the reliance on external apparatus, meaning that CO2 gas diffusion
may not be an effective solution to the problem of removing CO2 from the oxygenator.
Prior to serving as a solution for CO2 removal, the gas channels fabricated in the
multi-layer microfluidic structure serve a more important experimental purpose. Throughout the course of this research work, a functional photolytic metal oxide surface was not made available by research partners for testing or incorporation into an integrated oxygenation device. An original goal of this research was to replicate the experimental work on photolytic oxygenation shown in figs. 2.2 and 2.3 in a microfluidic environment. 33 33
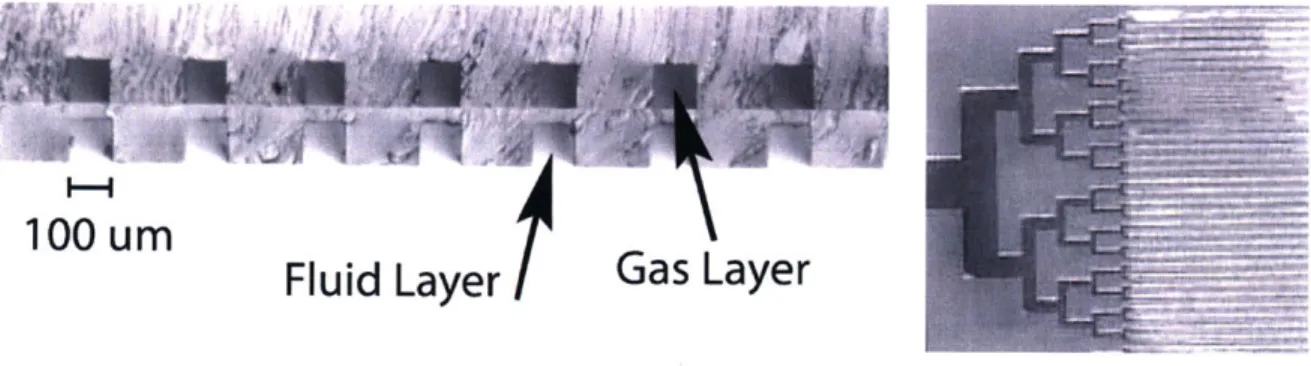
The lack of a photolytic surface for testing purposes necessitated the development of other methods for the characterization and optimization of the mass-transfer properties in the microfluidic oxygenator. In order to simulate the behavior of an oxygen-generating photolytic surface, the microfluidic devices were fabricated as multiple layer devices with gas channels through which oxygen could be flowed. The high concentration of oxygen in the gas channels creates a large gradient across the thin PDMS membrane, driving diffusion of 02 into the fluid channels. We refer to this technique as "passive oxygenation", as opposed to "active oxygenation" from a photolytic film. Passive oxygenation allowed testing of the mass transfer properties of the microfluidic network without the need for a TiO2 surface. The ability to test the diffusion characteristics of the microfluidic device without the complexity of an oxide film, optical components (UV lamp and filters) and electrical components greatly simplified experimentation, while very accurately replicating the effect of an oxygen-generating surface. Figure 3.4 shows a microscope cross section of a device, illustrating the two vertically aligned channel layers separated by a thin (~20 pm) PDMS membrane. The lower set of channels, which would typically be sealed to the TiO2 film, is bonded to a glass slide.
100 urn
Fluid Layer
Figure 3.4: At left, cross section offluid and gas channels in two-layer microfluidic device. Right, overhead view of capillary section and densely packed oxygenator channels.
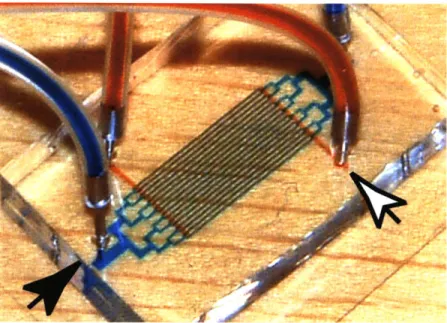
Passive oxygenation proved to be an effective experimental technique, as the design of the capillary network geometry was entirely decoupled from the complexity of the photolytic element. The two-layer structure of a microfluidic chip for passive oxygenation is shown in fig. 3.5, with fluid dye illustrating the path of fluid flow (black arrowhead) and gas flow (white arrowhead).
CHAPTER 3: MICROFLUIDIC DEVICE CONCEPTUALIZATION 35
Figure 3.5: Two-layer microfluidic device for passive oxygenation with dyed fluid representing the path of thefluidic channels (black arrowhead) and gas channels (white arrowhead).
35
Chapter 4
Network Design: Evolutions
4.1
Scaling laws and capillary geometry
In an artificial microfluidic system, practical limitations related to the biocompatibility of blood flow in a synthetic environment limit the minimum length scale which may be used in designing microcapillaries. Blood flow in microchannels is limited predominantly by shear stress and intraluminal clotting. It was demonstrated experimentally by Brown et. al. that sustained shear stresses of 10-25 Pa result in "striking changes in morphology, biochemistry, and functional properties" of RBC's, while shear stresses from 150-450 Pa produce outright hemolysis (cell rupture).' The diameter of a human red blood cell is approximately 7 tm, while the diameter of capillaries in the pulmonary arterial system is approximately 3 pm.26 In a biological environment, the RBC deforms significantly into a
plug shape to pass in single-file through narrow capillaries. The ability of RBC's to deform is aided by the endothelial lining and the natural compliance of the capillary wall. Experimental and analytical work on blood flow in glass microchannels suggests that, in an artificial environment, 100 im is an approximate lower limit on the channel dimension to allow whole blood flow without considerable clotting and hemolysis (rupture) of RBC's.2 7 It has been demonstrated that red blood cells can be flown through
square PDMS channels with cross-sectional dimensions as small as 2x2 tm.28 However, this experimental work was performed with solutions of RBC's only (no platelets or adhesion proteins, ie fibrinogen, etc.), at extremely low flow rates (-10-20 pL/min). We expect that the pressure drop associated with the passage of a near-physiological volume of blood at higher flow rates through such a small cross sectional area would generate unacceptably large levels of shear stress and cell hemolysis.
The choice of 100 tm for the minimum dimension of the blood microchannels sets the channel height of the microfluidic device, which is constant across the entire
37 CHAPTER 4: NETWORK DESIGN: EVOLUTIONS
device. The design challenge for the microfluidic capillary network remains to construct the two dimensional network of diverging and converging channel bifurcations. Analytical and physiological precedents exist to inform the design of a fluidic capillary network. Murray's law293
(eqn. 4.1) states that the work required to drive fluid through a channel bifurcation is minimized when the diameter of the parent channel (Dp) and the diameters of the daughter channels (D1, D2. , D,) satisfy the following relationship.
D,
3DI
+ D(4.1)
D
P
Di
D
2Figure 4.1: Bifurcation geometry and notation for Murray's Law, eqn. 4.1
Murray's law, which is applicable for symmetric and asymmetric branches, may be derived by several distinct analytical approaches, including minimization of the shear stress at a single bifurcation, and minimization of the total pumping work required to drive fluid through a capillary tree.3 1
Morphological data across multiple animal species, including humans, suggests a consistent pattern of branching ratios and vessel lengths unique to the pulmonary arterial system. -3 Previous work has shown a characteristic linearity of arterial diameter on a logarithmic scale across 15 orders of branching (equivalent to "levels" in a symmetrically bifurcating tree).1' 3 On the basis of this morphological data, the scaling laws that
govern the relative diameters of channels in a biological capillary system show excellent agreement with the scaling law set forth by Murray's law.31 Murray's law was chosen as
CHAPTER 4: NETWORK DESIGN: EVOLUTIONS
a starting point for the design of the microfluidic capillary network based on its well-demonstrated mathematical rigorousness and excellent agreement with physiological data.
4.1.1 Scaling laws: geometric limitations
Murray's law is derived for the particular case of Poiseuille flow in cylindrical channels. Because the cylindrical geometry is not representative of the square, high aspect ratio channels encountered in microfluidic devices, several methods were attempted to translate the rectangular microfluidic channel cross sections into appropriate cylindrical analogs for Murray's law. One analogy commonly used to approximate the diameter of non-cylindrical channels is the hydraulic diameter, defined as:
D= 4*Area _ 4*w*h (4.2)
Perimeter (2h + 2w)
where h is the channel height and w is the width. One important limitation of the hydraulic diameter is its asymptotic nature; at aspect ratios (w/h) greater than approximately 5, DH approaches a limit equal to 2*h. A second approximation to Murray's law was to simply replace the 'cylindrical diameter' in eqn. 4.1 with the channel width. Ultimately, the method that was used was based on equating the fluidic resistance of a rectangular channel with that of a cylindrical channel to obtain a 'diameter' that was approximately analogous to a particular channel width, as will be described in greater detail in the following section. Since Murray's law essentially minimizes the resistance of a capillary network to fluid flow, the strategy of equating resistances was believed to be an optimal approach to minimizing shear stress in a rectangular geometry.
4.2 Microfluidic capillary design evolution
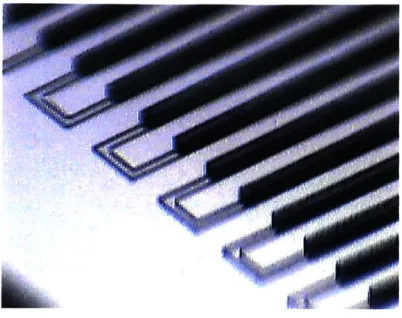
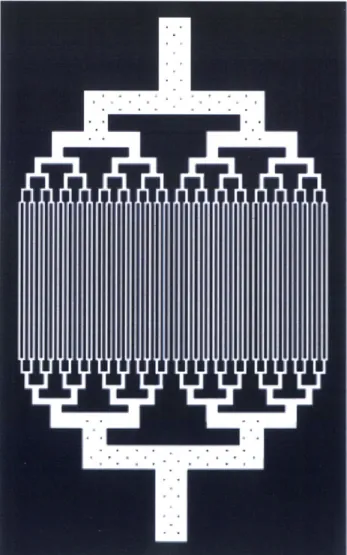
The evolution of 2D microfluidic capillary designs which were fabricated and tested for the photolytic oxygenation module is shown in fig. 4.2. The network labeled 'A' was a preliminary design used to test the upper limits on packing density (100 [tm height, 200 pm wide, and 50 pm separation) which revealed stiction problems between the PDMS and mold surface associated with the high density of channels. Network 'B', which consists of 100 pm wide channels with 150 pm separation, represents what was determined to be an optimal packing density, from a fabrication standpoint. The asymmetric nature of the fluid inlet and outlet was non-optimal, however, from a fluid dynamics perspective. Trapped air bubbles were a persistent problem in this design. Designs 'C-D' represent the introduction of symmetry in the capillary design, which significantly reduced the formation of air bubbles in the microchannels. Network 'E' is the culmination of refinements in packing density, symmetry, and optimal branching ratios (based on Murray's law, eqn. 4.1). At it's lowest branching level, device 'E' consists of 16 parallel channels. Design 'E' displays an increased length in the narrow "gas exchange" central portion of the chip. The increased gas exchange length accomplished a five-fold increase in oxygen delivery capacity over the same total capillary length as device 'D'. Device 'F' consists of an extension of Device 'E' to 4 times the number of capillaries (64 in the gas exchange portion), whereas 'G' is a refined version of device 'F' with optimal branching ratios at the largest-width channels.
Device 'G' is noteworthy because of the novel support structure used to support the very high aspect ratio ( > 20:1) channels at the inlet and outlet. This support structure, visible at higher magnification in Figure 10, consists of a grid of PDMS micro-pillar supports which prevent the ceiling of the channels from collapsing and occluding the channel. This design offers greater flexibility in implementing high flow-rate chips with very high aspect ratio channels.
CHAF~ER 4: NETWORK DESIGN: EVOLUTIONS 41
Figure 4.2: Evolution of arborizing microchannel designs.
Figure 4.3: Photolithography template (mask) of microfluidic construct depicted in fig. 4.2G
The device shown in fig. 4.2G was the lithography design used in the bulk of experiments described throughout the remainder of this thesis. An important point should be made concerning the choice of bifurcation angle, shown in detail in fig. 4.3. Realizing that shear stress, fluid stagnation and recirculation, and other non-desirable fluid dynamical properties would be substantial due to the 90 degree bend angles chosen for the device design, it was nevertheless decided to fabricated this design as an experimental starting point, from which nearly all other bifurcation geometries would represent an improvement. Because the availability for blood to be used in experimentation was delayed nearly until the end of this research, the bulk of the experiments that follow were conducted with water, which never necessitated improvements to the channel branching angle, with regard to hemocompatibility. Various later iterations on the capillary network design will be discussed in the final chapters of the thesis, in the section concerning blood testing and microfluidic hemocompatibility.
In the following sections, we demonstrate the simulated flow behavior through the device that was ultimately chosen as a primary design, fig. 4.2G/4.3.
4.3 Calculated flow properties in microfluidic construct
The microfluidic network shown in fig. 4.3 is a symmetrically branching tree with seven levels of binary bifurcations. A 'symmetric' network implies that, at a given bifurcation, the two daughter vessels have an equal width. In such a capillary tree, the "rank" of a bifurcation is defined to be the number of bifurcations separating the channel from the lowest level of the tree, plus one. Rank 7, for instance, represents the largest channel, the fluid inlet, whereas rank 1 implies the smallest channel, in the gas-exchange portion of the device. Starting with the defined width of channels at rank 7, Murray's law is solved for channels of decreasing rank, yielding a set of hydraulic diameters. Using a resistance approximation for Poiseuille flow in rectangular ducts, a 2-dimensional width was extrapolated from the capillary hydraulic diameter solutions. The resistance approximation is as follows: An inlet channel diameter is created with a specified
diameter, and six levels of decreasing channel diameter are determined according to Murray's law, eqn. 4.1. With the exception of the smallest channels, whose length is determined from mass transfer analysis described in following sections, the lengths of branch ranks 2-7 are determined from a normalized regression fit to morphological data from Huang.32 The rectangular channel width is calculated by equating the Poiseuille
fluidic resistance for a cylindrical channel with diameter D, from Murray's law, and the fluidic resistance for a rectangular channel with width w and height h = 100 pm.
Poiseuille fluidic resistance:
Cylindrical:
R
=8jL
(4.3.A)K
D
4 34pL(h
+ W)2h
h'
2 Rectangular:34R
8= w)
96-95-+56
(4.3.B)
8(hw)
2W
(w)
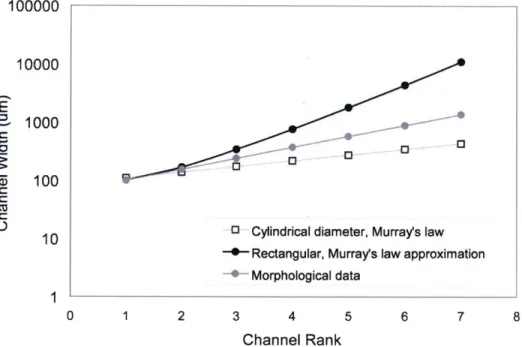
The variables L and p are the channel length and fluid viscosity, respectively. Blood is a non-Newtonian shear-thinning fluid,35' 36 which, for the purposes of this analysis, is approximated with the viscosity of water. Equating eqns. 4.3A and 4.3B and solving for the width, w, yields the set of optimal channel widths for channel 'levels' 1-6. The resulting widths, used to construct the network of fig. 4.3, are plotted in fig. 4.4, along with the diameter 'D' which was determined from Murray's law and used to calculate the cylindrical resistance of eqn. 4.3.A. Figure 4.4 shows the channel diameter for a network extrapolated by regression analysis from morphological data on and adult male lung, per Huang et al,3 as well as the channel diameter for a capillary network determined from Murray's law and the rectangular channel width determined via eqn. 4.3 in analogy to Murray's law.
43 CHAPTER 4: NETWORK DESIGN: EVOLUTIONS
100000 10000 E 1000 z 100 C
10 0 Cylindrical diameter, Murray's law 0 Rectangular, Murray's law approximation -- Morphological data
0 1 2 3 4 5 6 7 8
Channel Rank
Figure 4.4: Channel dimension (width or diameter) versus channel rankfor morphological data, capillary network based on Murray's law, and capillary network based on rectangular
approximation to Murray's law.
At higher channel ranks, rectangular widths diverged at an exponential rate because of the large fluidic resistance of the rectangular channel shape. At the highest channel ranks, 6 and 7, the large channel width (~1cm) predicted by the Murray's law approximation had to be constrained to a maximum value of 2 mm due to fabrication constraints.
The net cross sectional area at each branching rank is shown in fig. 4.5A. Net area is represented as a ratio of the total cross sectional area at branch 'i' to the cross sectional area at the inlet (rank 7). The datasets shown in figs. 4.5A and 4.5B are identical to those shown in fig. 4.4. The significantly larger aspect ratios of the morphological data correspond to the dramatic exponential increase in the number of channels at lower channel ranks for physiological capillary networks. For instance, rank 1 in our fabricated model corresponds to 64 channels of 100gm width; from properly scaled morphological data, rank 1 corresponds to an identical diameter of 100 pim, with approximately 1500 channels. In the microfluidic device, a similar increase in the net area ratio at diminishing channel ranks is precluded by the 2-D nature of the microfluidic network.
CHAPER : DEIGN EVLUTONS45NTWOK
2 4
Channel rank
6
* Morphological data
-+- rectangular, Murray's law approximation o Cylindrical diameter, Murray's law
0 1 2 3 4 5 6 7 Channel Rank 8
a)
8b)
Figure 4.5: Calculated channel characteristics as afunction of branching rank.. a) Net area ratio for extrapolated morphological data and the fabricated microchannel network offig. 4.3. b) The (absolute) axial pressure gradient increases smoothly and continuously with decreasing
channel rank.
Figure 4.5B shows the calculated pressure gradient at each consecutive channel branch of the three capillary networks under consideration. The pressure drop in a
9.00 8.00 7.00 6.00 5.00 4.00 3.00 2.00 1.00 0.00 4-(D Morphological data
--- rectangular, Murray's law approximation
O Cylindrical diameter, Murray's law
0 0 0 0 -, p-0 CD a-0 -20000 -40000 -60000 -80000 -100000 -120000 -140000 -160000 - - - -- ----