HAL Id: hal-00299032
https://hal.archives-ouvertes.fr/hal-00299032
Submitted on 1 Jan 2003
HAL is a multi-disciplinary open access
archive for the deposit and dissemination of
sci-entific research documents, whether they are
pub-lished or not. The documents may come from
teaching and research institutions in France or
abroad, or from public or private research centers.
L’archive ouverte pluridisciplinaire HAL, est
destinée au dépôt et à la diffusion de documents
scientifiques de niveau recherche, publiés ou non,
émanant des établissements d’enseignement et de
recherche français ou étrangers, des laboratoires
publics ou privés.
GPS detection of ionospheric perturbation before the 13
February 2001, El Salvador earthquake
V. V. Plotkin
To cite this version:
V. V. Plotkin. GPS detection of ionospheric perturbation before the 13 February 2001, El Salvador
earthquake. Natural Hazards and Earth System Science, Copernicus Publications on behalf of the
European Geosciences Union, 2003, 3 (3/4), pp.249-253. �hal-00299032�
c
European Geosciences Union 2003
and Earth
System Sciences
GPS detection of ionospheric perturbation before the 13 February
2001, El Salvador earthquake
V. V. Plotkin
Institute of Geophysics, Koptyug Str. 3, 630090 Novosibirsk, Russia
Received: 13 May 2002 – Revised: 30 July 2002 – Accepted: 19 August 2002
Abstract. A large earthquake of M6.6 occurred on 13
Febru-ary 2001 at 14:22:05 UT in El Salvador. We detected iono-spheric perturbation before this earthquake using GPS data received from CORS network. Systematic decreases of iono-spheric total electron content during two days before the earthquake onset were observed at set of stations near the earthquake location and probably in region of about 1000 km from epicenter. This result is consistent with that of inves-tigators, which studied these phenomena with several obser-vational techniques. However it is possible, that such TEC changes are simultaneously accompanied by changes due to solar wind parameters and Kp-index.
1 Introduction
Total electron content (TEC) in ionosphere has been widely studied using the Global Positioning System (GPS) to under-stand mechanisms of ionospheric perturbations. Global (e.g. Ho et al., 1996; Lu et al., 1998) and various local (e.g. Calais and Minster, 1995, 1996; Afraimovich et al., 1998; Calais et al., 1998) TEC perturbations in the ionosphere have been investigated in recent years.
Ionospheric disturbances before great earthquakes have been studied with several observational techniques (e.g. On-doh, 1998; Pulinets, 1998; Zaslavski et al., 1998; Liu et al., 2000). However, measurements from single stations or single orbiting satellites carrying ionospheric sensors cannot mon-itor the response of the ionosphere to every large event be-cause of the lack of instantaneous global coverage. Under-standing the coupling processes between the lithosphere and the ionosphere requires a continuously operating global mon-itoring system, such as GPS network. We demonstrate in this paper the capabilities of the GPS receivers to detect the iono-spheric TEC perturbation before the 13 February 2001, El Salvador earthquake.
Correspondence to: V. V. Plotkin ([email protected])
2 Data and method
A large earthquake of M6.6 occurred on 13 February 2001 at 14:22:05 UT in El Salvador (13.64◦N, 271.06◦E, Depth 13.0 km, see http://neic.usgs.gov. We obtained GPS data (see http://www.ngs.noaa.gov/CORS/ by FTP from the CORS network, that provides GPS carrier phase and code range measurements. In this study, we investigated TEC pertur-bation in the ionosphere using six GPS receivers from CORS network. Figure 1 shows geographic locations of these sta-tions. The four GPS stations namely ESTI, MANA, SLOR and TEGU are distributed near the earthquake epicenter. We used also the GPS receivers at the two north stations namely KYW1 and HTV1 for comparison. The sampling rate of each GPS receiver is 30 s.
A method of reconstructing TEC variations from GPS data was detailed in publications (e.g. Hofmann-Wellenhof et al., 1992; Calais and Minster, 1995). The vertically corrected TEC data were obtained from the line of sight GPS observa-tions at different elevation angles θ using a simplified obliq-uity factor namely sin θ . Data from elevation angles θ lower than 60◦are not included to reduce possible errors in the es-timation of TEC.
Phase measurements in the GPS can be made with a high degree of accuracy corresponding to the error of TEC deter-mination of at least 1013m−2when averaged on a 30-s time interval, with some uncertainly of the initial value of TEC (Afraimovich et al., 1998). Group delay measurements give an opportunity to determine the absolute value of TEC, but with an error worse than 1015m−2when also averaged on a
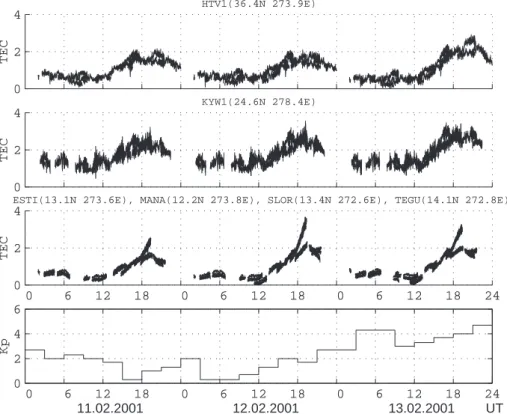
30-s time interval. In order to obtain an absolute and precise estimate of the TEC a linear combination of the phase and group delays measurements can be used (Calais et al., 1998). In this paper we are interested in the absolute value of TEC, but preliminary we used only the group delay measurements. We pre-processed these data in order to exclude small sig-nals. The estimations of TEC from all observable satellites during period from 11–13 February 2001 are shown in three top panels of Fig. 2 (the locations of GPS receivers are
indi-250 V. V. Plotkin: GPS detection of ionospheric perturbation 220 240 260 280 300 5 10 15 20 25 30 35 40 ESTI(13.10N 273.64E) MANA(12.15N 273.75E) SLOR(13.42N 272.56E) TEGU(14.09N 272.80E) El Salvador(13.64N 271.06E) El Salvador KYW1(24.58N 278.35E) HTV1(36.36N 273.91E) Longitude (degrees) Latitude (degrees)
Fig. 1. Geographic locations of earthquake epicenter (+) and
obser-vation stations.
cated in each panel). The simultaneous crossing of radio ray paths from different GPS satellites is the reason that the TEC in Fig. 2 have more than one values at the same time.
In the bottom panel of Fig. 2 is shown the three-hour Kp
index. We obtained these data from U.S. National Geophys-ical Data Center by FTP. The low or moderate geomagnetic activity during period from 11–13 February 2001 is associ-ated with the rather quiet time.
3 Results and discussion
The TEC time-series in Fig. 2 are dominated by high-amplitude variations with periods of several hours related to the daily solar cycle and to the displacements of the satel-lites. Figure 2 shows also several variations at higher fre-quencies. These variations do not allow with the necessary accuracy to compare the data during several days. There-fore in order to improve the accuracy of the TEC estimations we averaged raw TEC time-series on a time intervals when elevation angles θ are larger than 60◦. We detrended also raw TEC time-series and removed a fourth-order polynomial in order to calculate root-mean-square values (rms) for these TEC time-series.
Further we selected the TEC estimations received which had small day-to-day variability to exclude several pertur-bations concerning only given satellite-receiver pair. Thus we used the TEC data derived from six satellites PRN06, PRN17, PRN19, PRN21, PRN22 and PRN27 at set of sta-tions near the earthquake epicenter. At the KYW1 station we used the TEC data derived from nine satellites PRN01, PRN02, PRN06, PRN17, PRN19, PRN21, PRN22, PRN26 and PRN27. At last at the HTV1 station we used the TEC data derived from eleven satellites PRN01, PRN02, PRN10, PRN14, PRN17, PRN19, PRN21, PRN22, PRN23, PRN25 and PRN26. All average TEC and their rms values during period from 11–13 February 2001 are shown in three panels
of Fig. 3 (the locations of GPS receivers are indicated in each panel).
These TEC data are already more suitable to compare their values per different days. It is easy to look after the re-peatability of TEC data within three days on each panel. Further we used the differential TEC technique as in paper (Hernandez-Pajares et al., 1997). Subtraction of these TEC values ((TEC)i −(TEC)i+1) for given and next days gives the difference estimations of TEC. The received differences of the TEC are shown in Fig. 4. These TEC differences are various at set of stations near the earthquake epicenter and at the HTV1 station. However these TEC differences are slightly similar in region near the earthquake epicenter and at the KYW1 station. Systematic decreases of the ionospheric TEC during two days before the earthquake onset were ob-served at set of stations near the earthquake epicenter and probably at KYW1 station.
This result is consistent with that of earlier investigators (e.g. Ondoh, 1998; Pulinets, 1998; Zaslavski et al., 1998). A great earthquake of M7.8 occurred on 12 July 1993 in north-ern Japan. Systematic decreases of the ionospheric F2-layer critical frequency below its monthly median from 3 days be-fore this earthquake onset to 3 days after it were observed (Ondoh, 1998). Local geomagnetic activities were quiet or moderate with no geomagnetic storm from 5–16 July 1993. Therefore the ionospheric disturbances observed were inde-pendent of solar-terrestrial events.
Stable modifications of the equatorial ionosphere dur-ing few days before the 15 August 1963 earthquake of
M7.75 (13.8◦S, 69.3◦W) and similarly before the 20 March 1979 earthquake of M5.3 (7.56◦N, 126.6◦E) were also
ob-served (Depueva and Rotanova, 2000). The decreases of the ionospheric F2-layer critical frequency in region of about 1000 km from epicenter were occurred. This result is con-sistent with our estimation if to take into account distance from epicenter up to KYW1 station.
The TEC value significantly decreases 1, 3 and 4 days also before the 20 September 1999, Chi-Chi earthquake of M7.7 (Liu et al., 2001). In our case before El Salvador earthquake of M6.6 the TEC value decreases less appreciablly. It is vis-ible only due to used differential TEC technology. If we compare further changes of TEC before these earthquakes, we can see in both cases some similarity of TEC and Kp
-index changes. Figure 5 displays variations (normalized on a maximum) of the midday (12:00 LT) values of TEC and
Kp-index within some days during El Salvador and Chi-Chi
earthquakes. The TEC data from ESTI station during El Sal-vador earthquake and the TEC data from Fig. 2 (Liu et al., 2001) during Chi-Chi earthquake are used. We obtained the
Kp-index data from U.S. National Geophysical Data Center
by FTP. The equatorward motions and significant TEC de-creases of the equatorial anomaly crest during Chi-Chi earth-quake suggest that an upward electric field near the epicenter and/or the equatorward neutral wind in the ionosphere play important roles (Liu et al., 2001). At the same time changes of Kp-index can be connected to changes of solar wind
0 2 4 HTV1(36.4N 273.9E) TEC 0 2 4 KYW1(24.6N 278.4E) TEC 0 6 12 18 0 6 12 18 0 6 12 18 24 0 2 4
ESTI(13.1N 273.6E), MANA(12.2N 273.8E), SLOR(13.4N 272.6E), TEGU(14.1N 272.8E)
TEC 0 6 12 18 0 6 12 18 0 6 12 18 24 0 2 4 6 Kp 11.02.2001 12.02.2001 13.02.2001 UT
Fig. 2. Variations of TEC from all observable satellites (three top panels, in unit 1016m−2) and the three-hour Kpindex (the bottom panel)
during period from 11–13 February 2001.
0 6 12 18 0 6 12 18 0 6 12 18 24 0 1 2 3 HTV1(36.4N 273.9E) TEC 0 6 12 18 0 6 12 18 0 6 12 18 24 0 1 2 3 KYW1(24.6N 278.4E) TEC 0 6 12 18 0 6 12 18 0 6 12 18 24 0 1 2 3 TEC
ESTI(13.1N 273.6E), MANA(12.2N 273.8E), SLOR(13.4N 272.6E), TEGU(14.1N 272.8E)
11.02.2001 12.02.2001 13.02.2001 UT
Fig. 3. Selected average TEC and their rms values (in unit 1016m−2) during period from 11–13 February 2001. The earthquake onset is shown on each panel by arrows.
252 V. V. Plotkin: GPS detection of ionospheric perturbation 0 6 12 18 0 6 12 18 24 −0.7 −0.6 −0.5 −0.4 −0.3 −0.2 −0.1 0 0.1 0.2 0.3 (x) − El Salvador (o) − HTV1 dTEC UT 2 1 0 6 12 18 0 6 12 18 24 −0.7 −0.6 −0.5 −0.4 −0.3 −0.2 −0.1 0 0.1 0.2 0.3
(x) − El Salvador (o) − KYW1
dTEC
UT
2 1
Fig. 4. Comparison of TEC differences (in unit 1016m−2) at set of stations near the earthquake epicenter (x) with ones (o) at the HTV1 (top) and the KYW1 (bottom) stations. The day numbers before the earthquake onset are shown near arrows.
0 0.2 0.4 0.6 0.8 1 6 7 8 9 10 11 12 13 14 15 16 17 18 19 20 El Salvador, February 13, 2001
Day of February (UT)
0 0.2 0.4 0.6 0.8 1 15 16 17 18 19 20 Chi−Chi, September 20, 1999
Day of September (UT)
Fig. 5. Normalized on a maximum variations of the midday (12:00 LT) values of TEC (solid curves) and Kp-index (dots) within some days
wind parameters had also an effect for TEC changes in both cases. To check up this circumstance, the investigations of other events are necessary.
Other possible mechanisms of the ionospheric distur-bances associated with the imminent earthquake are again discussed. Electromagnetic effects are studied by many au-thors (e.g. Kuznetsov et al., 1995; Kim and Hegai, 1997; Sorokin et al., 2001). The formation of plasma perturbation in the upper ionosphere (Kim and Hegai, 1997) and a injec-tion of radioactive substances and charged aerosols into the atmosphere (Sorokin et al., 2001) near the epicenter of an im-minent earthquake have been studied. New detailed investi-gations of ionospheric disturbances before large earthquakes are necessary for final understanding of mechanisms these phenomena.
4 Conclusion
We detected the ionospheric TEC perturbation before the 13 February 2001, El Salvador earthquake of M6.6 using GPS data. Systematic decreases of the ionospheric TEC during two days before the earthquake onset were observed at set of stations near the earthquake location and probably in re-gion of about 1000 km from epicenter. This result is con-sistent with that of investigators, which studied these phe-nomena with several observational techniques. However it is possible, that such TEC changes are simultaneously ac-companied by changes due to solar wind parameters and Kp
-index. Therefore investigations with GPS of these phenom-ena, especially in regions with dense permanent GPS cover-age, are necessary for studying coupling processes between the lithosphere and the ionosphere and for final understand-ing of mechanisms these phenomena.
Acknowledgements. The author wish to thank U.S. National Earth-quake Information Center, U.S. National Geodetic Survey and U.S. National Geophysical Data Center for providing geophysical data.
References
Afraimovich, E. L., Palamartchouk, K. S., Perevalova, N. P., Cher-nukhov, V. V., Lukhnev, A. V., and Zalutsky, V. T.: Ionospheric effects of the solar eclipse of 9 March 1997, as deduced from GPS data, Geophys. Res. Lett., 25, 465–468, 1998.
Calais, E. and Minster, J. B.: GPS detection of ionospheric pertur-bations following the 17 January 1994, Northridge earthquake,
Geophys. Res. Lett., 22, 1045–1048, 1995.
Calais, E. and Minster, J. B.: GPS detection of ionospheric pertur-bations following a Space Shuttle ascent, Geophys. Res. Lett., 23, 1897–1900, 1996.
Calais, E., Minster, J. B., Hofton, M. A., and Hedlin, M. A. H.: Ionospheric signature of surface mine blasts from Global Posi-tioning System measurements, Geophys. J. Inter., 132, 191–202, 1998.
Depueva, A. H. and Rotanova, N. M.: Modification of the iono-sphere in the lower and equatorial latitudes before the earth-quakes (in Russian), Geomagn. Aeronom., 40, 50–54, 2000. Hernandez-Pajares, M., Juan, J. M., and Sanz, J.: High resolution
TEC monitoring method using permanent ground GPS receivers, Geophys. Res. Lett., 24, 1643–1646, 1997.
Ho, C. M., Mannucci, A. J., Lindqwister, U. J., Pi, X., and Tsu-rutani, B. T.: Global ionosphere perturbations monitored by the worldwide GPS network, Geophys. Res. Lett., 23, 3219–3222, 1996.
Hofmann-Wellenhof, B., Lichtenegger, H., and Collins, J.: Global Positioning System: theory and practice, 326 pp., Springer-Verlag Wien, New York, 1992.
Kim, V. P. and Hegai, V. V.: On possible changes in the midlati-tude upper ionosphere before strong earthquake, J. Earthquake Predict., Res., 6, 275–280, 1997.
Kuznetsov, V. V., Plotkin, V. V., Izraileva, N. I., and Nesterova, I. I.: The investigation of electromagnetic interactions between regions surrounding the Earth, J. Atmos. Terr. Phys., 57, 1639– 1660, 1995.
Liu, J. Y., Chen, Y. I., Pulinets, S. A., Tsai, Y. B., and Chuo, Y. J.: Seismo-ionospheric signatures prior to M ≥ 6.0 Taiwan earth-quakes, Geophys. Res. Lett., 27, 3113–3116, 2000.
Liu, J. Y., Chen, Y. I., Chuo, Y. J., and Tsai, H. F.: Variations of ionospheric total electron content during Chi-Chi earthquake, Geophys. Res. Lett., 28, 1383–1386, 2001.
Lu, G., Pi., X., Richmond, A. D., and Roble, R. G.: Variations of to-tal electron content during geomagnetic disturbances, Geophys. Res. Lett., 25, 253–256, 1998.
Ondoh, T.: Ionospheric disturbances associated with great earth-quake of Hokkaido southwest coast, Japan of 12 July 1993, Phys. Earth and Planet. Inter., 105, 261–269, 1998.
Pulinets, S. A.: Strong earthquake prediction possibility with the help of topside sounding from satellites, Adv. Space Res., 21, 455–458, 1998.
Sorokin, V. M., Chmyrev, V. M., and Yaschenko, A. K.: Electro-dynamic model of the lower atmosphere and the ionosphere cou-pling, J. Atmos. Sol. Terr. Phys., 63, 1681–1691, 2001. Zaslavski, Y., Parrot, M., and Blanc, E.: Analysis of TEC
mea-surements above active seismic regions, Phys. Earth and Planet. Inter., 105, 219–228, 1998.