HAL Id: hal-00297824
https://hal.archives-ouvertes.fr/hal-00297824
Submitted on 9 Nov 2005HAL is a multi-disciplinary open access
archive for the deposit and dissemination of sci-entific research documents, whether they are pub-lished or not. The documents may come from teaching and research institutions in France or abroad, or from public or private research centers.
L’archive ouverte pluridisciplinaire HAL, est destinée au dépôt et à la diffusion de documents scientifiques de niveau recherche, publiés ou non, émanant des établissements d’enseignement et de recherche français ou étrangers, des laboratoires publics ou privés.
The effect of temperature and salinity on the stable
hydrogen isotopic composition of long chain alkenones
produced by Emiliania huxleyi and Gephyrocapsa
oceanica
S. Schouten, J. Ossebaar, K. Schreiber, M. V. M. Kienhuis, G. Langer, J.
Bijma
To cite this version:
S. Schouten, J. Ossebaar, K. Schreiber, M. V. M. Kienhuis, G. Langer, et al.. The effect of temperature and salinity on the stable hydrogen isotopic composition of long chain alkenones produced by Emiliania huxleyi and Gephyrocapsa oceanica. Biogeosciences Discussions, European Geosciences Union, 2005, 2 (6), pp.1681-1695. �hal-00297824�
BGD
2, 1681–1695, 2005 Stable hydrogen isotopes of long chain alkenones S. Schouten et al. Title Page Abstract Introduction Conclusions References Tables Figures J I J I Back CloseFull Screen / Esc
Print Version Interactive Discussion EGU Biogeosciences Discussions, 2, 1681–1695, 2005 www.biogeosciences.net/bgd/2/1681/ SRef-ID: 1810-6285/bgd/2005-2-1681 European Geosciences Union
Biogeosciences Discussions
Biogeosciences Discussions is the access reviewed discussion forum of Biogeosciences
The e
ffect of temperature and salinity on
the stable hydrogen isotopic composition
of long chain alkenones produced by
Emiliania huxleyi and Gephyrocapsa
oceanica
S. Schouten1, J. Ossebaar1, K. Schreiber2, M. V. M. Kienhuis1, G. Langer2, and J. Bijma2
1
Royal Netherlands Institute for Sea Research, Department of Marine Biogeochemistry and Toxicology, P.O. Box 59, 1790 AB, Den Burg, Texel, The Netherlands
2
Alfred Wegener Institute for Polar and Marine Research, P.O. Box 12 01 61, 27 515 Bremerhaven, Germany
Received: 30 September 2005 – Accepted: 21 October 2005 – Published: 9 November 2005 Correspondence to: S. Schouten ([email protected])
BGD
2, 1681–1695, 2005 Stable hydrogen isotopes of long chain alkenones S. Schouten et al. Title Page Abstract Introduction Conclusions References Tables Figures J I J I Back CloseFull Screen / Esc
Print Version Interactive Discussion
EGU
Abstract
Two haptophyte algae, Emiliania huxleyi and Gephyrocapsa oceanica, were cultured at different temperatures and salinities to investigate the impact of these factors on the hydrogen isotopic composition of long chain alkenones synthesized by these al-gae. Results showed that alkenones synthesized by G. oceanica were on average
5
depleted in D by 30 per mil compared to those of E. huxleyi when grown under simi-lar conditions. The fractionation factor, αalkenones−H
2O, ranged from 0.760 to 0.815 for E. huxleyi and from 0.741 to 0.788 for G. oceanica. There was no significant
corre-lation of αalkenones−H
2O with temperature but a positive linear correlation was observed
between αalkenones−H
2O and salinity with ∼3 per mil change in fractionation per salinity
10
unit. This suggests that salinity can have a substantial impact on the stable hydrogen isotopic composition of long chain alkenones in natural environments and, vice versa, that δD can possibly be used as a proxy to estimate paleosalinity.
1. Introduction
The oxygen and hydrogen isotopic composition of sea water mainly depends on the
de-15
gree of evaporation and influx of freshwater. Hence, ancient records of δD and δ18O of marine waters can, for example, be used to estimate the salinity or to trace the relative influx of rivers. The δ18O of waters is recorded in the carbonate shells of foraminifera. Hydrogen isotopic compositions may be recorded in the non-exchangeable hydrogen in organic matter although with a considerable “vital effect” (e.g. isotope fractionation
20
related to the biosynthetic pathways). This is due to the production of NADPH from NADP, leading to an initial depletion of ca 170‰ in the primary photosynthate (reviewed by Hayes, 2001). The δD value of fossil bulk organic matter has sometimes been used to reconstruct changes in salinities. For example, Krishnamurthy et al. (2000) sug-gested that Mediterranean sapropels were deposited under different surface salinities
25
BGD
2, 1681–1695, 2005 Stable hydrogen isotopes of long chain alkenones S. Schouten et al. Title Page Abstract Introduction Conclusions References Tables Figures J I J I Back CloseFull Screen / Esc
Print Version Interactive Discussion
EGU
of hydrogen isotopic compositions of fossil organic matter is complicated by the large potential for exchange of hydrogen after deposition of the initial organic matter (e.g. Schimmelman et al., 1999). Thus, the δD of bulk organic matter has rarely been used for paleoenvironmental reconstructions.
A better method for reconstructing ancient δD values of organic matter is now
avail-5
able through some recent technical innovations, i.e. compound-specific hydrogen iso-tope analysis. Through this technique δD values of individual compounds may be determined with an accuracy of 3–5‰. Recent investigations by Sessions et al. (2004) indicate that exchange of hydrogen of alkanes and sterols after deposition of the com-pounds in the sediments will only have a relatively small effect on short geological time
10
scales. Thus, compound-specific hydrogen seems to be a unique tool to reconstruct ancient deuterium contents of organic matter and, if the isotopic fractionation factor is known, of water in which the organisms grew.
Similar to stable carbon isotopes, the δD values of individual compounds cannot be straightforwardly interpreted without knowledge of the effects of biosynthetic pathways
15
and environmental parameters. Preliminary results using cultures of a diverse set of microorganisms (Sessions et al., 1999) and re-evaluation of earlier work led Hayes (2001) to suggest that the stable hydrogen isotopic composition of lipids in organisms are primarily a function of their biosynthetic pathways and not so much of the carbon acquisition mechanisms (in strong contrast to13C-contents of lipids). Acetogenic lipids
20
such as fatty acids are depleted by ca. 150 to 250‰ compared to culture water whilst isoprenoidal lipids are additionally depleted in D by 10–130‰ depending on whether they are synthesized in the cytosol (e.g. sterols) or in the plastid (e.g. phytol). The impact of growth conditions on the isotopic difference between lipids and culture water has not yet been established in any great detail. However, Sauer et al. (2002) found
25
a consistent difference of ∼200‰ between δD values of sterols and that of surface waters in a diverse number of marine and lacustrine sediments. Huang et al. (2004) found a strong relation between the δD values of palmitic acid and waters for several lakes. Saches et al. (2004) analysed lake surface sediments and found a consistent
BGD
2, 1681–1695, 2005 Stable hydrogen isotopes of long chain alkenones S. Schouten et al. Title Page Abstract Introduction Conclusions References Tables Figures J I J I Back CloseFull Screen / Esc
Print Version Interactive Discussion
EGU
fractionation of ∼157‰ between the C17 n-alkane and meteoric waters. This suggests that certain lipids can be used to track the original isotopic composition of the culture water of their parent organisms.
Potentially valuable biomarkers to reconstruct ancient δD values of water are long chain alkenones produced by haptophyte algae. Paul (2002) performed an initial
in-5
vestigation of the hydrogen isotopic composition of C37 alkenones using a culture of
Emiliania huxleyi grown in waters of different stable hydrogen isotopic compositions.
Fractionation between δD of C37alkenones and culture water was relatively consistent at ∼232‰. Recently, Englebracht and Sachs (2005) found a similar fractionation of ∼225‰. Using this, Paul (2002) was able to reconstruct ancient δD values of
Mediter-10
ranean seawater during sapropel formation using the δD values of C37 alkenones. These values were 30–35‰ depleted in D compared to today’s seawater suggest-ing substantial freshensuggest-ing of the surface waters dursuggest-ing sapropel deposition, consistent with most depositional models of sapropel formation. However, many factors a ffect-ing the relation between paleohydrology and stable hydrogen isotopic compositions of
15
C37 alkenones still remain unknown. Here we investigated some of these factors by analysing the stable isotopic composition of C37 alkenones in cultures of E. huxleyi and Gephyrocapsa oceanica grown at different temperatures and salinities.
2. Material and methods
2.1. Culturing
20
Emiliania huxleyi (strain PMLB92/11) and Gephyrocapsa oceanica (strain JSI) were
grown in F/2 medium at different salinities and temperatures. F/2 medium was pre-pared by adding the usual nutrient-, trace-element-, and vitamin supplements to natural seawater with a salinity of 32.5 PSU (Guillard, 1975). After filtration, part of the medium was evaporated at 50◦C until the target salinity above 32.5 PSU was reached. Salinities
25
BGD
2, 1681–1695, 2005 Stable hydrogen isotopes of long chain alkenones S. Schouten et al. Title Page Abstract Introduction Conclusions References Tables Figures J I J I Back CloseFull Screen / Esc
Print Version Interactive Discussion
EGU
above saturation light intensities (ca. 300 µE,m−2s−1). Cell counts were carried out every day or every other day, depending on the calculated growth rates. Once the cul-tures reached a minimum of 105cells ml−1, the experiment was terminated by filtration over a precombusted 0.7 mm GFF filter. Filters were frozen immediately and stored at −80◦C until analysis. Filtered waters were analysed by Elemental Analysis/Thermal
5
Conversion/ isotope ratio monitoring mass spectrometry (EA/TC/irmMS).
Filters were extracted ultrasonically using methanol, methanol:dichloromethane 1:1 v/v mixture and dichloromethane. The total extract was separated using col-umn chromatography with Al2O3 as stationary phase and a mixture of hexane and dichloromethane (9:1, v/v) to elute the apolar fraction, a mixture of hexane and
10
dichloromethane (1:1, v/v) to elute the alkenone fraction and a mixture of methanol and dichloromethane (1:1, v/v) to elute the residual polar fraction. The alkenone frac-tion was analysed by gas chromatography (GC), GC/mass spectrometry (GC/MS) and GC-thermal conversion-isotope ratio mass spectrometry (GC/TC/irmMS).
2.2. Hydrogen isotope analysis
15
The hydrogen isotopic compositions of waters in which the algae were grown were de-termined by EA/TC/irmMS with a Thermo Electron EA/TC coupled to a Thermo Elec-tron DELTA Plus XL mass spectrometer. Ca. 2 µl of water was injected into a ceramic tube coated with graphite at a temperature of 1450◦C. H3+-factors were determined daily on the isotope mass spectrometer and varied between 3–4. Waters were
anal-20
ysed at least 6 times. H2gas with known isotopic composition was used as reference and the isotope values were calibrated against in house lab standards (North Sea wa-ter:+5‰ and bidistilled water: −76‰, calibrated using VSMOW and GISP standards). Compound-specific hydrogen isotopic compositions of the n-alkanes were deter-mined by GC/TC/irmMS with a Thermo Electron DELTA Plus XL mass spectrometer
25
using high temperature conversion. GC conditions were similar to conditions for GC and GC/MS analysis except that the film thickness of the CPSil 5 column was 0.4 µm
BGD
2, 1681–1695, 2005 Stable hydrogen isotopes of long chain alkenones S. Schouten et al. Title Page Abstract Introduction Conclusions References Tables Figures J I J I Back CloseFull Screen / Esc
Print Version Interactive Discussion
EGU
and that a constant flow of He was used at 2 ml/min. Compounds were pyrolyzed in an empty ceramic tube heated at 1450◦C which was pre-activated by injecting 1 µl of n-hexane. H2gas with known isotopic composition was used as reference and a mixture of C16–C32 n-alkanes with known isotopic composition (ranging from −42‰ to −256‰ vs. VSMOW) was co-injected and monitored during analysis. The average off sets
be-5
tween the measured hydrogen isotopic composition of the C16–C32n-alkanes and their off-line determined values were generally 5‰ or less. Analyses were done at least in duplicate with reproducibility always better than 7‰ (Table 1).
3. Results and discussion
Two haptophyte algae, E. huxleyi and G. oceanica, were cultured at salinities ranging
10
from 25 to 35‰ and temperatures ranging from 10 to 21◦C (Table 1). Stable hydrogen isotopic analysis showed that the δD values of the water of the algal growth medium varied from −5 to+16‰. The δD value of the water is linearly correlated with salinity reflecting the fractionation due to evaporation toward more saline media and the mix-ing line between the stock F/2 medium (32.5 PSU, δD=9‰, Table 1) and the ultrapure
15
water δD=−45±1.9‰ (Fig. 1a). The δD values of the alkenones, i.e. the combined hydrogen isotopic composition of the C37:2and the C37:3 alkenones, were considerably depleted in D compared to the δD values of the water in which they were synthe-sized and varied from −175 to −261‰ (Table 1). As the hydrogen for the long chain alkenones was ultimately derived from the water in which they grew, isotopic mass
20
balance dictates that the stable hydrogen isotopic composition of alkenones should be correlated to the stable hydrogen isotopic composition of water. If a single constant fractionation step would be responsible for the isotopic depletion in D of long chain alkenones compared to water then the following equation applies (cf. Sessions and Hayes, 2005):
25
BGD
2, 1681–1695, 2005 Stable hydrogen isotopes of long chain alkenones S. Schouten et al. Title Page Abstract Introduction Conclusions References Tables Figures J I J I Back CloseFull Screen / Esc
Print Version Interactive Discussion
EGU
where α=the isotopic fractionation factor:
α= (D/H)alkenones/(D/H)water (2)
Plotting the δD values of the alkenones against the δD values of the water should, thus, according to Eq. (1), yield a linear correlation. Indeed, this is observed for both
E. huxleyi and G. oceanica with a similar slope in the regression lines (2.9 vs. 2.6) but
5
with a different intersect (215 vs. 242) (Fig. 1b). The fact that two different regression lines are obtained shows that the two haptophyte algae fractionate differently compared to each other, i.e. G. oceanica synthesizes alkenones which are ∼30‰ more depleted in D compared to E. huxleyi under similar growing conditions (Table 1).
If the hydrogen isotopic composition of alkenones is only depending on the hydrogen
10
isotopic composition of culture water then the fractionation factor α can be calculated from either the slope or the intersect of the equations in Fig. 1a (cf. Sessions and Hayes, 2005, Eq. 8. δproduct=α × δsource+ε). For instance, when data of Paul (2002) and Englebracht and Sachs (2005) for the C37 di-unsaturated alkenone of E. huxleyi are plotted (Fig. 1c) the fractionation factor α calculated using Eq. (1) from the slope
15
(0.724) is relatively similar to that calculated from the intersect (0.774). However, the fractionation factors α calculated from the slopes of the regression lines (2.9 and 2.6 for
E. huxleyi and G. oceanica, respectively) are much larger than those derived from the
intersects (0.785 and 0.758 for E. huxleyi and G. oceanica, respectively) suggesting that more than one process is responsible for the fractionation between hydrogen in the
20
culture water and that in the alkenones. In fact, in our experiments the α values derived from the slope of the regression lines are >1 suggesting fractionation of H rather than D which is highly unlikely. Hence, the fractionation of hydrogen during the synthesis of alkenones must have varied during our experiments. Two environmental factors can be examined as they have varied in our experimental set up, i.e. temperature and salinity.
25
To correct for the change in the isotopic composition of the culture water we calculated
α for every experiment: αalkenones−H
BGD
2, 1681–1695, 2005 Stable hydrogen isotopes of long chain alkenones S. Schouten et al. Title Page Abstract Introduction Conclusions References Tables Figures J I J I Back CloseFull Screen / Esc
Print Version Interactive Discussion
EGU
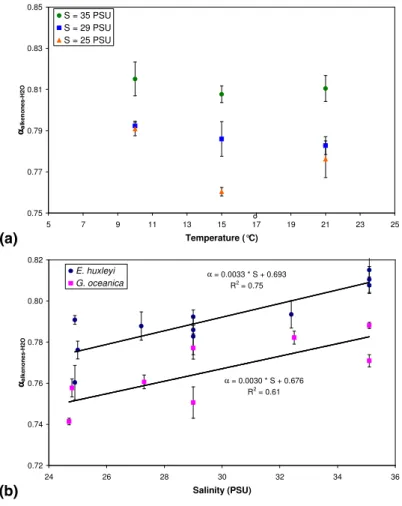
When α is plotted against temperature for experiments where E. huxleyi was grown at constant salinity no obvious correlation is visible (Fig. 2a). For example, alkenones synthesized by E. huxleyi grown at a constant salinity of 35‰ and at temperatures of 10, 15 and 21◦C have similar α values of 0.815, 0.808 and 0.810, respectively (Ta-ble 1). The same is observed for the culture experiments of G. oceanica (Ta(Ta-ble 1). This
5
suggests that temperature is not substantially affecting isotopic fractionation of hydro-gen during the synthesis of alkenones. In contrast, a strong correlation is observed between α and salinity for both E. huxleyi and G. oceanica (Fig. 2b); with increasing salinity there is a linear decrease in isotopic fractionation of ∼0.003 or ∼3‰ per salinity unit during the synthesis of alkenones. As mentioned above, G. oceanica fractionates
10
more strongly than E. huxleyi but the slope of the correlation line between α and salin-ity is similar for E. huxleyi and G. oceanica suggesting that the same process in both species is responsible for reducing fractionation with increasing salinity. Thus, our re-sults suggest that salinity has a substantial impact on the isotopic fractionation factor
α during synthesis of alkenones. The strong correlation between salinity and δD of the
15
water (“meteoric water line”) results in a strong correlation between the δDalkenoneswith salinity with a slope (4–5‰ per salinity unit; Fig. 1d). This is much larger than expected if the fractionation factor α would have remained constant and the slope would be pri-marily determined by the change in δDwater with salinity (1.7‰ per salinity unit in our experiments; dashed line in Fig. 1d) and explains why the linear correlation between
20
δDalkenones and δDwaterhas slopes much larger than 1 (Fig. 1b).
The reasons for the different hydrogen isotopic fractionation of E. huxleyi and
G. oceanica and the dependence of the fractionation on salinity are unclear. One
of the main factors determining the hydrogen isotopic fractionation during biosynthesis of lipids, and thus of long chain alkenones, is the reduction of cellular metabolites by
25
NADPH and H+ as this is the original main source of hydrogen in lipids. However, substantial exchange can occur between organic-bound hydrogen and cellular water (reviewed by Hayes, 2001). The fractionation from water via NADPH and H+ is thought to lead to an initial depletion in D of the primary photosynthate of ∼171‰ (Yakir and
BGD
2, 1681–1695, 2005 Stable hydrogen isotopes of long chain alkenones S. Schouten et al. Title Page Abstract Introduction Conclusions References Tables Figures J I J I Back CloseFull Screen / Esc
Print Version Interactive Discussion
EGU
DeNiro, 1990). Fractionation will likely also occur during the biosynthesis of alkenones from the original photosynthate and other source of hydrogen may be used in this process although ultimately they will all derive from the water of the growth medium. As there is a consistent difference between the isotopic composition of alkenones de-rived from E. huxleyi and G. oceanica some unknown species specific factor must
5
substantially affect the hydrogen isotopic composition of long chain alkenones. Further research should point out which step in the sequence of fractionation, e.g. NADPH production or lipid biosynthesis, is responsible for this species specific difference and which step is sensitive to salt concentrations.
Our results suggest that, assuming that the culture experiments can be extrapolated
10
to the natural environment, besides the stable hydrogen isotopic composition of water, salinity can have a substantial impact on the stable hydrogen isotopic composition of alkenones and possibly of other lipids as well. There is a potential for the use of δD of long chain alkenones as a paleosalinity proxy but not in the sense of Paul (2002). In natural environments a decreasing salinity is commonly associated with a decrease
15
in δD of the water (“meteoric water line”). This decrease depends on the relative depletion in D of the freshwater influx and the rate of evaporation and varies from 1– 3% per salinity unit. Our results suggest that with a deceasing salinity there is also an increasing fractionation by ∼3‰ per salinity unit which amplifies the change in δD of alkenones due to changing salinity. For example, in our experiments a change of 1 per
20
mill in salinity led to a 4–5‰ change in δD of long chain alkenones for both haptophytes whilst the δD of the water only changed by 1.7‰. Hence, δD of long chain alkenones may potentially be an excellent tool to reconstruct large scale variations in paleosalinity. The δD of the alkenones may be used directly to estimate paleosalinity by applying the relationship of e.g. E. huxleyi: S (PSU)=(δDalkenones+350)/4.8 (see Fig. 1d).
How-25
ever, the δDalkenones is likely to be a mixture of E. huxleyi and G. oceanica. To circum-vent this problem the contributions of E. huxleyi and G. oceanica to the alkenone pool may be estimated from the relative ratio of C37−38alkenoates to alkenones (Sawada et al., 1996). A mass balance of the experimentally determined equations in this study
BGD
2, 1681–1695, 2005 Stable hydrogen isotopes of long chain alkenones S. Schouten et al. Title Page Abstract Introduction Conclusions References Tables Figures J I J I Back CloseFull Screen / Esc
Print Version Interactive Discussion
EGU
can then subsequently be used to estimate paleosalinity. A second problem with the di-rect approach is that it implicitly assumes that the salinity-δDH
2Orelationship in our
cul-ture medium (see Fig. 1a) is universally valid, which is not the case. Salinity-δ18OH
2O
relationships are regionally quite variable (Fairbanks et al., 1992). An alternative ap-proach is to use the relationship of αalkenones−H
2O with salinity (Fig. 2b). For this we
5
need to know the δDH
2O of the paleo-waters. Since δDH2O and δ
18
OH
2O are directly
related via the meteoric water line (δDH
2O=8×δ 18 OH 2O+10; Dansgaard, 1964) we can calculate δDH 2O if we can determine δ 18 OH
2O. The oxygen isotopic composition of
paleo-water can be estimated by solving the paleotemperature equation for δ18OH
2O
after inserting δ18Ocalcite determined on foraminifera and another, independent
tem-10
perature proxy such as Mg/Ca or UK370. However, it is obvious that the errors
asso-ciated with each of these proxies will propagate thereby deteriorating the estimate of
δDH
2O and, subsequently, αalkenones−H2O and hence decrease the accuracy and
preci-sion of the salinity reconstruction. In addition, deuterium excess as well as the regional salinity-δD relationships may have been significantly different in the past. Therefore
15
we propose to follow an alternative approach. It seems a reasonable assumption that the fractionation characteristics (offsets and slopes) for different compounds and dif-ferent phytoplankton will be different. If this is the case, we can deconvolve salinity from the absolute difference between two compounds from the same or from different species, without involving δDH
2O. Therefore, future studies will be directed at obtaining
20
the salinity-δD relationships for different compounds from other marine phytoplankton.
Acknowledgements. We are grateful to I. Probert for providing the material for this study from
his library of living coccolithophorids. A. Benthien and C. V ¨olker (AWI) are thanked for com-ments on an earlier draft. This work was partially funded by EU contract no. EVK2-2001-00179 - 6C and is the first contribution towards the goals set by the ESF EuroClimate program
“Pale-25
BGD
2, 1681–1695, 2005 Stable hydrogen isotopes of long chain alkenones S. Schouten et al. Title Page Abstract Introduction Conclusions References Tables Figures J I J I Back CloseFull Screen / Esc
Print Version Interactive Discussion
EGU
References
Dansgaard, W.: Stable isotopes in precipitation, Tellus, 16, 436–468, 1964.
Englebrecht, A. C. and Sachs, J. P.: Determination of sediment provenance at sediment drift sites using hydrogen isotopes and unsaturation ratios of alkenones, Geochim. Cosmochim. Acta., 69, 4253–4265, 2005.
5
Fairbanks, R. G., Charles, C. D., and Wright, J. D.: Origin of global meltwater pulses. Radio-carbon after four decades, edited by: Taylor, R. E., Long, A., and Kra, R. S., New York, Springer-Verlag, 473–500, 1992.
Guillard, R. R. L.: Culture of phytoplankton for feeding marine invertebrates, in: Culture of marine invertebrate animals, Plenum Press, New York, 29–60, 1975.
10
Hayes, J. M.: Fractionation of the isotopes of Carbon and Hydrogen in biosynthetic processes, Stable Isotope Geochemistry, The Minerological Society of America, Washington, 225–277, 2001.
Huang, Y. S., Shuman, B., Wang, Y., and Webb, T.: Hydrogen isotope ratios of individual lipids in lake sediments as novel tracers of climatic and environmental change: a surface sediment
15
test, Journal of Paleolimnology, 31, 363–375, 2004.
Krishnamurthy, R. V., Meyers, P. A., and Lovan, N. A: Isotopic evidence of sea-surface freshen-ing, enhanced productivity, and improved organic matter preservation during sapropel depo-sition in the Tyrrhenian Sea, Geology, 28, 263–266, 2000.
Paul, H.: Application of novel stable isotope methods to reconstruct paleoenvironments.
Com-20
pound specific hydrogen isotopes and pore-water oxygen isotopes, PhD thesis, Swiss Fed-eral Institute of Technology, 149, 2002.
Sachse, D., Radke, J., and Gleixner, G: Hydrogen isotope ratios of recent lacustrine sedimen-tary n-alkanes record modern climate variability, Geochim. Cosmochim. Acta, 23, 4877– 4889, 2004.
25
Sauer, P. E., Eglinton, T. I., Hayes, J. M., Schimmelmann, A., and Sessions, A. L.: Compound-specific D/H ratios of lipids biomarkers from sediments as a proxy for environmental and climatic conditions, Geochim. Cosmochim. Acta, 65, 213–222, 2002.
Sawada, K., Handa, N., Shiraiwa, Y., Danbara, A., and Montani, S.: Long-chain alkenones and alkyl alkenoates in the coastal and pelagic sediments of the northwest North Pacific,
30
with special reference to the reconstruction of Emiliania huxleyi and Gephyrocapsa oceanica ratios, Org. Geochem., 24, 751–764, 1996.
BGD
2, 1681–1695, 2005 Stable hydrogen isotopes of long chain alkenones S. Schouten et al. Title Page Abstract Introduction Conclusions References Tables Figures J I J I Back CloseFull Screen / Esc
Print Version Interactive Discussion
EGU
Schimmelman, A., Lewan, M. D., and Wintsch, R. P.: Experimental controls on D/H and13C/12C ratios of kerogen, bitumen and oil during hydrous pyrolysis, Geochim. Cosmochim. Acta, 63, 3751–3766, 1999.
Sessions, A. L., Burgoyne, T. W., Schimmelman, A., and Hayes, J. M.: Fractionation of hydro-gen isotopes in lipid biosynthesis, Org. Geochem., 30, 1193–2000, 1999.
5
Sessions, A. L., Sylva, S. P., Summons, R. E., and Hayes, J. M: Isotopic exchange of carbon-bound hydrogen over geologic timescales, Geochim. Cosmochim. Acta, 68, 1545–1559, 2004.
Sessions, A. L. and Hayes, J. M.: Calculation of hydrogen isotope fractionations in biogeo-chemical systems, Geochim. Cosmochim. Acta, 69, 593–597, 2005.
10
Yakir, D. and DeNiro, M. J.: Oxygen and hydrogen isotope fractionation during cellulose metabolism in Lemna gibba L., Plant Phys., 93, 325–332, 1990.
BGD
2, 1681–1695, 2005 Stable hydrogen isotopes of long chain alkenones S. Schouten et al. Title Page Abstract Introduction Conclusions References Tables Figures J I J I Back CloseFull Screen / Esc
Print Version Interactive Discussion
EGU
Table 1. Stable hydrogen isotopic composition of culture water and C37and C38alkenones in cultures of E. huxleyi and G. oceanica.
Species S T δD H2O δD C37 δD C38 α37-H2O
(PSU) (◦C) (‰ vs. VSMOW) (‰ vs. VSMOW) (‰ vs. VSMOW)
E. huxleyi 24.9 10 −5.2±1.6 −213.3±0.6 −223.0±0.9 0.791 24.9 15 −5.4±3.1 −245.3±5.8 −250.5±2.7 0.760 25.0 21 −2.5±1.9 −229.9±1.3 −229.0±4.2 0.776 27.2 15 −0.7±1.9 −212.8±4.9 −216.0±6.1 0.788 29.0 10 0.8±1.3 −207.0±2.1 −214.3±0.7 0.792 29.0 15 1.4±1.9 −212.9±0.2 −219.8±0.8 0.786 29.0 21 2.5±1.8 −215.3±7.0 −209.4±5.0 0.783 32.4 15 9.0±2.1 −199.4±4.6 −209.4±3.8 0.793 35.1 10 12.8±2.1 −174.5±6.1 −188.3±4.8 0.815 35.1 15 12.2±1.1 −182.5±2.9 −189.8±1.6 0.808 35.1 21 16.4±2.2 −176.2±4.1 187.3±6.1 0.810 G. oceanica 24.8 15 −2.8±1.8 −244.5±2.6 −254.8±3.3 0.758 24.7 21 −3.6±0.9 −261.3±0.7 −269.7±6.1 0.741 27.3 15 −1.1±2.2 −240.2±1.1 −257.7±3.0 0.761 29.0 15 3.6±1.6 −220.1±4.1 −229.5±5.7 0.777 29.0 21 4.0±1.4 −246.6±6.2 −257.4±2.4 0.751 32.5 15 9.4±1.7 −210.5±1.4 −219.7±0.4 0.782 35.1 15 11.3±1.4 −203.0±0.1 −205.6±0.4 0.788 35.1 21 10.9±1.8 −220.7±1.1 −221.3±6.2 0.771
BGD
2, 1681–1695, 2005 Stable hydrogen isotopes of long chain alkenones S. Schouten et al. Title Page Abstract Introduction Conclusions References Tables Figures J I J I Back CloseFull Screen / Esc
Print Version Interactive Discussion EGU (a) Fig. 1. a b c d 0DH2O = 1.7*S - 45 R2 = 0.96 -8 -3 2 7 12 24 26 28 30 32 34 36 Salinity (PSU) 0000 DH2O (v s V S M O W ) 0Dalkenones = 4.8* S - 347 R2 = 0.86 0Dalkenones = 4.2 * S - 354 R2 = 0.74 -280 -260 -240 -220 -200 -180 -160 24 26 28 30 32 34 36 0000 Dalke no n es (v s V S M O W ) -10 10 30 50 70 90 110 0000 DH2O (v s V S M O W ) E. huxleyi G. oceanica Culture medium 0D37:2 = 0.724*0DH20 - 226 R2 = 0.991 -300 -250 -200 -150 -100 -50 0 50 100 150 200 250 -10 90 190 290 390 490 590 0000DH2O (vs VSMOW) 0000 DC 37 :2 a lk en on e (v s V S M O W ) Paul (2002)
Englebracht and Sachs (2005) 0Dalk = 2.6 * 0DH2O - 215 R2 = 0.85 0Dalk = 2.9 * 0DH2O - 242 R2 = 0.76 -280 -270 -260 -250 -240 -230 -220 -210 -200 -190 -180 -170 -160 -150 -10 -5 0 5 10 15 20 0000DH2O (vs VSMOW) 0000 Dal ke no ne s (v s V S M O W ) E. huxleyi G. oceanica (b) Fig. 1. a b c d 0DH2O = 1.7*S - 45 R2 = 0.96 -8 -3 2 7 12 24 26 28 30 32 34 36 Salinity (PSU) 0000 DH 2O (v s V S M O W ) 0Dalkenones = 4.8* S - 347 R2 = 0.86 0Dalkenones = 4.2 * S - 354 R2 = 0.74 -280 -260 -240 -220 -200 -180 -160 24 26 28 30 32 34 36 Salinity (PSU) 0000 Dalke no n es (v s V S M O W ) -10 10 30 50 70 90 110 0000 DH2O (v s V S M O W ) E. huxleyi G. oceanica Culture medium 0D37:2 = 0.724*0DH20 - 226 R2 = 0.991 -300 -250 -200 -150 -100 -50 0 50 100 150 200 250 -10 90 190 290 390 490 590 0000DH2O (vs VSMOW) 0000 DC 37 :2 a lk en on e (v s V S M O W ) Paul (2002)
Englebracht and Sachs (2005) 0Dalk = 2.6 * 0DH2O - 215 R2 = 0.85 0Dalk = 2.9 * 0DH2O - 242 R2 = 0.76 -280 -270 -260 -250 -240 -230 -220 -210 -200 -190 -180 -170 -160 -150 -10 -5 0 5 10 15 20 0000DH2O (vs VSMOW) 0000 Dal ke no ne s (v s V S M O W ) E. huxleyi G. oceanica (c) Fig. 1. a b c d 0DH2O = 1.7*S - 45 R2 = 0.96 -8 -3 2 7 12 24 26 28 30 32 34 36 Salinity (PSU) 0000 DH2O (v s V S M O W ) 0Dalkenones = 4.8* S - 347 R2 = 0.86 0Dalkenones = 4.2 * S - 354 R2 = 0.74 -280 -260 -240 -220 -200 -180 -160 24 26 28 30 32 34 36 Salinity (PSU) 0000 Dal ke no n es (v s V S M O W ) -10 10 30 50 70 90 110 0000 DH 2O (v s V S M O W ) E. huxleyi G. oceanica Culture medium 0D37:2 = 0.724*0DH20 - 226 R2 = 0.991 -300 -250 -200 -150 -100 -50 0 50 100 150 200 250 -10 90 190 290 390 490 590 0000DH2O (vs VSMOW) 0000 DC 37 :2 a lk en on e (v s V S M O W ) Paul (2002)
Englebracht and Sachs (2005) 0Dalk = 2.6 * 0DH2O - 215 R2 = 0.85 0Dalk = 2.9 * 0DH2O - 242 R2 = 0.76 -280 -270 -260 -250 -240 -230 -220 -210 -200 -190 -180 -170 -160 -150 -10 -5 0 5 10 15 20 0000DH2O (vs VSMOW) 0000 Dal ke no ne s (v s V S M O W ) E. huxleyi G. oceanica (d) Fig. 1. a b c d 0DH2O = 1.7*S - 45 R2 = 0.96 -8 -3 2 7 12 24 26 28 30 32 34 36 Salinity (PSU) 0000 DH2O (v s V S M O W ) 0Dalkenones = 4.8* S - 347 R2 = 0.86 0Dalkenones = 4.2 * S - 354 R2 = 0.74 -280 -260 -240 -220 -200 -180 -160 24 26 28 30 32 34 36 Salinity (PSU) 0000 Dal ke no n es (v s V S M O W ) -10 10 30 50 70 90 110 0000 DH2O (v s V S M O W ) E. huxleyi G. oceanica Culture medium 0D37:2 = 0.724*0DH20 - 226 R2 = 0.991 -300 -250 -200 -150 -100 -50 0 50 100 150 200 250 -10 90 190 290 390 490 590 0000DH2O (vs VSMOW) 0000 DC 37 :2 a lk en on e (v s V S M O W ) Paul (2002) Englebracht and Sachs (2005)
0Dalk = 2.6 * 0DH2O - 215 R2 = 0.85 0Dalk = 2.9 * 0DH2O - 242 R2 = 0.76 -280 -270 -260 -250 -240 -230 -220 -210 -200 -190 -180 -170 -160 -150 -10 -5 0 5 10 15 20 0000DH2O (vs VSMOW) 0000 Dalke no ne s (v s V S M O W ) E. huxleyi G. oceanica
Fig. 1. Results of δD measurements of water and alkenones for cultures of E. huxleyi and
G. oceanica plotted against experimental variables. (a) δD of culture waters plotted against
salinity,(b) δD of C37alkenones plotted against δD of culture water,(c) δD of C37:2 alkenone plotted against δD of culture water from Paul (2000; filled circles) and Engelbracht and Sachs (2005, filled triangles) (cf. Sessions and Hayes, 1995) and(d) δD of C37alkenones and δD of culture waters (dotted line) plotted against salinity.
BGD
2, 1681–1695, 2005 Stable hydrogen isotopes of long chain alkenones S. Schouten et al. Title Page Abstract Introduction Conclusions References Tables Figures J I J I Back CloseFull Screen / Esc
Print Version Interactive Discussion EGU (a)
a
b
° α = 0.0033 * S + 0.693 R2 = 0.75 α = 0.0030 * S + 0.676 R2 = 0.61 0.72 0.74 0.76 0.78 0.80 0.82 24 26 28 30 32 34 36 Salinity (PSU) ααααalke no ne s-H 2O E. huxleyi G. oceanica 0.75 0.77 0.79 0.81 0.83 0.85 5 7 9 11 13 15 17 19 21 23 25 Temperature (°C) ααααalke no ne s-H 2O S = 35 PSU S = 29 PSU S = 25 PSU (b)a
b
° α = 0.0033 * S + 0.693 R2 = 0.75 α = 0.0030 * S + 0.676 R2 = 0.61 0.72 0.74 0.76 0.78 0.80 0.82 24 26 28 30 32 34 36 Salinity (PSU) ααααalke no ne s-H 2O E. huxleyi G. oceanica 0.75 0.77 0.79 0.81 0.83 0.85 5 7 9 11 13 15 17 19 21 23 25 Temperature (°C) ααααalke no ne s-H 2O S = 35 PSU S = 29 PSU S = 25 PSUFig. 2. Fractionation factor α of C37 alkenones versus water for E. huxleyi and G. oceanica plotted against(a) culture temperature and (b) against salinity.