HAL Id: hal-00297451
https://hal.archives-ouvertes.fr/hal-00297451
Submitted on 9 Apr 2008
HAL is a multi-disciplinary open access
archive for the deposit and dissemination of
sci-entific research documents, whether they are
pub-lished or not. The documents may come from
teaching and research institutions in France or
abroad, or from public or private research centers.
L’archive ouverte pluridisciplinaire HAL, est
destinée au dépôt et à la diffusion de documents
scientifiques de niveau recherche, publiés ou non,
émanant des établissements d’enseignement et de
recherche français ou étrangers, des laboratoires
publics ou privés.
Forecasting the air pollution episode potential in the
Canary Islands
C. Milford, C. Marrero, C. Martin, J. J. Bustos, X. Querol
To cite this version:
C. Milford, C. Marrero, C. Martin, J. J. Bustos, X. Querol. Forecasting the air pollution episode
potential in the Canary Islands. Advances in Science and Research, Copernicus Publications, 2008, 2,
pp.21-26. �hal-00297451�
Adv. Sci. Res., 2, 21–26, 2008 www.adv-sci-res.net/2/21/2008/
©Author(s) 2008. This work is distributed under the Creative Commons Attribution 3.0 License.
Advances in
Science and
Research
EMS
Annual
Meeting
and
8th
Eur
opean
Confer
ence
on
Applications
of
Meteor
olo
gy
2007
Forecasting the air pollution episode potential in the
Canary Islands
C. Milford1,2, C. Marrero2, C. Martin2, J. J. Bustos2, and X. Querol1 1Institute of Earth Sciences “Jaume Almera”, CSIC, Barcelona, Spain
2Iza˜na Atmospheric Research Center, Agencia Estatal de Meteorolog´ıa, Tenerife, Spain
Received: 27 December 2007 – Revised: 19 March 2008 – Accepted: 1 April 2008 – Published: 9 April 2008
Abstract. In the frame of the WMO Global Atmosphere Watch Urban Research Meteorology and Environ-ment programme (GURME), a system for forecasting air pollution episode potential in the Canary Islands has been developed. Meteorological parameters relevant to air quality (synoptic wind speed, wind direction, boundary layer height and temperature at 91 vertical levels) are obtained from the European Centre for Medium range Weather Forecasting (ECMWF) once a day for up to four days ahead. In addition, a model based on the analogue method utilising six years of historical meteorological and air quality data predicts the proba-bility of SO2 concentration exceeding certain thresholds for a measurement station located in Santa Cruz de
Tenerife. Meteorological forecasts are also provided from a high resolution (2 km) local area model (MM5) implemented for the Canary Islands domain. This simple system is able to forecast meteorological conditions which are favourable to the occurrence of pollution episodes for the forthcoming days.
1 Introduction
The adverse effects of ambient air pollution on health are well studied (e.g., Brunekreef and Holgate, 2002; Samet and Krewski, 2007). As a consequence the European Union in-troduced the Air Quality Directive (1999/30/EC) establishing hourly, daily and annual limit values for various air pollutants and a requirement to provide the public with up-to-date infor-mation on air concentrations. In addition to providing “real-time” concentrations many countries and public authorities worldwide now also provide forecasts of air quality.
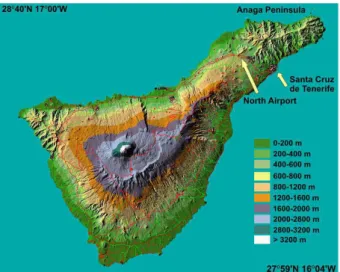
The Canary Islands benefit from trade winds dispersing and transporting pollutants over the ocean. However, this is only the case for a proportion of the time and the islands do experience pollution episodes in certain meteorological conditions due to both local anthropogenic sources (an oil refinery, power stations and substantial road and sea traffic) and natural sources (African Dust Intrusions). Consequently, a system to forecast air pollution episode potential in the Canary Islands was developed. The Canary Islands have a complex topography, as shown for Tenerife in Fig. 1, which interacts with the prevailing synoptic conditions to create mesoscale and microscale meteorological phenomena (e.g.
Correspondence to: C. Milford
sea and mountain slope breezes, stagnant conditions). These conditions provide a challenge to meteorological forecasters and also to air quality forecasting in the archipelago.
Air quality forecasting can be performed with statistical (e.g., Nunnari et al., 2004) or deterministic methods (e.g., Grell et al., 2005; Otte et al., 2005) and there are advantages and limitations to both approaches. Deterministic meth-ods require sufficient computing resources and high resolu-tion emission inventories; such an inventory is not currently available for the Canary Islands. Consequently, statistical methods were chosen for this first approach to air pollution episode potential forecasting in the Canary Islands, utilis-ing measured air quality data and meteorological data out-put from the European Centre for Medium-Range Weather Forecasts (ECMWF). The work presented here focuses on predicting meteorological conditions which are favourable to the development of pollution episodes due to local anthro-pogenic sources. Pollution episodes due to African Dust In-trusions are a regional scale phenomenon and are forecasted in a complementary system (Alonso-P´erez et al., 2004).
2 Study area
The Canary Islands are one of the regions of Spain, situ-ated in the Atlantic Ocean off the western coast of Morocco. Tenerife and Gran Canaria are the most populated islands
22 C. Milford et al.: Forecasting the air pollution episode potential in the Canary Islands
Figure 1.Topographic map of Tenerife (from Carta Digital v2.0). in the archipelago; their populations in 2006 were 853 000 and 807 000, respectively (ISTAC, 2007). For the purpose of brevity this paper concentrates only on data for Santa Cruz de Tenerife, the capital of Tenerife. Santa Cruz de Tenerife is located in the NE of the island (Fig. 1) on a SE facing slope ranging from 0 to 624 m a.s.l. at the North Airport. It is also bordered by the Anaga peninsula situated to the NE which reaches an altitude of 992 m. The oil refinery is located in Santa Cruz de Tenerife.
3 Materials and methods
3.1 Air quality and meteorological data
The air quality data used in this study consisted of hourly ambient concentrations of SO2, NO and NO2 obtained for
the period 1/1/1999 to 31/12/2004 from various monitoring stations in Santa Cruz de Tenerife (see Table 1). The stations were operated by the Department for Control of Industrial Emissions (CEI) and the Department of Public Health of the Canary Islands Government and the Iza˜na Atmospheric Re-search Center.
Meteorological parameters were obtained from the ECMWF numerical weather prediction model reanalysis at six hourly intervals (00:00, 06:00, 12:00 and 18:00 UTC for a single grid point to the north-east of Tenerife (29◦15′N 15◦45′W) for the same six-year period. The parameters in-cluded wind u and v components (m s−1) at 1000 hPa, bound-ary layer height (BLH) (m) and temperature (K) at 60 ver-tical levels. A measure of the atmospheric stability was de-rived from the integral of the potential temperature data from
H = 0 to H = 1500 m and denoted Integrated Stability
Poten-tial (EPI): EPI = 1 H H Z 0 (θ(z) − θ(0)) dz.
Table 1.Measurement station details (U: Urban; UB: Urban Back-ground; SCO: Santa Cruz Observatory).
Station Location Altitude (m) Type
Casa Cuna 28◦26′58′′N 16◦16′41′′W 180 U Viera y Clavijo 28◦27′48′′N 16◦15′37′′W 40 U Tome Cano 28◦27′49′′N 16◦15′39′′W 75 U Los Gladiolos 28◦27′35′′N 16◦16′01′′W 95 U SCO 28◦28′21′′N 16◦14′50′′W 52 UB
The meteorological data was interpolated with the Cubic Splines method to provide hourly data to be consistent with the temporal resolution of the air quality data.
3.2 Models
3.2.1 Analogue method
The analogue method is a simple statistical technique based on searching for an analogue to a target variable (predictor) in a historical dataset. Once the analogue of the predictor is found in the historical dataset, the corresponding predictand (the variable of interest) at this time is selected. It is a tech-nique that has been widely used to predict meteorological variables such as precipitation in both forecast mode (Obled et al., 2002) and in downscaling studies (e.g., Zorita and von Storch, 1999; Wetterhall et al., 2005).
An implementation based on the analogue method which is successfully used to predict precipitation in the Canary Islands (Marrero and Bustos, 2003) was adapted to predict the probability of exceedance of SO2 concentration
thresh-olds for the Tome Cano measurement station in Santa Cruz de Tenerife. The predictors used in the model were daily (12:00 UTC) geostrophic wind fields calculated from the geopotential at 500 hPa and 1000 hPa from the ECMWF re-analysis and re-analysis for the period 1999–2004. The domain selected was 20.250 to 36.0◦N, 3.375 to 27.125◦W with a resolution of 1.125◦.
In forecast mode, 100 days (analogues) are selected from the six year dataset according to their similarity with the fore-casted geostrophic wind fields and this group is reduced to 30 days after selecting those with the most similar atmospheric stability value. The pseudo-euclidean distance is used to nu-merically select the analogues, for more details see (Marrero and Bustos, 2003). The weighted median and 99th percentile of SO2concentration of these 30 days are calculated and the
probabilities of exceeding the 70th and 80th percentile of the six year SO2concentration dataset are evaluated.
3.2.2 PSU/NCAR mesoscale model (MM5)
The Fifth-Generation Pennsylvania State Univer-sity/National Center for Atmospheric Research Mesoscale Model (MM5) is a high resolution, nonhydrostatic, limited
area model (Grell et al., 1994). The resolution of the ECMWF numerical weather prediction model is 25 km. In order to gain information at a higher spatial resolution it was decided to implement MM5 for the Canary Islands. The model is run with a mother domain of 18 km resolution centered at 28.34◦N and 16.45◦W and two-way nested grids of 6 and 2 km. Hourly forecasts of wind speed and wind direction at 10 m, temperature, precipitation, cloud cover and boundary layer height are provided for two days ahead.
4 Results
4.1 Relationship of pollution episodes with meteorologi-cal conditions
The ambient air concentrations of SO2, NO and NO2 at the
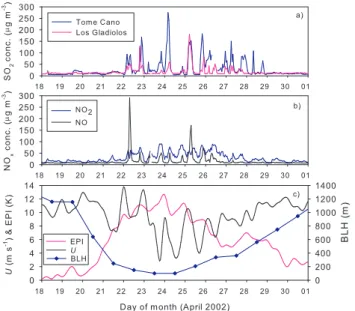
different measuring sites were analysed for the six year pe-riod and pollution episodes identified. The relationship of the pollutant concentrations to the meteorological parame-ters obtained from ECMWF at the single grid point (see Sect. 3.1) was analysed during these pollution episodes. One such pollution episode occurred during 22–28/4/2002, SO2,
NO and NO2concentrations during this episode are shown in
Fig. 2a and b while Fig. 2c shows the temporal evolution of the ECMWF variables. All values presented are hourly mean values except for BLH which are daily values at 12:00 UTC. On 18 and 19/4/2002 the boundary layer height at 12:00 was ≈1150 m and the EPI values were low. The pollutant concentrations during these days were at a low level; the mean hourly concentrations of SO2 and NO2 at Los
Gladi-olos measurement station for 18–19/4/2002 were 11 µg m−3 and 15 µg m−3, respectively. On 20/4/2002 the BLH started to decrease, reaching a minimum value of 100 m on 23 and 24/4/2002. Meanwhile the stability increased, reaching a maximum EPI value on the night of 23/4/2002. After this date the BLH started to increase gradually and the EPI de-creased. SO2concentrations at Tome Cano and Los
Gladio-los were enhanced throughout 22–27/4/2002. The maximum hourly SO2concentration at Tome Cano was 275 µg m−3and
occurred in the early hours of the morning of 24/4/2002. NO and NO2 concentrations at Los Gladiolos were also
notice-ably enhanced during 22–27/4/2002, the maximum hourly NO2concentration reached 91 µg m−3at 20:00 on 23/4/2002.
These maximum concentrations coincided with the maxi-mum stability and minimaxi-mum boundary layer height.
Analysis of other periods of high pollutant concentra-tions in the six-year dataset confirmed the importance of the boundary layer height and atmospheric stability in determin-ing pollution episodes in the Canary Islands. This is a re-sult that has been observed in other studies. Hooyberghs et al. (2005) concluded that the boundary layer height was the most important input variable for their neural network fore-cast of daily average PM10concentrations while Kukkonen et
al. (2005) found that the temporal evolution of temperature inversions and atmospheric stability were the key
meteoro-Figure 2.Mean hourly concentrations of (a) SO2, (b) NO and NO2
at Los Gladiolos and (c) stability (EPI), wind speed (U) and bound-ary layer height (BLH) from ECMWF reanalysis, 18–30 April 2002.
logical predictors of air pollution episodes in four European cities (Helsinki, London, Milan and Oslo).
The relation of pollutant concentrations with model wind speed, however, was not so clear. Although the wind speed decreased during 23–25/4/02, in general the wind speed was not low during this period. When examining the whole dataset, a correlation between pollutant concentrations and model wind speed was not found (data not shown). This con-firmed the need for a higher resolution model such as MM5.
4.2 High resolution MM5 forecast
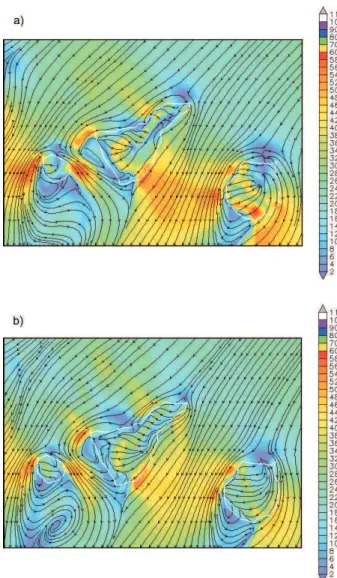
An example of the MM5 wind speed forecast at 10 m for the nested grid at 2 km resolution is shown in Fig. 3 for 29/7/2007 at 08:00 h and 14:00 h. This day was charac-terised by an extremely low inversion layer and boundary layer height (see Fig. 4) with a moderate to strong wind speed from the NE. The Anaga peninsula provides an obstacle to the wind field when such a low inversion layer is present and stagnant conditions can occur in Santa Cruz de Tenerife. This local stagnation is demonstrated by the MM5 forecast at 08:00 h; the wind speed in Santa Cruz de Tenerife is low (<4 km/h) even though the synoptic wind strength to the NE is moderate to strong. At 14:00 h this is no longer the case, at this time there is a component of the wind towards the land surface. This is caused by the land heating effect modifying the synoptic wind direction towards the land surface. These mesoscale wind phenomena affect the dispersion and trans-port of pollutants and coupled with a strong inversion layer can lead to significant pollution episodes in Santa Cruz de Tenerife and the surrounding area.
24 C. Milford et al.: Forecasting the air pollution episode potential in the Canary Islands
Figure 3. MM5 wind speed forecast (km/h) and streamlines for Tenerife, La Gomera and Gran Canaria (2 km resolution) at 10 m a.s.l. for 29/7/2007 at (a) 08:00 and (b) 14:00.
5 Air Pollution Episode Potential Forecast System
The Air Pollution Episode Potential Forecasting System is based on automatic retrieval of the meteorological parame-ters described in Sect. 3.1 (synoptic wind speed, wind di-rection, boundary layer height and temperature at 91 vertical levels) from the ECMWF forecasts at intervals of 6 h up to 108 h ahead. In 2006, the number of vertical levels in the ECMWF model was changed from 60 to 91. These meteo-rological parameters are displayed on a daily basis in a con-venient table format (Fig. 4). The analogue model is also executed daily for up to four days ahead and the outputs dis-played in the same format.
The percentile range of the six-year dataset in which the ECMWF data point lies is indicated in the table by the colour of the table entry. For example, for BLH the colours
repre-sent that the forecasted data point lies within the following percentile ranges: green (>P75), yellow (P50 to P75), orange (P25 to P50) and red (<P25). If the BLH values are in the lowest percentile range and the EPI values are in the highest percentile range, coupled with a high probability of the SO2
concentration of the analogue model exceeding 70th and 80th percentiles then this indicates high Pollution Episode Poten-tial on a synoptic scale. If this is the case, the MM5 forecasts are examined in more detail and if the predicted local wind speed and wind direction are also considered favourable to-wards a pollution episode (based on data analysis and expe-rience) a Pollution Episode Warning is issued.
Meteorological influences on air quality occur on various scales, ranging from the synoptic scale to the mesoscale and local scale. Consequently, it is necessary to assess the influ-ences on these different scales. This is achieved in the fore-casting system by considering both the ECMWF data as dis-played in the automatic table (representative of the synoptic scale) and the MM5 output (representative of the mesoscale). An example of the automatic table of predicted meteoro-logical parameters is shown in Fig. 4 for 26–30/7/2007. On 26/7/2007 the EPI values and the boundary layer and inver-sion layer height values were in the mid-range. However, the EPI was predicted to increase and the BLH and inversion height decrease at the end of this day. The predicted EPI con-tinued to increase in the following days until reaching a max-imum on the night of 28–29/7/07, while the BLH reached ex-tremely low values (<100 m). Such high EPI values and low BLH indicate high Pollution Episode Potential and this was also reflected in the values of the analogue model. Pollution Episode Warnings were issued on 27/7–1/8/2007.
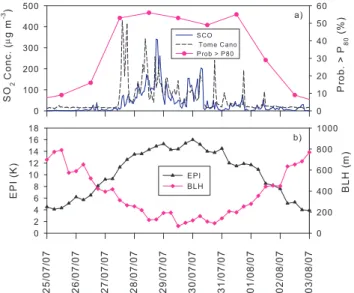
SO2concentrations from the Tome Cano (urban) and Santa
Cruz Observatory (urban background) measurement sites are shown in Fig. 5a for the period 25/7–3/8/2007. This demon-strates that a pollution episode did occur during this pe-riod. The SO2 concentration at both sites started to
in-crease on 27/7/07 and reached a maximum of 430 µg m−3 at Tome Cano on 27/7/07 and of 341 µg m−3 at SCO on 28/7/2007. The concentrations exceeded both the EU hourly (350 µg m−3) and daily limit value (125 µg m−3). The ana-logue model prediction of the probability of the SO2
concen-tration at Tome Cano exceeding the 80th percentile is also presented in Fig. 5a and this increases during 27–31/7/2007. Figure 5b shows the evolution of the EPI and the Boundary Layer Height values during this period. NO and NO2
concen-trations also increased during this period (data not shown). Future work will involve a full validation of the analogue model and assessment of the performance of the Air Pollu-tion Episode Potential Forecasting System.
6 Conclusions
An Air Pollution Episode Potential Forecasting System has been presented for the Canary Islands. This is based on
Figure 4.Example of automatic table of predicted meteorological parameters retrieved daily from ECMWF and results from the analogue model for 26–30/7/2007. Wind direction (DIR) (◦), wind direction component (ROSA), wind speed (VEL) (m s−1), Integrated Stability
Potential (EPI) (K), boundary layer height (BLH) (m), lower and upper heights of inversion (BINV, CINV) (m), temperature at lower and upper boundary of inversion (TBAS, TCIM) (◦C), median and 99th percentile of SO
2 conc. of analogues (MEDIAN, PER99), probability
of SO2conc. exceeding 70th and 80th percentiles (>%70, >%80) (%). The colours represent the percentile range of the six-year dataset in
which the datapoint lies: (<P25), (P25to P50), (P50to P75) and (>P75). Depending on the parameter the colours (green, yellow, orange and
red) indicate ascending (e.g. EPI) or descending values (e.g. wind speed and BLH).
expert assessment of the values of meteorological parame-ters obtained from ECMWF forecasts, on a novel application of a model based on the analogue method which predicts the probability of SO2 concentration exceeding thresholds
for a measurement station located in Santa Cruz de Tener-ife and on forecasts of the PSU/NCAR mesoscale model, MM5. This simple system is able to forecast meteorological conditions which are favourable to the occurrence of pollu-tion episodes for up to 108 h ahead. The implementapollu-tion of MM5 for the Canary Islands domain at 2 km resolution pro-vides crucial information, in particular concerning the pre-dicted behaviour of the mesoscale wind phenomena in the archipelago and the interactions with the complex topogra-phy of the islands. It serves as a complementary and addi-tional tool to the synoptic forecasts provided by ECMWF.
Clearly improvements to the system can be made and fu-ture work will involve exploring other advanced statistical methods for Air Quality Forecasting such as Artificial Neu-ral Networks and also development of deterministic methods coupled with MM5. It would also be of interest to expand the forecasting system to explicitly include other pollutants such as NO, NO2 and O3, this would require the consideration of
other meteorological parameters such as solar radiation. In addition, increasing the MM5 forecasts to three days ahead would improve the air quality forecasting capability.
Figure 5.(a) Mean hourly concentrations of SO2at the Santa Cruz
Observatory (SCO) and Tome Cano and analogue model prediction of the probability of the SO2concentration at Tome Cano exceeding
the 80th percentile (P80) for 25/7-3/8/2007, (b) six hourly values
of Integrated Stability Potential (EPI) and Boundary Layer Height (BLH) during the same period.
26 C. Milford et al.: Forecasting the air pollution episode potential in the Canary Islands Acknowledgements. The authors gratefully acknowledge
funding from the Spanish Ministry of Education and Science through the Juan de la Cierva Program (Orden ECI/158/2005, BOE) and from the Viceconsejer´ıa de Medio Ambiente del Gobierno de Canarias. We also would like to thank colleagues of the Iza˜na Atmospheric Research Center, in particular Yenny Gonzalez-Ramos funded by the Agencia Estatal de Meteorolog´ıa for access to data at the Santa Cruz Observatory and CEI (Viceconsejer´ıa de Medio Ambiente) and Direcci´on General de Salud P´ublica for data from their Air Quality Monitoring Networks. Edited by: S. Joffre
Reviewed by: two anonymous referees
References
Alonso-P´erez, S., Pey, J., Cuevas, E., Querol, X., Alastuey, A., Romero, P. M., and Cristobal, A.: Sistema de informaci´on sobre intrusiones de masas de aire africano en Espa˜na, in: Proceed-ings of the IX Congreso de Ingenier´ıa Ambiental PROMA 2004, Bilbao, Spain, 10–12 November 2004, 621–629, 2004.
Brunekreef, B. and Holgate, S. T.: Air pollution and health, Lancet, 360, 1233–1242, 2002.
Grell, G. A., Dudhia, J., and Stauffer, D. R.: A description of the fifth-generation Penn State/NCAR mesoscale model (MM5), NCAR Technical Note, NCAR/TN-398+STR, 117 pp., 1994. Grell, G. A., Peckham, S. E., Schmitz, R., McKeen, S. A., Frost, G.,
Skamarock, W. C., and Eder, B.: Fully coupled “online” chem-istry within the WRF model, Atmos. Environ., 39, 6957–6975, 2005.
Hooyberghs, J., Mensink, C., Dumont, G., Fierens, F., and Brasseur, O.: A neural network forecast for daily average PM10 concen-trations in Belgium, Atmos. Environ., 39, 3279–3289, 2005.
Instituto Canario de Estad´ıstica (ISTAC): Anuario Estad´ıstico de Canarias: 2006, Gobierno de Canarias, 2007.
Kukkonen, J., Pohjola, M., Sokhi, R. S., Luhana, L., Kitwiroon, N., Fragkou, L., Rantam¨aki, M., Berge, E., Odegaard, V., Slordal, L. H., Denby, B., and Finardi, S.: Analysis and evaluation of se-lected local-scale PM10 air pollution episodes in four European cities: Helsinki, London, Milan and Oslo, Atmos. Environ., 39, 2759–2773, 2005.
Marrero, C. and Bustos, J. J.: Adaptaci´on para Canarias de un modelo de predicci´on estad´ıstica de la precipitaci´on mediante un m´etodo anal´ogico, in: Proceedings of the Primer Encuentro sobre Meteorolog´ıa y Atm´osfera de Canarias, Tenerife, Spain, 12–14 November 2003, 107–109, 2003.
Nunnari, G., Dorling, S., Schlink, U., Cawley, G., Foxall, R., and Chatterton, T.: Modelling SO2concentration at a point with
sta-tistical approaches, Environ. Modell. Softw., 19, 887–905, 2004. Obled, C., Bontron, G., and Garcon, R.: Quantitative precipitation forecasts: a statistical adaptation of model outputs through an analogues sorting approach, Atmos. Res., 63, 303–324, 2002. Otte, T. L., Pouliot, G., Pleim, J. E., Young, J. O., Schere, K. L., and
Mathur, R.: Linking the Eta Model with the Community Multi-scale Air Quality (CMAQ) modeling system to build a national air quality forecasting system, Weather Forecast., 20, 367–384, 2005
Samet, J. and Krewski, D.: Health effects associated with exposure to ambient air pollution, J. Toxicol. Env. Heal. A, 70, 227–242, 2007.
Wetterhall, F., Halldin, S., and Xu, C. Y.: Statistical precipitation downscaling in central Sweden with the analogue method, J. Hy-drol., 306, 174–190, 2005.
Zorita, E. and von Storch, H.: The analog method as a simple statis-tical downscaling technique: Comparison with more complicated methods, methods, J. Climate, 12, 2474–2489, 1999.