HAL Id: hal-00297892
https://hal.archives-ouvertes.fr/hal-00297892
Submitted on 8 May 2007HAL is a multi-disciplinary open access
archive for the deposit and dissemination of sci-entific research documents, whether they are pub-lished or not. The documents may come from teaching and research institutions in France or abroad, or from public or private research centers.
L’archive ouverte pluridisciplinaire HAL, est destinée au dépôt et à la diffusion de documents scientifiques de niveau recherche, publiés ou non, émanant des établissements d’enseignement et de recherche français ou étrangers, des laboratoires publics ou privés.
Community shifts and carbon translocation within
metabolically-active rhizosphere microorganisms in
grasslands under elevated CO2
K. Denef, H. Bubenheim, K. Lenhart, J. Vermeulen, O. van Cleemput, P.
Boeckx, C. Müller
To cite this version:
K. Denef, H. Bubenheim, K. Lenhart, J. Vermeulen, O. van Cleemput, et al.. Community shifts and carbon translocation within metabolically-active rhizosphere microorganisms in grasslands under elevated CO2. Biogeosciences Discussions, European Geosciences Union, 2007, 4 (3), pp.1437-1460. �hal-00297892�
BGD
4, 1437–1460, 2007 Microbial communities and C translocation under elevated CO2 K. Denef et al. Title Page Abstract Introduction Conclusions References Tables Figures ◭ ◮ ◭ ◮ Back CloseFull Screen / Esc
Printer-friendly Version Interactive Discussion
Biogeosciences Discuss., 4, 1437–1460, 2007 www.biogeosciences-discuss.net/4/1437/2007/ © Author(s) 2007. This work is licensed
under a Creative Commons License.
Biogeosciences Discussions
Biogeosciences Discussions is the access reviewed discussion forum of Biogeosciences
Community shifts and carbon
translocation within metabolically-active
rhizosphere microorganisms in
grasslands under elevated CO
2
K. Denef1, H. Bubenheim2, K. Lenhart2, J. Vermeulen1, O. Van Cleemput1, P. Boeckx1, and C. M ¨uller2,*
1
Laboratory of Applied Physical Chemistry, Ghent University, Coupure Links 653, 9000 Gent, Belgium
2
Justus-Liebig-University Gießen, Heinrich-Buff-Ring 26-32, 35392 Gießen, Germany
*
now at: School of Biology and Environmental Science, University College Dublin Belfield, Dublin 4, Ireland
Received: 17 April 2007 – Accepted: 24 April 2007 – Published: 8 May 2007 Correspondence to: K. Denef ([email protected])
BGD
4, 1437–1460, 2007 Microbial communities and C translocation under elevated CO2 K. Denef et al. Title Page Abstract Introduction Conclusions References Tables Figures ◭ ◮ ◭ ◮ Back CloseFull Screen / Esc
Printer-friendly Version Interactive Discussion
Abstract
The aim of this study was to identify the microbial communities that are actively in-volved in the assimilation of rhizosphere-C and are most sensitive in their activity to elevated atmospheric CO2 in grassland ecosystems. For this, we analyzed 13C sig-natures in microbial biomarker phospholipid fatty acids (PLFA) from an in situ13CO2 5
pulse-labeling experiment in the Gießen Free-Air Carbon dioxide Enrichment grass-lands (GiFACE, Germany) exposed to ambient and elevated (i.e. 50% above ambient) CO2concentrations. Carbon-13 PLFA measurements at 3 h, 10 h and 11 months after the pulse-labeling indicated a much faster transfer of newly produced rhizosphere-C to fungal compared to bacterial PLFA. After 11 months, the proportion of13C had de-10
creased in fungal PLFA but had increased in bacterial PLFA compared to a few hours after the pulse-labeling. Nevertheless, a significant proportion of the rapidly assimi-lated rhizosphere-C was still present in fungal PLFA after 11 months. These results demonstrate the dominant role of fungi in the immediate assimilation of rhizodeposits in grassland ecosystems, while also suggesting a long-term retention of rhizosphere-C 15
in the fungal mycelium as well as a possible translocation of the rhizosphere-C from the fungal to bacterial biomass. Elevated CO2caused an increase in the relative abun-dance of root-derived PLFA-C in the saprotrophic fungal PLFA 18:2ω6,9 as well as arbuscular mycorrhizal fungal PLFA 16:1ω5, but a decrease in the saprotrophic fungal biomarker PLFA 18:1ω9. This suggests enhanced rhizodeposit-C assimilation only by 20
selected fungal communities under elevated CO2.
1 Introduction
In the last ∼150 years, the atmospheric CO2concentration has increased by ∼33% due
to human activity, and is predicted to continue to rise by ∼0.4% per year (Alley et al., 2007). A continued rise in CO2may stimulate plant biomass production as well as root
25
growth when sufficient mineral nutrients are available (Curtis and Wang, 1998; Ghan-1438
BGD
4, 1437–1460, 2007 Microbial communities and C translocation under elevated CO2 K. Denef et al. Title Page Abstract Introduction Conclusions References Tables Figures ◭ ◮ ◭ ◮ Back CloseFull Screen / Esc
Printer-friendly Version Interactive Discussion
noum et al., 2000). This could result in greater carbon inputs into the soil due to higher rates of plant litterfall, root turnover and rhizodeposition (Rogers et al., 1994; Cotrufo and Gorissen, 1997; Sadowsky and Schortemeyer, 1997; DeLucia et al., 1999) as well as alterations in the chemical composition of plant tissues (e.g. higher C/N ratio) and root exudates (Cotrufo et al., 1994; Jongen et al., 1995; Schortemeyer et al., 1996). 5
Soil microorganisms are the key processors of soil organic matter and heavily rely on organic C supply for their growth. Any change in the amount and/or composition of plant material input into the soil in response to elevated CO2is therefore likely to affect soil microbial growth and metabolism of plant-derived substrates, and consequently C and N cycling in soils (Zak et al., 1993). In N limited systems, an enhanced C in-10
put under increased CO2 could also alter microbial community composition in favor of fungi. Fungi are capable of colonizing nutrient-poor and recalcitrant substrates due to their greater and more variable C:N ratio, their wide-ranging enzymatic capabilities and their ability to translocate essential nutrients through their hyphae over considerable distances (Frankland et al., 1990; Hu et al., 2001). Alterations in soil microbial com-15
munity composition could have significant consequences for C and N transformations. For instance, it has been postulated that bacteria-dominated food webs lead to greater short-term mineralization rates of organic C and N (Wardle et al., 2004), while fungal stimulation, in particular of arbuscular mycorrhizal fungi, may enhance C sequestration (Treseder and Allen, 2000; Bailey et al., 2002) and N immobilization through hyphal 20
translocation (Beare, 1997; Frey et al., 2000).
Microbial community composition is frequently assessed through in situ analyses of phospholipid fatty acids (PLFA), a diverse group of essential cell membrane lipids, sev-eral of which can be used as biomarkers for specific microbial groups (Vestal and White, 1989; Zelles, 1997). Phospholipids rapidly degrade following cell death and thus can 25
be assumed to reflect the occurrence of living organisms. So far, contrasting results have been reported on the impacts of elevated CO2 on the composition of the
micro-bial community based on PLFA profiles, ranging from increased proportions of fungal (e.g. Klironomos et al., 1996; Rillig et al., 1999; Zak et al., 2000; Rønn et al., 2002) or
BGD
4, 1437–1460, 2007 Microbial communities and C translocation under elevated CO2 K. Denef et al. Title Page Abstract Introduction Conclusions References Tables Figures ◭ ◮ ◭ ◮ Back CloseFull Screen / Esc
Printer-friendly Version Interactive Discussion
bacterial biomarker PLFAs (Montealegre et al., 2002; Sonnemann and Wolters, 2005; Drissner et al., 2007) to no effects at all on microbial community structure (Zak et al., 1996; Niklaus et al., 2003; Ebersberger et al., 2004). Possible causes for these dis-crepancies include the variety in analysis methods and the type of CO2 fumigation systems used in different studies, as well as the presence of different plant species, 5
diverse soil conditions, and variation in microbial communities colonizing the rhizo-sphere in different ecosystems. Moreover, most of these studies have assessed the effects of elevated CO2on the composition of the total microbial community, including
both metabolically-active and inactive soil microbial communities. Specific information on the responses to elevated CO2 of only those microbial community structures that 10
are actively involved in organic matter transformations is crucial in order to better pre-dict how key biogeochemical processes will function in an environment with increasing CO2concentrations.
The combination of13C stable isotope and PLFA analysis through gas chromatogra-phy – combustion – isotope ratio mass spectrometry (GC-C-IRMS) has made it possi-15
ble to trace the flow of C from a13C-labeled substrate into the PLFA fraction of native microbial communities (Boschker et al., 1998), and to identify the microbial communi-ties actively assimilating the labeled substrate-derived C. Stable isotope probing (SIP) of PLFA has been successfully attained through laboratory incubations with 13C en-riched substrate additions (e.g. Waldrop and Firestone, 2004; McMahon et al., 2005; 20
Williams et al., 2006) as well as in situ through 13C-CO2 pulse-labeling of growing
plants (Butler et al., 2003; Treonis et al., 2004; Prosser et al., 2006; Lu et al., 2007). By using in situ PLFA-based SIP analyses, several studies have demonstrated a dominant contribution of fungi in the immediate assimilation of rhizosphere-derived C (Butler et al., 2003; Treonis et al., 2004; Olsson and Johnson, 2005).
25
Phillips et al. (2002) was the first to introduce the PLFA-based SIP technique in elevated CO2 research through a laboratory incubation with
13
C enriched substrates added to FACE soils. In their study, elevated CO2increased fungal metabolism of
13
C-labeled plant-derived cellobiose. Billings and Ziegler (2005) were the first to trace in situ
BGD
4, 1437–1460, 2007 Microbial communities and C translocation under elevated CO2 K. Denef et al. Title Page Abstract Introduction Conclusions References Tables Figures ◭ ◮ ◭ ◮ Back CloseFull Screen / Esc
Printer-friendly Version Interactive Discussion
the13C depleted signature of supplemental CO2into PLFAs in the Duke-FACE
experi-mental forest sites, excluding any potentially confounding effects of13C additions in the laboratory (cf. Phillips et al., 2002). Although the results from their study indicated clear differences in13C-depleted tracer incorporation among the different microbial groups in the elevated CO2soils, the effect of elevated CO2on the metabolically-active microbial
5
communities could not be assessed, as the control plots (the case in all FACE exper-iments) did not receive an equivalent 13C depleted tracer. A more conclusive test of CO2effects on substrate utilization by specific microbial groups would require the use
of an identical13C tracer incorporated in both elevated CO2and control plots.
In this study, we combined microbial community PLFA analyses with an in situ13 C-10
CO2 pulse-labeling approach in grassland sites from the long-term Gießen FACE
ex-periment in order to (1) identify the microbial groups that are actively metabolizing recently produced rhizosphere-substrate in grassland ecosystems in a CO2 enriched environment, and (2) elucidate which communities are most sensitive in their activity to elevated CO2. To our knowledge, this is the first study assessing in situ the effect
15
of elevated CO2 on active microbiota in grassland ecosystems through PLFA-SIP in long-term FACE experiments. The main hypothesis was that elevated CO2would have
a larger impact on the activity of fungi, in particular mycorrhizal fungi, compared to bac-terial communities due to the dominant role of fungi in rhizosphere carbon assimilation.
2 Material and methods
20
2.1 Research site description and13C-CO2pulse-labeling
The effect of elevated CO2 concentration on active soil microbial communities was
studied in permanent grassland soils from the University of Gießen long-term Free Air Carbon dioxide Enrichment experiment (GiFACE), which is located at the “Environmen-tal Monitoring and Climate Impact Research Station Linden” near Gießen (Germany) 25
at 50◦32′N and 8◦41′E and at an elevation of 172 m a.s.l. The GiFACE experiment was
BGD
4, 1437–1460, 2007 Microbial communities and C translocation under elevated CO2 K. Denef et al. Title Page Abstract Introduction Conclusions References Tables Figures ◭ ◮ ◭ ◮ Back CloseFull Screen / Esc
Printer-friendly Version Interactive Discussion
established in 1998 to study the responses of a semi-natural grassland ecosystem to elevated CO2. The extensively managed grassland (fertilization was 40 kg N ha−1yr−1
since 1995) has not been ploughed for at least 100 years, but is mown twice a year since 1993. The mean annual precipitation and air temperature are 586 mm and 9.3◦C, respectively. The soil is a Fluvic Gleysol with a texture of sandy clay loam over a clay 5
layer (FAO classification). The vegetation was dominated by an Arrhenatheretum
ela-tioris (Br.-Bl.) Filipendula ulmaria sub-community vegetation. A detailed description of
the experimental site can be found in J ¨ager et al. (2003).
In September 2005, two13C-CO2pulse-labeling events were conducted on plots E4
and K4 of the GiFACE experiment. These plots were selected because of their designa-10
tion to soil process research in GiFACE. Plot K4 is naturally exposed to “ambient” CO2 concentrations and E4 is experimentally exposed to “elevated” CO2concentrations at
50% above ambient levels. Since the start of the GiFACE experiment, the “elevated” E4 plot has been exposed to CO2 with a more depleted δ13C signature (i.e. –25‰ between 1998 and June 2004, and –48‰ after June 2004) compared to the CO2 to
15
which the “ambient” K4 plot was exposed (–8‰). The two pulse-labeling events were performed on two consecutive days under similar weather conditions, each for a period of 6 h. The pulse-labeling consisted of an automated supply of13CO2through
acidify-ing13C-labeled Na2CO3(99 atom%) to photosynthesizing grasses inside a plexiglass
chamber (0.4×0.4×0.5 m) placed on top of a stainless-steel frame. This frame was in-20
serted into the plots a few weeks prior to the start of pulse-labeling in order to minimize disturbance-induced soil respiration during the pulse-labeling. The CO2concentration
inside the chamber was controlled and maintained at concentrations corresponding to those naturally occurring at the “ambient” K4 plot and those experimentally controlled at the “elevated” E4 site.
25
2.2 Soil sampling
Soil samples were taken from three locations in each pulse-labeled plot at 3 h and 10 h after the start of the pulse-labeling, as well as 11 month later (i.e. August 2006) at
BGD
4, 1437–1460, 2007 Microbial communities and C translocation under elevated CO2 K. Denef et al. Title Page Abstract Introduction Conclusions References Tables Figures ◭ ◮ ◭ ◮ Back CloseFull Screen / Esc
Printer-friendly Version Interactive Discussion
0–7.5 cm depth. Soil samples were also taken prior to the pulse-labeling (control sam-ples). For the 3 h sampling time, the chambers were temporarily removed and, after soil sampling, re-installed for a second period of pulse-labeling. The three samples were mixed to one composite sample per plot. All samples were immediately stored on dry ice and transported to the laboratory. Subsamples used for PLFA-extraction were 5
stored at –80◦C. Prior to PLFA-extraction, the samples were thawed and sieved through a 2 mm sieve to remove all visible roots, macro fauna and fresh litter since plants contain large concentrations of the fungal biomarker PLFA “linoleic acid” (18:2w6,9c) (Zelles, 1997). The roots of each sample as well as 2 mm sieved soil subsamples were ball-milled to a fine powder and analyzed for total C and δ13C analysis using an El-10
emental Analyzer (ANCA-SL, PDZ Europa, UK) connected to an Isotope Ratio Mass Spectrometer (Model 20-20, Sercon, UK) (EA-IRMS).
2.3 Phospholipid fatty acid extraction and quantification
The extraction and derivatization of PLFAs for compound-specific δ13C analysis was adapted from Bossio and Scow (1995). Briefly, 6 g soil samples were extracted us-15
ing chloroform/methanol/phosphate-buffer at a 1:2:1 ratio. Total lipids, retrieved in the chloroform phase, were partitioned on silica gel columns by sequential elution with chloroform, acetone, and methanol. The polar lipid fraction, eluting with methanol, was then subjected to mild alkaline transesterification (using methanolic KOH) to form fatty acid methyl esters (FAMEs) which were subsequently analyzed by capil-20
lary gas chromatography-combustion-isotope ratio mass spectrometry (GC-C-IRMS) (GC-C/TC DeltaPLUSXP Thermo Scientific) via a GC/C III interface. All samples were run in splitless mode and at an injector temperature of 250◦C, using a CP-SIL88 col-umn (100 m×0.25 mm i.d. ×0.2 µm film thickness; Varian Inc.) with a He flow rate of 1 ml min−1. The oven temperature was programmed at 75◦C for 2 min, followed by a 25
ramp at 5◦C min−1to 180◦C with a 20 min hold, and a final ramp at 2◦C min−1to 225◦C with a 20 min hold.
Prior to GC-C-IRMS analysis, a mixture of two internal standards (12:0 and 19:0) 1443
BGD
4, 1437–1460, 2007 Microbial communities and C translocation under elevated CO2 K. Denef et al. Title Page Abstract Introduction Conclusions References Tables Figures ◭ ◮ ◭ ◮ Back CloseFull Screen / Esc
Printer-friendly Version Interactive Discussion
was added to the FAME extract. Individual fatty acids were identified based on relative retention times vs. the two internal standards and cross-referenced with several stan-dards: a mixture of 37 FAMEs (37 Component FAME Mix, # 47885, Supelco Inc.), a mixture of 24 bacterial FAMEs (BAME mix, # 47080, Supelco Inc.) and several indi-vidual FAMEs (Larodan Inc.). On average, 25 PLFA peaks were detected and quan-5
tified, but only 16 were selected for 13C analysis because of their use as biomarker fatty acids for different microbial communities (Zelles, 1997). The biomarker PLFAs analyzed within this dataset included: 18:1ω9c and 18:2ω6,9c (indicative of sapro-trophic fungi), 16:1ω5 (indicative of arbuscular mycorrhizal fungi), i14:0, i15:0, a15:0, i16:0, i17:0, a17:0 (indicative of gram-positive bacteria), cy17:0, cy19:0, 16:1ω7c and 10
18:1ω7c (indicative of gram-negative bacteria) and 10Me PLFAs (indicative of actino-mycetes) (cf. Fierer et al., 2003; Chung et al., 2007). These PLFAs comprised approx-imately 90% of the total PLFA-C concentration. We determined the ratios of the peak area of each individual PLFA to that of 16:0, a universal PLFA occurring in the mem-branes of all organisms. PLFA ratios less than 0.02 were excluded from the data set 15
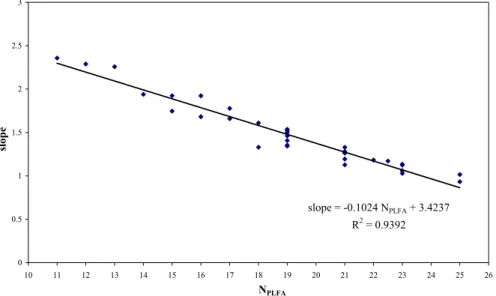
(cf. Drijber et al., 2000). The C concentrations of the individual biomarker PLFAs in the soil extracts were quantified using the quantitative “37 Component FAME Mix” which was run in a dilution series. For each individual standard FAME, a linear regression through the origin was performed between the chromatographic peak areas and known concentrations (ranging from 5 to 150 ng µl−1). For each linear regression, a unique
20
slope was obtained for each individual standard FAME, which decreased with increas-ing number of C atoms. The different slopes were plotted as a function of the number of C atoms of the PLFAs which gave a negative correlation with R2=0.94 (Fig. 1). Using this correlation, the C concentration of each of the individual PLFAs in the soil extract could be quantified as follows:
25
[PLFA-C] = PA
slope (1)
with [PLFA-C] = the C concentration of each PLFA (mmol PLFA-C l−1), PA = the chro-matographic peak area (Vs) of the individual PLFA, and slope = the slope of the linear
BGD
4, 1437–1460, 2007 Microbial communities and C translocation under elevated CO2 K. Denef et al. Title Page Abstract Introduction Conclusions References Tables Figures ◭ ◮ ◭ ◮ Back CloseFull Screen / Esc
Printer-friendly Version Interactive Discussion
regression through the origin between the peak areas and concentrations of the indi-vidual PLFA. Quantification of chromatographic PLFA peak areas through GC-C-IRMS has also been done by others, but only by using one or two quantitative FAME stan-dards, in most cases 12:0, 13:0 or 19:0 (e.g. Bouillon et al., 2004; Williams et al., 2006). Our quantitative analysis shows that PLFA concentrations could be greatly over- or un-5
derestimated when working with only one or two standards.
Finally, PLFA-C concentrations were calculated as relative proportions of the total PLFA-C (Mc) in order to correct for peak area changes due to reduced combustion efficiency with time.
Mci = [PLFA-C]i
P [PLFA-C]i100 (2)
10
2.4 Carbon-13 phospholipid fatty acid analysis
The δ13C values of the individual FAMEs obtained from the GC-C-IRMS were corrected for the addition of the methyl group during transesterification by simple mass balance:
δ13CPLFA= h (NPLFA+ 1) δ 13 CFAME− δ 13 CMeOH i NPLFA (3)
where NPLFA refers to the number of C atoms of the PLFA component, δ 13
CFAME is
15
the δ13C value of the FAME after transesterification, and δ13CMeOH is the δ13C value of the methanol used for transesterification (–36.7±0.4‰ vs. Pee Dee Belemnite by EA-IRMS).
Carbon-13 enrichment (expressed as ∆δ13C) was calculated by subtracting the pre-labeling natural abundance PLFA δ13C values from the post-labeling PLFA δ13C val-20
ues.
BGD
4, 1437–1460, 2007 Microbial communities and C translocation under elevated CO2 K. Denef et al. Title Page Abstract Introduction Conclusions References Tables Figures ◭ ◮ ◭ ◮ Back CloseFull Screen / Esc
Printer-friendly Version Interactive Discussion
The proportion of rhizosphere-derived PLFA-C (Fi) was calculated for each individual PLFA by using the following equation (cf. Williams et al., 2006):
Fi = Mciδl i− δui
δr− δui (4)
where Mci is the relative percentage of C in each PLFA to that of the total PLFA, δl i
represents the δ13C of the PLFA-C in the pulse-labeled plots, δui represents the δ
13
C 5
of the PLFA-C in the unlabeled plots, and δr represents the δ13C of the labeled roots (Table 1). The proportion (PF i) of rhizosphere-derived PLFA-C for each individual PLFA
to that of the total rhizosphere-derived PLFA-C was then calculated for each fatty acid using the following equation (cf. Williams et al., 2006):
PF i = Fi
P Fi100 (5)
10
All data represent means and standard deviations of duplicate extracted samples from one composite soil sample of each pulse-labeled site (E4 and K4). Each soil extract was injected 2 times for GC-C-IRMS analysis, and the average chromatographic peak area and δ13C value was used in all calculations.
3 Results and discussion
15
3.1 13C enrichment of root biomass and soil C
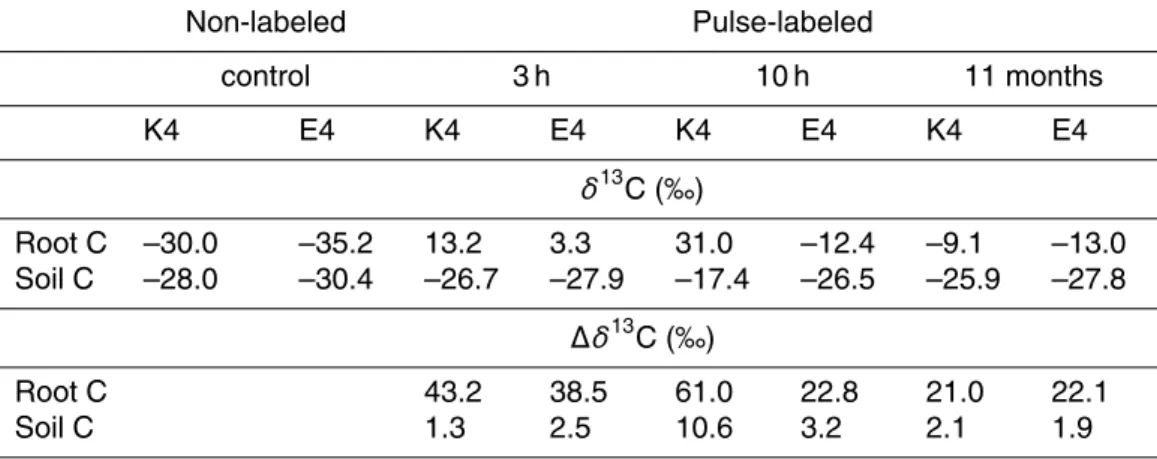
Both pulse-labeling events in plots K4 and E4 resulted in a rapid increase in the δ13C signature of the root biomass and soil C (Table 1). Significant δ13C enrichment was still visible in the root biomass as well as in the soil C 11 months post-labeling. Con-siderably lower δ13C signatures were observed in soil and root biomass C in plot E4 20
compared to K4 in pre- as well as post-labeling samples, which reflected the incorpo-ration of the depleted13C signature of the CO2used for the CO2fumigation in plot E4
BGD
4, 1437–1460, 2007 Microbial communities and C translocation under elevated CO2 K. Denef et al. Title Page Abstract Introduction Conclusions References Tables Figures ◭ ◮ ◭ ◮ Back CloseFull Screen / Esc
Printer-friendly Version Interactive Discussion
since 1998. Therefore, the data was presented as13C enrichment (∆δ13C) relative to pre-pulse labeling (control) samples to correct for these initial 13C differences. How-ever, even after this correction, δ13C enrichment of soil and root biomass was generally greater in the K4 compared to the E4 plot. Possible soil CO2 release due to physical
disturbance at the 3 h soil sampling could have resulted in a greater isotopic dilution 5
of the13CO2in the labeling chamber of plot E4 which had a more depleted δ13C sig-nature of soil gas CO2 (∼–27.8‰) compared to the K4 plot (∼–24.2‰) (K. Lenhart,
unpublished results). In addition, the greater leaf biomass collected from the pulse-labeled site in K4 (35.0 g) than in plot E4 (30.9 g) could have caused a greater13CO2 uptake by the K4 grasses and a greater13C transport into the rhizosphere soil of K4. 10
Because of these differences in13C incorporation into the rhizosphere of the two plots,
13
C-PLFA comparisons between K4 and E4 were done after expressing the data as proportions (PF i) of rhizosphere-derived PLFA-C of each individual fatty acid to that of
the total rhizosphere-derived PLFA-C.
3.2 Rhizosphere-C uptake and translocation within microbial communities 15
Soil samples taken 3 h after the start of the pulse-labeling showed only very limited
13
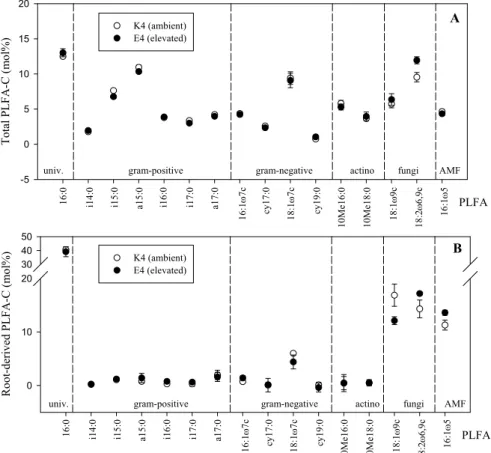
C enrichment in the different biomarker PLFAs in the K4 and E4 plots (Fig. 2). Af-ter 10 h, a very large incorporation of 13C was observed in the saprotrophic fungal PLFAs (18:1ω9, 18:2ω6,9) and arbuscular mycorrhizal fungal (AMF) PLFA (16:1ω5), while remaining low for the bacterial PLFAs. This suggested that both non-mycorrhizal 20
fungi as well as AMF are closely associated with the root system in grassland soils (Butler et al., 2003) and actively utilize and incorporate newly produced rhizosphere-C into their biomass. The distribution of newly produced rhizosphere-C among individual PLFAs (PF i) also drastically differed from the relative contributions of individual
PLFA-C to total PLFA-PLFA-C (Mci) (Fig. 3). This is consistent with the results of Williams et 25
al. (2006) suggesting that only a subset of the living soil microbial community, in our case the fungi, was primarily responsible for assimilating newly produced
BGD
4, 1437–1460, 2007 Microbial communities and C translocation under elevated CO2 K. Denef et al. Title Page Abstract Introduction Conclusions References Tables Figures ◭ ◮ ◭ ◮ Back CloseFull Screen / Esc
Printer-friendly Version Interactive Discussion
C, while other microbial communities were active in metabolizing other sources of C. The importance of fungi in assimilating fresh plant-derived C has been demonstrated in various ecosystems based on high amounts of13C incorporation from a variety of substrates into the saprotrophic fungal biomarker PLFA C18:2ω6,9 (Arao, 1999; Butler et al., 2003; Waldrop and Firestone, 2004; Lu et al., 2007). Recent in situ studies using 5
PLFA-based SIP by 13C-CO2 pulse-labeling have also reported a much faster
incor-poration of rhizosphere-C into fungal biomass (Treonis et al., 2004) as well as AMF biomass (Johnson et al., 2002; Olsson and Johnson, 2005) compared to bacterial biomass (Treonis et al., 2004).
The δ13C enrichment in the fungal PLFAs was still largely present after 11 months but 10
had decreased relative to the enrichment observed after 10 h (Fig. 2). This decrease in fungal PLFA-13C enrichment between 10 h and 11 months was probably caused by a dilution from unlabeled rhizosphere-C assimilation during continued photosynthesis in the period following the pulse-labeling. Interestingly, 11 months after pulse-labeling, significant amounts of13C had been incorporated in the bacterial PLFAs at both plots. 15
These results are consistent with the results of Olsson and Johnson (2005) who found over a time period of 32 days a decrease in the13C enrichment of AMF PLFA 16:1ω5, extracted from roots, and a concomitant increase in13C enrichment of bacterial PLFAs extracted from soil. Our data indicates that both saprotrophic and mycorrhizal fungi play a major role in the C flux from roots into soil microbial biomass. It can be pos-20
tulated that the rapidly assimilated rhizosphere-C by fungi is over time retracted from degenerating fungal hyphae and becomes incorporated into bacterial biomass. More-over, the observed long-term retention of C in fungal biomass could be of importance to soil organic C sequestration in grassland ecosystems.
3.3 Elevated CO2effect on rhizosphere-C assimilating microbial communities 25
Fungal communities have been shown to be highly responsive to increases in rhizosphere-C supply. A study by Griffiths et al. (1999) showed an increase in fun-gal PLFA 18:2ω6,9 when amounts of synthetic root exudates added to soil were
BGD
4, 1437–1460, 2007 Microbial communities and C translocation under elevated CO2 K. Denef et al. Title Page Abstract Introduction Conclusions References Tables Figures ◭ ◮ ◭ ◮ Back CloseFull Screen / Esc
Printer-friendly Version Interactive Discussion
creased. Along with the results of this study which indicate that fungi are most actively utilizing rhizodeposits in the GiFACE grasslands (Fig. 2), it can be expected that fun-gal communities are most sensitive in their activity to any responses of plant-C inputs likely to occur under rising atmospheric CO2concentrations (Rogers et al., 1994). The
total mol% distributions of PLFA-C (Mci) were similar among elevated and ambient 5
CO2 treatments with the sole exception of a greater proportion of PLFA-C present in
the fungal 18:2ω6,9 under elevated CO2(Fig. 3). Stimulated saprotrophic fungal and
AMF activities under elevated CO2 have been reported by others (Rillig et al., 1999; Klironomos et al., 1996; Zak et al., 2000; Treseder, 2004) and have been attributed to the greater substrate use efficiency of fungi in N-limited ecosystems. Receiving 10
only 40 kg N ha−1 yr−1, the grassland sites at GiFACE are also considered N-limited.
However, other studies were unable to detect changes in microbial biomass (Allen et al., 2000; Kandeler et al., 2006) nor shifts between bacterial and fungal communities under elevated CO2 (Zak et al., 1996; Rønn et al., 2002; Niklaus et al. 2003; Ebers-berger et al., 2004). Several studies have even showed a strong response of bacteria 15
(Sonnemann and Wolters, 2005) and an enrichment of gram-negative bacteria in par-ticular under elevated CO2(Montealegre et al., 2002; Drissner et al., 2007), while the fungal biomass did not change. Until now, in situ microbial community structural analy-ses in FACE studies have been limited to total PLFA-C distribution examinations which do not distinguish between the metabolically-active versus inactive rhizosphere micro-20
bial communities. The advantage of a pulse-labeling approach in combination with
13
C-PLFA analysis is the additional information obtained on the response of those mi-crobial communities that are actively assimilating newly produced rhizosphere-C. The response to elevated CO2 of metabolically-active microbial communities may be
un-detectable through conventional total PLFA-C analyses due to the large background 25
concentration of the mostly inactive total soil microbial community, but is of impor-tance to better understand C cycling in terrestrial ecosystems under increasing CO2
concentrations. Our 13C-PLFA results indicated a greater proportion of root-derived PLFA-C under elevated compared to ambient CO2in the saprotrophic fungal 18:2ω6,9
BGD
4, 1437–1460, 2007 Microbial communities and C translocation under elevated CO2 K. Denef et al. Title Page Abstract Introduction Conclusions References Tables Figures ◭ ◮ ◭ ◮ Back CloseFull Screen / Esc
Printer-friendly Version Interactive Discussion
and AMF 16:1ω5 PLFAs, while the opposite was observed for the saprotrophic fungal 18:1ω9 PLFA (Fig. 3). Root-derived C proportions in bacterial PLFAs remained unaf-fected by elevated CO2. PLFAs 18:1ω9 and 18:2ω6,9 are generally used as biomarker
PLFA indicators for the presence of saprotrophic fungi (Phillips et al., 2002; Rønn et al., 2002; Chung et al., 2007; Drissner et al., 2007). However, PLFA analysis does 5
not allow for specific detection of individual species of the microbial communities. It is possible that different fungal species are differently affected by the CO2 treatments.
Stable isotope labeling techniques in combination with molecular tools such as RNA-SIP (Griffiths et al., 2004; Rangel-Castro et al., 2005; Lu et al., 2006) could provide a better resolution of the individual active microbial communities at the species-level and 10
should be explored in FACE research in order to better understand shifts in microbial species composition due to elevated CO2.
Several studies have analyzed the microbial community composition under elevated CO2 using other experimental methods than the PLFA-based SIP approach used in this study, such as extracellular enzyme activity assays (Moscatelli et al., 2005; Chung 15
et al., 2006), PCR-DGGE analyses (Chung et al., 2006), substrate-induced respiration measurements, and 16S rRNA clone libraries (Lipson et al., 2005). Corresponding to our findings, most of these studies also suggested stimulated fungal pathways under increased atmospheric CO2concentrations. This fungal stimulation could be beneficial
for ecosystem functioning as fungi are believed to play a positive role in soil structural 20
stabilization (Bossuyt et al., 2001; Rillig et al., 2002), C sequestration (Treseder and Allen, 2000; Bailey et al., 2002) and N immobilization through hyphal translocation (Beare, 1997; Frey et al., 2000).
4 Conclusions
Using PLFA-SIP, the present study showed a rapid transfer of newly produced 25
rhizospheC to fungal biomass (noticeable in less than 10 h) and a significant re-tention of rhizosphere-C in fungal biomass after 11 months in the surface 0–7.5 cm
BGD
4, 1437–1460, 2007 Microbial communities and C translocation under elevated CO2 K. Denef et al. Title Page Abstract Introduction Conclusions References Tables Figures ◭ ◮ ◭ ◮ Back CloseFull Screen / Esc
Printer-friendly Version Interactive Discussion
soil layer of grassland sites at GiFACE. The much slower incorporation of rhizosphere-C into bacterial PLFAs, but their significant 13C enrichment after 11 months further suggests a potential fungi-mediated transfer of rhizosphere-C to the bacteria from de-generating fungal hyphae. This in situ pulse-labeling experiment demonstrated for the first time in long-term FACE experimental grasslands a stimulated fungal rhizosphere-5
C metabolism under elevated CO2 through PLFA-based SIP analyses. Elevated CO2
caused an increase in the relative abundance of root-derived PLFA-C in saprotrophic fungal 18:2ω6,9 and AMF 16:1ω5, but a decrease in saprotrophic fungal 18:1ω9, suggesting enhanced rhizodeposit-C assimilation by only selected fungal communi-ties under elevated CO2. Further pulse-labeling studies in combination with microbial 10
biomarker SIP analyses in different long-term FACE experiments are required to test if the results observed in this experiment are reproducible for other ecosystems with dif-ferent plant species and soil types, and to investigate if these microbial changes persist over time.
Acknowledgements. We thank B. Leroy (UGent), J. Six and A. Kong (UC Davis) for their
con-15
tribution to a successful setup of the PLFA-extraction method in our own laboratory. E. Gillis is greatly acknowledged for help with the PLFA-extractions. K. Denef acknowledges a post-doctoral fellowship from the Belgian Research Foundation – Flanders.
References
Allen, A. S., Andrews, J. A., Finzi, A. C., Matamala, R., Richter, D. D., and Schlesinger, W.
20
H.: Effects of free-air CO2 enrichment (FACE) on belowground processes in a Pinus taeda
forest, Ecol. Appl., 10, 437–448, 2000.
Alley, R., Berntsen, T., Bindoff, N. L., Chen, Z., Chidthaisong, A., Friedlingstein, P., Gregory, J., Hegerl, G., Heimann, M., Hewitson, B., Hoskins, B., Joos, F., Jouzel, J., Kattsov, V., Lohmann, U., Manning, M., Matsuno, T., Molina, M., Nicholls, N., Overpeck, J., Qin, D.,
25
Raga, G., Ramaswamy, V., Ren, J., Rusticucci, M., Solomon, S., Somerville, R., Stocker, T. F., Stott, P., Stouffer, R. J., Whetton, P., Wood, R. A., and Wratt, D.: Climate change 2007:
BGD
4, 1437–1460, 2007 Microbial communities and C translocation under elevated CO2 K. Denef et al. Title Page Abstract Introduction Conclusions References Tables Figures ◭ ◮ ◭ ◮ Back CloseFull Screen / Esc
Printer-friendly Version Interactive Discussion
The Physical Science Basis, Contribution of working group I to the fourth assessment report of the Intergovernmental Panel on Climate Change, Paris, 2007.
Arao, T.: In situ detection of changes in soil bacterial and fungal activities by measuring 13C incorporation into soil phospholipid fatty acids from 13C acetate, Soil Biol. Biochem., 31, 1015–1020, 1999.
5
Beare, M. H.: Fungal and bacterial pathways of organic matter decomposition and nitrogen mineralization in arable soils, in: Soil Ecology in Sustainable Agricultural Systems, edited by: Brussaard, L. and Ferrera-Cerrato, R., Lewis Publishers, Boca Raton, FL, 37–70, 1997. Bailey, V. L., Smith, J. L., and Bolton, H.: Fungal-to-bacterial ratios in soils investigated for
enhanced C sequestration, Soil Biol. Biochem., 34, 997–1007, 2002.
10
Billings, S. A. and Ziegler, S. E.: Linking microbial activity and soil organic matter transforma-tions in forest soils under elevated CO2, Global Change Biol., 11, 203–212, 2005.
Boschker, H. T. S., Nold, S. C., Wellsbury, P., Bos, D., de Graaf, W., Pel, R., Parkes, R. J., and Cappenberg, T. E.: Direct linking of microbial populations to specific biogeochemical processes by C-13-labelling of biomarkers, Nature, 392, 801–805, 1998.
15
Bossio, D. A. and Scow, K. M.: Impact of Carbon and Flooding on the Metabolic Diversity of Microbial Communities in Soils, Appl. Environ. Microbiol., 61, 4043–4050, 1995.
Bossuyt, H., Denef, K., Six, J., Frey, S. D., Merckx, R., and Paustian, K.: Influence of microbial populations and residue quality on aggregate stability, Appl. Soil Ecol. 16, 195–208, 2001. Bouillon, S., Moens, T., Koedam, N., Dahdouh-Guebas, F., Baeyens, W., and Dehairs, F.:
Vari-20
ability in the origin of carbon substrates for bacterial communities in mangrove sediments, FEMS Microbiol. Ecol., 49, 171–179, 2004.
Butler, J. L., Williams, M. A., Bottomley P. J., and Myrold D. D.: Microbial community dynamics associated with rhizosphere carbon flow, Appl. Environ. Mircobiol., 69, 6793–6800, 2003. Chung, H., Zak, D. R., and Lilleskov, E. A.: Fungal community composition and metabolism
25
under elevated CO2and O3, Oecologia, 147, 143–154, 2006.
Chung, H., Zak, D. R., Reich, P. B., and Ellsworth, D. S.: Plant species richness, elevated CO2, and atmospheric nitrogen deposition alter soil microbial community composition and function, Global Change Biol., 13, 1–10, 2007.
Cotrufo, M. F. and Gorissen, A.: Elevated CO2 enhances below-ground C allocation in three
30
perennial grass species at different levels of N availability, New Phytol., 137, 421–431, 1997. Cotrufo, M. F., Ineson, P., and Rowland, A. P.: Decomposition of tree leaf litters grown under
elevated CO2: effect of litter quality, Plant Soil, 163, 121–130, 1994.
BGD
4, 1437–1460, 2007 Microbial communities and C translocation under elevated CO2 K. Denef et al. Title Page Abstract Introduction Conclusions References Tables Figures ◭ ◮ ◭ ◮ Back CloseFull Screen / Esc
Printer-friendly Version Interactive Discussion
Curtis, P. S. and Wang, X.: A meta-analysis of elevated CO2effects on woody plant mass, form and physiology, Oecologia, 113, 299–313, 1998.
DeLucia, E. H., Hamilton, J. G., Naidu, S. L., Thomas, R. B., Andrews, J. A., Finzi, A., Lavine, M., Matamala, R., Mohan, J. E., Hendrey, G. R., and Schlesinger, W. H.: Net primary pro-duction of a forest ecosystem with experimental CO2enrichment, Science, 289, 1177–1179,
5
1999.
Drijber, R. A., Doran, J. W., Parkhurst, A. M., and Lyon, D. J.: Changes in soil microbial com-munity structure with tillage under long-term wheat-fallow management, Soil Biol. Biochem., 32, 1419–1430, 2000.
Drissner, D., Blum, H., Tscherko, D., and Kandeler, E.: Nine years of enriched CO2 changes
10
the function and structural diversity of soil microorganisms in a grassland, Eur. J. Soil Sci., 58, 260–269, 2007.
Ebersberger, D., Wermbter, N., Niklaus, P. A., and Kandeler, E.: Effects of long term CO2
enrichment on microbial community structure in calcareous grassland, Plant Soil, 264, 313– 323, 2004.
15
Fierer, N., Schimel, J. P., and Holden, P. A.: Variations in microbial community composition through two soil depth profiles, Soil Biol. Biochem., 35, 167–176, 2003.
Frankland, J. C., Dighton, J., and Boddy, L.: Methods for studying fungi in soil and forest litter, Meth. Microbiol., 22, 343–404, 1990.
Frey, S. D., Elliott, E. T., Paustian, K., and Peterson, G. A.: Fungal translocation as a mechanism
20
for soil nitrogen inputs to surface residue decomposition in a no-tillage agroecosystem, Soil Biol. Biochem., 32, 689–698, 2000.
Ghannoum, O., Von Caemmerer, S., Ziska, L. H., and Conroy, J. P.: The growth response of C4 plants to rising atmospheric CO2partial pressure: a reassessment, Plant Cell Environ., 23, 931–942, 2000.
25
Griffiths, B. S., Ritz, K., Ebblewhite, N., and Dobson, G.: Soil microbial community structure: effects of substrate loading rates, Soil Biol. Biochem., 30, 369–378, 1999.
Griffiths, R. I., Manefield, M., Bailey, M. J., Whitely, A. S., Ostle, N., McNamara, N., and O’Donnell, A. G.: 13CO2 pulse labeling of plants in tandem with stable isotope probing: methodological considerations for examining microbial function in the rhizosphere, J.
Micro-30
biol. Meth., 58, 119–129, 2004.
Hu, S., Chapin, F. S., Firestone, M. K., Field, C. B., and Chiariello, N. R.: Nitrogen limitation of microbial decomposition in a grassland under elevated CO2, Nature, 409, 188–191, 2001.
BGD
4, 1437–1460, 2007 Microbial communities and C translocation under elevated CO2 K. Denef et al. Title Page Abstract Introduction Conclusions References Tables Figures ◭ ◮ ◭ ◮ Back CloseFull Screen / Esc
Printer-friendly Version Interactive Discussion
J ¨ager, H. J., Schmidt, S. W., Kammann, C., Gr ¨unhage, L., M ¨uller, C., and Hanewald, K.: The University of Giessen Free-Air Carbon Dioxide Enrichment Study: Description of the Experi-mental Site and of a New Enrichment System, J. Appl. Bot., 77, 117–127, 2003.
Johnson, D., Leake, J. R., and Read, D. J.: Transfer to recent photosynthate into mycorrhizal mycelium of an upland grassland: short-term respiratory losses and accumulation of14C,
5
Soil Biol. Biochem., 34, 1521–1524, 2002.
Jongen, M., Jones, M. B., Hebeisen, T., Blum, H., and Hendrey, G.: The effects of elevated CO2 concentrations on the root growth of Lolium perenne and Trifolium repens grown in a FACE system, Global Change Biol., 1, 361–371, 1995.
Kandeler, E., Mosier, A. R., Morgan, J. A., Milchunas, D. G., King, J. Y., Rudolph, S., and
10
Tscherko, D.: Response of soil microbial biomass and enzyme activities to the transient elevation of carbon dioxide in a semi-arid-grassland, Soil Biol. Biochem., 38, 2448–2460, 2006.
Klironomos, J. N., Rillig, M. C., and Allen, M. F.: Below-ground microbial and microfaunal responses to Artemisia tridentata grown under elevated atmospheric CO2, Funct. Ecol., 10,
15
527–534, 1996.
Lipson, D. A., Wilson, R. F., and Oechel, W. C.: Effects of elevated atmospheric CO2 on soil
microbial biomass, activity and diversity in a chaparral ecosystem, Appl. Environ. Mircobiol., 71, 8573–8580, 2005.
Lu, Y., Rosencrantz, D., Liesack, W., and Conrad, R.: Structure and activity of bacterial
com-20
munity inhabiting rice roots and the rhizosphere, Environ. Microbiol., 8, 1351–1360, 2006. Lu, Y., Abraham, W.-R., and Conrad, R.: Spatial variation of active microbiota in the rice
rhizo-sphere revealed by in situ stable isotope probing of phospholipid fatty acids, Environ. Micro-biol., 9, 474–481, 2007.
McMahon, S. K., Williams, M. A. Bottomley, P. J., and Myrold, D. D.: Dynamics of microbial
25
communities during decomposition of carbon-13 labeled ryegrass fractions in soil, Soil Sci. Soc. Am. J., 69, 1238–1247, 2005.
Montealegre, C. M., van Kessel, C., Russelle, M. P., and Sadowsky, M. J.: Changes in microbial activity and composition in a pasture ecosystem exposed to elevated atmospheric carbon dioxide, Plant Soil, 243, 197–207, 2002.
30
Moscatelli, M. C., Lagomarsino, A., de Angelis, P., and Grego, S.: Seasonality of soil biological properties in a polar plantation growing under elevated atmospheric CO2, Appl. Soil Ecol., 30, 162–173, 2005.
BGD
4, 1437–1460, 2007 Microbial communities and C translocation under elevated CO2 K. Denef et al. Title Page Abstract Introduction Conclusions References Tables Figures ◭ ◮ ◭ ◮ Back CloseFull Screen / Esc
Printer-friendly Version Interactive Discussion
Niklaus, P. A., Alphei, J., Ebersberger, D., Kampichler, C., Kandeler, E., and Tscherko, D.: Six years of in situ CO2enrichment evoke changes in soil structure and soil biota of nutrient-poor grassland, Global Change Biol., 9, 585–600, 2003.
Olsson, P. A. and Johnson, N. C.: Tracking carbon from the atmosphere to the rhizosphere, Ecol. Lett., 8, 1264–1270, 2005.
5
Phillips, R. L., Zak, D. R., Holmes, W. E., and White, D. C.: Microbial community composition and function beneath temperate trees exposed to elevated atmospheric carbon dioxide and ozone, Oecologia, 131, 236–244, 2002.
Prosser, J. I., Rangel-Castro, J. I., and Killham, K.: Studying plant-microbe interactions using stable isotope technologies, Curr. Opin. Biotechnol., 17, 98–102, 2006.
10
Rangel-Castro, J. I., Killham, K., Ostle, N., Nicol, G. W., Anderson, I. C., Scrimgeour, C. M., Ineson, P., Meharg, A., and Prosser, J. I.: Stable isotope probing analysis of the influence of liming on root exudates utilization by soil microorganisms, Environ. Microbiol., 7, 828–838, 2005.
Rillig, M. C., Field, C. B., and Allen, F. A.: Soil biota responses to long-term atmospheric CO2
15
enrichment in two California annual grasslands, Oecologia, 119, 572–577, 1999.
Rillig, M. C., Wright, S. F., and Eviner, V. T.: The role of arbuscular mycorrhizal fungi and glomalin in soil aggregation: comparing effects of five plant species, Plant Soil, 238, 325– 333, 2002.
Rogers, H. H., Runion, G. B., and Krupa, S. V.: Plant responses to atmospheric CO2enrichment
20
with emphasis on roots and the rhizosphere, Environ. Pollut., 83, 155–189, 1994.
Rønn, R., Gavito, M., Larsen, J., Jakobsen, I., Frederiksen, H., and Christensen, S.: Response of free-living soil protozoa and microorganisms to elevated atmospheric CO2and presence of mycorrhiza, Soil Biol. Biochem., 34, 923–932, 2002.
Sadowsky, M. J. and Schortemeyer, M.: Soil microbial response to increased concentrations of
25
atmospheric CO2, Global Change Biol., 3, 217–224, 1997.
Schortemeyer, M., Hartwig, U. A., Hendrey, G. R., and Sadowsky, M. J.: Microbial community changes in the rhizosphere of white clover and perennial ryegrass exposed to free air carbon dioxide enrichment (FACE), Soil Biol. Biochem., 28, 1717–1724, 1996.
Sonnemann, I. and Wolters, V.: The microfood web of grassland soils responds to a moderate
30
increase in atmospheric CO2, Global Change Biol., 11, 1148–1155, 2005.
Treonis, A. M., Ostle, N. J., Stott, A. W., Primrose, R., Graystone, S. J., and Ineson, P.: Identifi-cation of groups of metabolically-active rhizosphere microorganisms by stable isotope
BGD
4, 1437–1460, 2007 Microbial communities and C translocation under elevated CO2 K. Denef et al. Title Page Abstract Introduction Conclusions References Tables Figures ◭ ◮ ◭ ◮ Back CloseFull Screen / Esc
Printer-friendly Version Interactive Discussion
ing of PLFAs, Soil Biol. Biochem., 36, 533–537, 2004.
Treseder, K. K.: A meta-analysis of mycorrhizal responses to nitrogen, phosphorus, and atmo-spheric CO2in field studies, New Phytol., 164, 347–355, 2004.
Treseder, K. K. and Allen, M. F.: Mycorrhizal fungi have a potential role in soil carbon storage under elevated CO2and nitrogen deposition. New Phytol. 147, 189–200, 2000.
5
Vestal, J. R. and White, D. C.: Lipid analysis in microbial ecology, BioScience, 39, 535–541, 1989.
Waldrop, M. P. and Firestone, M. K.: Microbial community utilization of recalcitrant and simple carbon compounds: impact of oak-woodland plant communities, Oecologia, 138, 275–284, 2004.
10
Wardle, D. A., Brown, V. K, Behan-Pelletier, V., St. John, M., Wojtowicz, T., Bardgett, R. D., Brown, G. G., Ineson, P., Lavelle, P., van der Putten, W. H., Anderson, J. M., Brussaard, L., Hunt, W. H., Paul, E. A., and Wall, D. H.: Vulnerability to global change of ecosystem goods and services driven by soil biota, In: Wall D. H. (Ed.), Sustaining Biodiversity and Ecosystem Services in Soils and Sediments, Island Press, Washington DC, 101–136, 2004.
15
Williams, M. A., Myrold, D. D., and Bottomley, P. J.: Carbon flow from13C-labeled straw and root residues into the phospholipid fatty acid of a soil microbial community under field conditions, Soil Biol. Biochem., 38, 759–768, 2006.
Zak, D. R., Pregitzer, K. S., Curtis, P. S., and Holmes, W. E.: Elevated atmospheric CO2and feedback between carbon and nitrogen cycles, Plant Soil, 151, 105–117, 1993.
20
Zak, D. R., Ringelberg, D. B., Pregitzer, K. S., Randlett, D. L., White, D. C., and Curtis, P. S.: Soil microbial communities beneath Populus grandidentata grown under elevated atmospheric CO2, Ecol. Appl., 6, 257–262, 1996.
Zak, D. R., Pregitzer, K. S., Curtis, P. S., and Holmes, W. E.: Atmospheric CO2and the compo-sition and function of soil microbial communities, Ecol. Appl., 10, 47–59, 2000.
25
Zelles, L.: Phospholipid fatty acid profiles in selected members of soil microbial communities, Chemosphere, 35, 275–294, 1997.
BGD
4, 1437–1460, 2007 Microbial communities and C translocation under elevated CO2 K. Denef et al. Title Page Abstract Introduction Conclusions References Tables Figures ◭ ◮ ◭ ◮ Back CloseFull Screen / Esc
Printer-friendly Version Interactive Discussion
Table 1. δ13C values and δ13C enrichment (∆δ13C, i.e. net increase relative to natural abun-dance δ13C values of soil and roots from non-labeled control plots) for soil and root C. δ13C measurements were done on composite 0–7.5 cm soil samples from 3 sampling points per pulse-labeled plot. Non-labeled Pulse-labeled control 3 h 10 h 11 months K4 E4 K4 E4 K4 E4 K4 E4 δ13C (‰) Root C –30.0 –35.2 13.2 3.3 31.0 –12.4 –9.1 –13.0 Soil C –28.0 –30.4 –26.7 –27.9 –17.4 –26.5 –25.9 –27.8 ∆δ13C (‰) Root C 43.2 38.5 61.0 22.8 21.0 22.1 Soil C 1.3 2.5 10.6 3.2 2.1 1.9 1457
BGD
4, 1437–1460, 2007 Microbial communities and C translocation under elevated CO2 K. Denef et al. Title Page Abstract Introduction Conclusions References Tables Figures ◭ ◮ ◭ ◮ Back CloseFull Screen / Esc
Printer-friendly Version Interactive Discussion slope = -0.1024 NPLFA + 3.4237 R2 = 0.9392 0 0.5 1 1.5 2 2.5 3 10 11 12 13 14 15 16 17 18 19 20 21 22 23 24 25 26 NPLFA sl op e
Fig. 1. The relationship between the number of C atoms of PLFA components (NPLFA) and their corresponding slope, obtained from linear regressions through the origin between the chro-matographic peak areas and concentrations of individual standard FAMEs of the quantitative “37 Component FAME Mix” (# 47885, Supelco Inc.).
BGD
4, 1437–1460, 2007 Microbial communities and C translocation under elevated CO2 K. Denef et al. Title Page Abstract Introduction Conclusions References Tables Figures ◭ ◮ ◭ ◮ Back CloseFull Screen / Esc
Printer-friendly Version Interactive Discussion A PLFA ∆ δ 13C (% 0 ) -5 0 5 10 15 20 25 30 3 h 10 h 11 months B PLFA -5 0 5 10 15 20 25 30 3 h 10 h 11 months 16: 0 i17: 0 a17: 0 16: 1ω 7c cy 17: 0 18: 1ω 7c cy 19: 0 10M e16: 0 10M e18: 0 i14: 0 i15: 0 a15: 0 i16: 0 16: 0 i17: 0 a17: 0 16: 1ω 7c cy 17: 0 18: 1ω 7c cy 19: 0 18: 1ω 9c 18: 2ω 6,9c 16: 1ω 5 10M e16: 0 10M e18: 0 i14: 0 i15: 0 a15: 0 i16: 0 18: 1ω 9c 18: 2ω 6, 9c 16: 1ω 5
univ. gram-positive gram-negative actino fungi AMF
univ. gram-positive gram-negative actino fungi AMF
∆ δ 13 C ( % 0 )
Fig. 2. Net increase of δ13C values of individual biomarker PLFAs extracted from pulse-labeled 0–7.5 cm soil samples from plots K4 (A) and E4 (B) sampled 3 h, 10 h and 11 months post-labeling, in excess of those in the non-labeled control plots. Univ. = universal biomarker PLFA; gram-positive = gram-positive bacteria; gram-negative = gram-negative bacteria; actino = actinomycetes; AMF = arbuscular mycorrhizal fungi.
BGD
4, 1437–1460, 2007 Microbial communities and C translocation under elevated CO2 K. Denef et al. Title Page Abstract Introduction Conclusions References Tables Figures ◭ ◮ ◭ ◮ Back CloseFull Screen / Esc
Printer-friendly Version Interactive Discussion A PLFA -5 0 5 10 15 20 K4 (ambient) E4 (elevated) B PLFA 0 10 20 30 40 50 16: 0 i17: 0 a17: 0 16: 1ω 7c cy 17: 0 18: 1ω 7c cy 19: 0 10M e16: 0 10M e18: 0 i14: 0 i15: 0 a15: 0 i16: 0 18: 1ω 9c 18: 2ω 6,9c 16 :1 ω 5 16: 0 i17: 0 a17: 0 16: 1ω 7c cy 17: 0 18: 1ω 7c cy 19: 0 1 0 M e16: 0 1 0 M e18: 0 i14: 0 i15: 0 a15: 0 i16: 0 18: 1ω 9c 18 :2 ω 6,9 c 16: 1ω 5
univ. gram-positive gram-negative actino fungi AMF
univ. gram-positive gram-negative actino fungi AMF
K4 (ambient) E4 (elevated) T ot al P L F A -C ( m o l%) Ro ot -de ri ve d P L F A -C (m ol %)
Fig. 3. The proportional distribution of total PLFA-C (Mci) (A) and root-derived PLFA-C (PF i) (B) among individual biomarker PLFAs extracted from pulse-labeled 0–7.5 cm soil samples from plots K4 and E4 sampled 10 h post-labeling. Univ. = universal biomarker PLFA; gram-positive = gram-positive bacteria; gram-negative = gram-negative bacteria; actino = actinomycetes; AMF = arbuscular mycorrhizal fungi.