HAL Id: hal-02325314
https://hal.archives-ouvertes.fr/hal-02325314
Submitted on 25 Nov 2020HAL is a multi-disciplinary open access archive for the deposit and dissemination of sci-entific research documents, whether they are pub-lished or not. The documents may come from teaching and research institutions in France or abroad, or from public or private research centers.
L’archive ouverte pluridisciplinaire HAL, est destinée au dépôt et à la diffusion de documents scientifiques de niveau recherche, publiés ou non, émanant des établissements d’enseignement et de recherche français ou étrangers, des laboratoires publics ou privés.
On spreading modes and magma supply at slow and
ultraslow mid-ocean ridges
Mathilde Cannat, Daniel Sauter, Luc Lavier, Manon Bickert, Ekeabino
Momoh, Sylvie Leroy
To cite this version:
Mathilde Cannat, Daniel Sauter, Luc Lavier, Manon Bickert, Ekeabino Momoh, et al.. On spreading modes and magma supply at slow and ultraslow mid-ocean ridges. Earth and Planetary Science Letters, Elsevier, 2019, 519, pp.223-233. �10.1016/j.epsl.2019.05.012�. �hal-02325314�
ON SPREADING MODES AND MAGMA SUPPLY AT SLOW AND ULTRASLOW MID-OCEAN RIDGES
1
2
Mathilde Cannat1, Daniel Sauter2, Luc Lavier3, Manon Bickert1, Ekéabino Momoh1-4, Sylvie Leroy4
3
1 Marine Geosciences, Institut de Physique du Globe de Paris, UMR 7154 - CNRS, Université de Paris
4
2 Institut de Physique du Globe de Strasbourg, UMR 7516 - CNRS, Université de Strasbourg.
5
3 Department of Geological Sciences, Institute for Geophysics, Jackson School of Geosciences, The
6
University of Texas at Austin
7
4 Institut des Sciences de la Terre de Paris, UMR 7193 - CNRS, Sorbonne Université
8
9
ABSTRACT
10
The ultraslow eastern Southwest Indian Ridge (SWIR) offers an opportunity to study the effect of
11
magma supply on an ultraslow mid-ocean ridge starting from quasi-melt-free detachment-dominated
12
spreading, and transitioning to volcanic spreading as one nears prominent axial volcanos. Detachments
13
in the quasi-melt-free mode extend along-axis 60 to 95 km and have a lifetime of 0.6 to 1.5 myrs. They
14
cut into their predecessor's footwall with an opposite polarity, causing part of the footwall lithosphere
15
to experience further deformation, hydrothermal alteration, sparse magmatism and possibly thermal
16
rejuvenation, in a hanging wall position. The accretion of the oceanic lithosphere in this context
17
therefore occurs in two distinct stages over the lifetime of two successive detachment faults. We
18
examine the transition from this nearly amagmatic detachment-dominated mode to the more
19
common volcanic mode of spreading, showing that it occurs along-axis over distances ≤ 30 km. It
20
involves a significant thinning of the axial lithosphere and a gradual decrease of the amount of tectonic
21
displacement on faults, as the magmatic contribution to the divergence of the two plates increases.
22
We develop a conceptual model of this transition, in which magma plays a double role: it fills the space
23
between the diverging plates, thus reducing the need for displacement along faults, and it modifies
24
the thermal state and the rheology of the plate boundary, affecting its thickness and its tectonic
25
response to plate divergence. Based on a comparison of the ultraslow eastern SWIR, with the faster
26
spreading Mid-Atlantic Ridge, we show that the activation of the volcanic, or of the
detachment-27
dominated modes of spreading is connected with the volume of magma supplied per increment of
28
plate separation, over a range of axial lithosphere thickness, and therefore over a range of the M ratio
29
defined by (Buck et al., 2005) as the relative contribution of magma and faults to plate divergence (M
30
is smaller, for a given volume of melt per increment of plate separation, if the plate is thicker). We
31
therefore propose that M does not fully explain the variability in faulting styles observed at slow and
ultraslow ridges and propose that rheological changes induced by magma (melt itself is weak,
33
hydrothermally altered gabbro-peridotite mixtures are weak, and melt heat sustains more vigourous
34
hydrothermal circulation) also play a key role, resulting in contrasted potentials for strain localization,
35
footwall flexure on faults and the development of detachment faults.
36
37
Keywords: slow and ultraslow mid-ocean ridges, divergent plate boundaries, detachment faults, melt
38
supply, axial lithosphere, tectonic and magmatic seafloor spreading processes
39
40
INTRODUCTION
41
While all mid-ocean ridges are active volcanic chains, slow (<4 cm/yr) and ultraslow (<2 cm/yr)
42
spreading ridges are also rift zones, where normal faults accommodate part of the plate divergence,
43
interacting with magmatism to shape the newly formed oceanic lithosphere. These ridges are
44
segmented, and significant along-axis variations in melt supply accompany this segmentation, with
45
segment ends receiving less magma than the segments centers (Lin et al., 1990). At segment ends, and
46
in whole segments of melt-poor slow and ultraslow ridge regions, large offset normal faults, also called
47
detachment faults, accommodate a large part of the plate divergence (Cann et al., 1997; Cannat et al.,
48
2006; Escartín et al., 2008; Sauter et al., 2013). These detachments bring mantle-derived rocks up
49
through the axial lithosphere, and the resulting seafloor therefore has an ultramafic, non-magmatic
50
component (Cannat, 1993). By contrast, the centers of most slow and ultraslow spreading ridge
51
segments undergo plate divergence through a combination of magma injection and several moderate
52
offset normal faults distributed in the axial domain, and the seafloor exposes volcanic rocks (Smith and
53
Cann, 1999). In the detachment-dominated mode of spreading, specific hydrothermal reactions,
54
associated with the alteration of mantle peridotites, are favored, and feed original microbial
55
communities (Früh-Green et al., 2004). Modes of spreading at slow and ultraslow spreading ridges
56
therefore have a large impact not only on the composition of the oceanic lithosphere, but also on
57
chemical exchanges between the solid Earth and the Ocean, and on the diversity of seafloor biology.
58
Many questions remain about oceanic accretion in the detachment-dominated mode. What controls
59
the geometry and lifetime of detachments, and how do they root into the mantle? How do
60
hydrothermal and magmatic processes operate in this mode and what are their time and space
61
relations to detachment faulting? What is the architecture of the lithosphere that is accreted in the
62
hanging wall plate? Although it is often assumed to be better constrained, there is also a lot we do not
63
yet know about the volcanic spreading mode at slow and ultraslow ridges. While crustal architecture
64
in this mode is commonly proposed to be similar to the layered magmatic crust formed at fast ridges,
there is as yet limited direct evidence in support of this hypothesis, and at least one indication that it
66
might not be the case: while volcanic slow spreading ridge regions have a substantial magma supply,
67
they also have a much thicker (up to 7 km-thick at the Mid-Atlantic Ridge; Wolfe et al., 1995)
68
seismogenic lithosphere, compared with the shallow depth to the axial melt lens of faster ridges
69
(Detrick et al., 1987). Finally, while magma supply is identified as a main control on which of the two
70
spreading modes is activated at slow and ultraslow spreading ridges, and although this control has
71
been tested in numerical models (Buck et al., 2005; Olive et al., 2010; Püthe and Gerya, 2014; Tian and
72
Choi, 2017; Tucholke et al., 2008), there is no clear understanding as yet on how it operates in situ: by
73
what melt supply-related mechanism(s) does a slow spreading ridge switch from the volcanic to the
74
detachment-dominated mode of spreading?
75
We address several of these questions based on geological, geophysical and petrological data acquired
76
over the course of several cruises in the eastern region of the Southwest Indian Ridge (SWIR; spreading
77
rate of 14 mm/yr; Cannat et al., 2006), east of the Melville Fracture Zone. This 660 km-long ridge region
78
is a low magma supply end-member of the global mid-ocean ridge system (Cannat et al., 2008). It is
79
characterized by a pronounced focusing of the available melt to axial volcanos, separated by corridors
80
of nearly-amagmatic detachment-dominated spreading where the seafloor exposes almost only
81
ultramafic rocks (Cannat et al., 2006; Sauter et al., 2013). Volcanic areas show numerous and mostly
82
spreading-perpendicular scarps and hummocky volcanic ridges, and correspond to more negative
83
gravity anomalies, consistent with seismic crustal thicknesses up to 8 km (Minshull et al., 2006). Nearly
84
amagmatic spreading corridors have, by contrast, a smooth topography, more positive gravity
85
anomalies (Cannat et al., 2006), and a 2 to 5 km-thick seismic crustal layer that is interpreted as made
86
primarily of serpentinized and fractured mantle-derived rocks (Momoh et al., 2017). These rocks are
87
proposed to have been exhumed by successive axial detachment faults, each cutting into the footwall
88
of the previous fault, with an opposite polarity (Sauter et al.,2013). The eastern SWIR therefore offers
89
opportunities to study the links between magma supply and seafloor spreading modes starting from a
90
quasi melt-free regime, and transitioning to volcanic spreading as one nears the axial volcanos.
91
The formation of many distal continental divergent margins also involves tectonic extension with only
92
incipient magmatism (eg Peron-Pinvidic et al., 2013). Specifically, seismic reflectors imaged in the
93
Ocean Continent Transition (OCT) of the Iberian and Australian margins may also have formed by
94
detachment faults that alternated polarity (Gillard et al., 2015; Reston and McDermott, 2011).
95
Divergence rates and melt supply during the OCT phase, and during the following onset of indisputable
96
seafloor spreading at these margins, are not strongly constrained. Our results and hypothesis on the
97
nearly amagmatic seafloor spreading mode, and on its transition to volcanic seafloor spreading at an
ultraslow ridge, may nonetheless inform studies of detachment-dominated divergence and mantle
99
exhumation at the OCT phase, and of the transition from OCT to true seafloor spreading.
100
101
RESULTS
102
Along-axis extension, and estimated lifetime of successive axial detachments in a nearly amagmatic
103
eastern SWIR spreading corridor
104
We focus on the nearly amagmatic corridor between the 64°E and 65.6°E axial volcanos (Figure 1). The
105
smooth seafloor there forms 500 to 1000 m-high broad ridges, parallel to the ridge axis, which is nearly
106
orthogonal to the north-south trending direction of plate divergence to the west of 65°E, and up to
107
25° oblique to the east (Figure 1). Following (Sauter et al., 2013), we interpret these broad ridges
108
(numbered from 1 to 8 going back in time; Figure 1) as formed by successive axial detachments
109
between about 11 myrs-ago (#8) and the present (#1). The along flowline profile in Figure 2
110
summarizes this tectonic interpretation. Axial detachments #6 (which we propose was initiated about
111
5.6 myrs ago) to #1 (presently active) each cut into the footwall of the previous detachment, with an
112
opposite polarity (Sauter et al., 2013). Proposed breakaways B7 and B8 are both located in the
113
northern, African plate (Figures 1 and 2) and the corresponding exhumed fault surfaces locally bear
114
spreading-parallel corrugations (Cannat et al., 2009). These two south-facing detachments face
115
volcanic conjugate seafloor in the Australian plate and therefore formed under more magmatically
116
active axial conditions than detachments #6 to #1 (Cannat et al., 2009).
117
We pick the top of the inward-facing (toward the axis) slope of each ridge as the best approximation
118
(see Appendix Figure A1) for the location of the breakaway of the corresponding detachment fault,
119
and the base of the outward-facing slope of the corresponding broad ridge as the best approximation
120
for the location of the emergence of each fault at the seafloor. The along-axis extension of the eight
121
identified detachments, based on the length of their breakaway (Figure 1 and Table 1), ranges between
122
25 km (B7) and 95 km (B4). While these breakaways are mostly straight, the inferred emergence traces
123
show convex-outward undulations, with a typical wavelength of 15-20 km (Figure 1). These likely
124
reflect along-axis changes in the rheology of the detachment footwall, impacting the fault's emergence
125
angle. Most detachment-controlled ridges extend up to, and in the case of B5 (to the west) and B8 (to
126
the west and east), into, adjacent volcanic areas (Figure 1). Breakaway ridges B4, and to a lesser extend
127
B2, in the Antarctic plate, are long and follow the overall trend of the ridge axis, curving from E-W in
128
the west, to ENE-WSW in the east (Figure 1). Breakaway ridges B5 and B7, in the African plate, are
129
shorter and relayed to the east by broad ridges that trend NE-SW, oblique to the N-S spreading
130
direction but parallel to the local trend of the ridge axis. A shorter ENE-WSW ridge, also interpreted as
a detachment fault block, is found in an intermediate position to the east of B3 and B5 (Figure 1). These
132
local complexities are interpreted as due to faulting modes specific to oblique nearly amagmatic
133
spreading (Sauter et al., 2013) and are beyond the scope of this paper. We thus focus the following
134
analysis and discussions on the orthogonal-spreading part of the smooth seafloor corridor, to the west
135
of 65°E (Figure 1).
136
The horizontal offset estimated for past detachments is the along-flowline distance between
137
breakaway and emergence (reconstructed at the time of initiation of the next detachment). For
138
detachment #1, which is still active and at an early stage, the proposed estimate takes mass-wasting
139
into account and is explained in Appendix Figure A1. Estimated horizontal offsets for detachments
140
along the 64.6°E flowline (Figure 2) range between 4 km (active detachment #1; Table 1), and ~21 km
141
(detachments #2 and #8). At a spreading rate of 14 mm/yr (Patriat and Segoufin, 1988), these
142
estimated horizontal offsets correspond to faulting durations (Table 1) between 300 kyrs (detachment
143
#1, still active) and 1.5 myrs (detachment #2) for nearly amagmatic detachments 1 to 6, and of about
144
2.8 myrs, for corrugated detachments 7 and 8. For nearly amagmatic, flipping polarity detachments #
145
1 to 6, the horizontal distance between the emergence of a detachment and the location of the next
146
breakaway is 2.8 to 5.6 km (Table 1), indicating that new detachments typically cut into footwall rocks
147
that had been exhumed 200 to 400 kyrs previously.
148
149
Footwall to hanging wall: two stages in the generation of melt-starved oceanic lithosphere
150
A consequence of having successive detachments of opposite polarity that cut into their predecessor's
151
footwall is that the inward-facing slopes of smooth seafloor breakaway ridges are made of material
152
that was initially accreted and transported off-axis as part of the footwall of a detachment fault (Stage
153
1), then became part of the hanging wall of the next detachment fault (Stage 2). The oceanic
154
lithosphere forming these inward-facing slopes is therefore predicted to have been generated in two
155
stages and over the lifetime of two successive detachment faults.
156
Stage 2 involves the residence of previously accreted ultramafic seafloor, in the axial valley region as
157
part of the hanging wall of the next axial detachment (Figure 3). Geological observations made in the
158
present-day axial valley near 64.6°E indicate that Stage 2 results in the formation of small offset normal
159
faults and of isolated volcanic patches and ridges, that are distributed in a > 10 km-wide axial valley
160
(Sauter et al., 2013 and Figure 4). Seismic refraction and reflection results obtained in the same area
161
(Momoh et al., 2017) show lower seismic velocities and several sub-horizontal and north-dipping
162
reflectors in the basement of this near-axis domain, consistent with distributed faulting, hydrothermal
163
alteration and magmatic intrusions in the hanging wall of active detachment #1.
The outward-facing slopes of smooth seafloor breakaway ridges record only Stage 1: they form in the
165
footwall of a detachment, and are then captured, and moved off-axis into the footwall of the next
166
(antithetic) detachment. Seafloor ages in the outward-facing slopes of detachment ridges therefore
167
probably increase toward the axis (Figure 3). By contrast, most of the seafloor forming the
inward-168
facing slopes of these ridges has probably been modified by Stage 2 axial valley tectonics,
169
hydrothermal alteration and sparse volcanism, over the lifetime of the next, antithetic detachment.
170
Seafloor spreading in the near absence of melt is therefore predicted to result in complex seafloor age
171
patterns at scales of a few tens of kilometers or less (Figure 3). At larger scales, seafloor ages do
172
nonetheless increase off-axis: pickings for the two best expressed magnetic anomalies in the area (3A
173
and 5; Figure 1) are accordingly consistent with the ages predicted in Table 1 for breakaways B6 and
174
B8.
175
This two-stage evolution has two predictable consequences, in addition to the generation of a complex
176
lithosphere geology. One is the potential for thermal rejuvenation of the deep lithosphere during Stage
177
2, as older portions of the footwall of the first detachment find themselves on-axis again in the hanging
178
wall of the next detachment. The other concerns the potential for nearly amagmatic oceanic
179
lithosphere to bear magnetic anomalies. Ultramafic rocks that may have acquired a remanent
180
magnetization upon serpentinization (eg Oufi et al., 2002) in the footwall of the first detachment,
181
would then be subjected to Stage 2 diking and volcanic eruptions in the hanging wall of the next
182
detachment. For example, this could lead to the overprinting of a serpentinization-related magnetic
183
signature recorded up to 2.9 myrs ago at depth in the footwall of detachment #3, by the magnetic
184
signature recorded in volcanic rocks erupted up to 300 kyrs-ago in the hanging wall of detachment #2
185
(Figure 3). This, in addition to the overall low magnetization of serpentinized peridotites (refs), helps
186
explain why the magnetic anomaly record is poor and ambiguous over the ultramafic seafloor of the
187
study area (Bronner et al., 2014).
188
189
Along-axis transition from detachment-dominated to volcanic spreading
190
Figure 5 shows the transition, in the near-axis region, between nearly amagmatic
detachment-191
dominated spreading (along-flowline profile 1), and more magmatic spreading near the 64°E axial
192
volcano (profiles 3 and 4). Profile 1 has an asymmetrical topography, and the seafloor there exposes
193
almost only serpentinized peridotite (Sauter et al., 2013). Faults in the axial valley floor have vertical
194
offsets <200m; volcanism is sparse, forming isolated ridges and patches, and both rock sampling
195
(Paquet et al., 2016; Sauter et al., 2013) and seismic imaging (Momoh et al., 2017) indicate that
196
magmatic rocks form a volumetrically minor part of the basement. Nearly all the plate divergence is
therefore currently accommodated by axial detachment #1. By contrast, profiles 3 and 4, less than 30
198
km to the west, are located fully within volcanic seafloor, with several volcanic ridges, and fault scarps
199
that have a maximum vertical throw of 1000 m (Figure 5c). The gravity anomalies are in the negative
200
range (Figure 5b), consistent with a thicker crust (Cannat et al., 2006), and we see no evidence in these
201
profiles that detachment #1 is continuing at depths beneath rafted blocks of volcanic seafloor (Reston,
202
2018; Reston and Ranero, 2012). The axial topography is symmetrical, and seafloor ages from magnetic
203
anomalies (Cannat et al., 2006) increase monotonically with distance to the axis (Figure 5c). These
204
characteristics are consistent with in situ eruption of the volcanics and are typical of seafloor spreading
205
at moderate melt supply, with plate divergence being partitioned into magma emplacement and fault
206
displacement distributed in the axial domain (eg Buck et al., 2005).
207
Profile 2 is in an intermediate position and cuts the western end of detachment #1 (Figure 5a). The
208
seafloor along this profile shows volcanic morphologies, with spreading perpendicular ridges that are
209
clearly in-situ volcanic constructions (Figure 4 and Sauter et al., 2013), and fault scarps ≤ 200 m-high
210
(Figure 5b); yet the gravity anomalies are in the positive range (Figure 5b). These characteristics are
211
consistent with seafloor spreading at relatively low melt supply, with recent plate divergence being
212
accommodated for a part by detachment #1, and for another part by magma emplacement and smaller
213
offset normal faults distributed in the axial valley. The overall topography of the axial region along
214
profile 2 is distinctly asymmetrical across-axis and similar to that of profile 1. This asymmetric
215
topography is probably mostly due to the broad plate bending effect of the active detachment in the
216
nearly amagmatic eastern domain of profile 1. The axial domain between profiles 2 and 1 is
217
characterized by several volcanic ridges (Figure 4), that formed by local eruptions, on older volcanic
218
seafloor in the west, and directly over ultramafic seafloor to the east (Sauter et al., 2013).
219
Our near-axis observations therefore point to a gradual transition, over an along-axis distance of less
220
than 30 km, from the detachment-dominated, nearly amagmatic mode of spreading, to a
melt-221
emplacement dominated, symmetrical, mode of spreading. Such a gradual transition indicates that the
222
amount and the distribution of tectonic displacement (one axial detachment, and/or several
223
distributed smaller offset normal faults) at slow spreading ridges are tuned with the melt supply at
224
scales <10 km, so as to complement the melt emplacement contribution to the divergence of the two
225
plates (Figure 6).226
227
DISCUSSION228
Full lithosphere sketches of an ultraslow and magma-poor ridge
Figure 6 illustrates the concept of a gradual transition from the magmatically robust volcanic spreading
230
mode, to nearly amagmatic, detachment-dominated spreading, with tectonic displacement on faults
231
being tuned over the width of the axial domain, to complement melt emplacement so that the two
232
plates diverge at the spreading rate that is imposed by far-field plate tectonics forces. This is similar to
233
the interpretation proposed by (MacLeod et al., 2009) for the along-axis transition from
detachment-234
dominated spreading to more volcanic ridge domains at 13°N on the Mid-Atlantic Ridge (MAR); and an
235
alternative to the rafting detachment model developed by Reston and Ranero (2012) and by Reston
236
(2018), in which axial detachments are proposed to continue at depth beneath rafted blocks of volcanic
237
seafloor at slow and ultraslow ridges. We discard this alternative interpretation because of clear
238
geological evidence that volcanic rocks in the study area were erupted in situ (Figure 4 and recent
239
submersible observations; Cannat et al., AGU abstract 2017).
240
Figure 6 shows the upper 10 kilometers of the axial domain. Microearthquake depths reported by
241
Schlindwein and Schmid (2016), indicate that the seismogenic lithosphere thickens over an along-axis
242
distance of less than 50 km, from less than 10 km-thick beneath the 65.6°E axial volcano (Figure 1), to
243
about 25 km-thick at the eastern edge of the 64.6°E nearly amagmatic corridor. Assuming that a similar
244
thickening occurs with distance from the 64°E volcano (Figure 1), we infer that the volcanic seafloor at
245
the longitude of profiles 3 and 4, and the nearly amagmatic seafloor at the longitude of profile 1
246
probably have seismogenic lithosphere thicknesses of about 10-15 km, and 20-25 km, respectively.
247
Transitioning from the two spreading modes therefore also involves thinning the axial seismogenic
248
lithosphere by at least 10 km, over an along-axis distance of ~30 km. In the following paragraphs, we
249
discuss full-lithosphere conceptual sketches based on the present-day geology of the eastern SWIR
250
axis, for the nearly amagmatic and for the volcanic spreading modes.
251
252
Nearly amagmatic, detachment-dominated spreading mode. Detachment #1 (Figure 1) presently
253
accommodates nearly all the plate divergence. It cuts through the thick axial brittle lithosphere and
254
roots into ductile shear zones that are documented in dredged ultramafic samples (Bickert et al., in
255
prep.) at the base of the plate (Figure 7a). This detachment is at an early stage (~300 kyrs of activity
256
for a typical detachment lifetime of 1 to 1.5 myrs; Table 1) and has so far caused an estimated
257
maximum footwall flexure of 15° (Appendix Figure A1). This flexure could at least partially be
258
accommodated by reactivation of former detachment #2, accounting for the change of slope observed
259
across the proposed emergence of detachment #2 (E2; Figures 1 and 7a). Sub-horizontal and dipping
260
seismic reflectors documented in the axial valley basement are interpreted as minor conjugate faults
261
and magmatic intrusions in the hanging wall of detachment #1, some of which fed the sparse basalt
262
patches observed at the seafloor (Momoh et al., 2017). These basalts are compositionally distinct from
those erupted in the nearby volcanic seafloor domains and, based on their composition, it is unlikely
264
that they erupted from dikes propagating along-axis from these volcanic domains (Paquet et al., 2016).
265
Seafloor imagery (Sauter et al., 2013 and Figure 4) and submersible observations (Cannat et al., AGU
266
abstract, 2017) indicate that most basalt patches are spatially associated with faults that guide melts
267
in the upper levels of the lithosphere (Figure 7a). Melt infiltrations, and dikes intruded at greater
268
depths and presumably for the most part into the footwall plate (Figure 7a) are also documented in
269
peridotites samples from the smooth seafloor domains (Paquet et al., 2016).
270
Faults and the associated damage also probably channel hydrothermal fluids, so that serpentinization
271
would occur for a good part in and next to the main axial detachment (Andreani et al., 2007; Rouméjon
272
and Cannat, 2014). Sample studies indicate that serpentinization at slow ridges is a multiphase
273
reaction, occurring for the most part in the most kinetically favorable temperature range of 200-350°C,
274
with an initial stage of formation of the serpentine mesh texture at low fluid-rock ratios, followed by
275
several stages of veining and recrystallization of the initial serpentine at higher fluid-rock ratio
276
(Andreani et al., 2007; Früh-Green et al., 2004; Rouméjon et al., 2014). Based on hypocenter depth
277
distribution in melt-poor domains next to the 65.6°E axial volcano, Schlindwein and Schmid (2016)
278
proposed that serpentinization there initiates at depths of ~15 km below seafloor (Figure 7a).
279
Temperatures in the 200-350° C range could, however, also be found at shallower, near seafloor
280
depths in the upflow zone of high temperature, black smoker-type, hydrothermal circulation cells.
281
Such high temperature hydrothermal upflows have not been discovered so far in the area, and given
282
that magmatic rocks are scarce, they should not represent the dominant hydrothermal regime. Yet
283
black smoker-type circulations may develop transiently to cool isolated melt intrusions and trigger
284
episodes of rapid serpentinization in the surrounding ultramafic rocks, both in the footwall and in the
285
hanging wall plates (Figure 7a). Slower, lower temperature serpentinization, as yet not documented
286
by sampling, may also occur in the tectonically damaged footwall and hangingwall domains.
287
At the current early stage of activity of detachment #1, the axial lithosphere, which we infer formed in
288
the footwall of detachment #2 (Figure 3), is 0.6 to 1.5 myrs-old and could thus be thicker than if
289
controlled solely by the active balance between present-day on-axis heat supply and heat loss. Heat in
290
this spreading mode would be supplied primarily by conduction, by tectonic advection of hot mantle,
291
and by serpentinization reactions. Although advected and latent heat from the sparse melt intrusions
292
could support active black smokers, this efficient mode of hydrothermal cooling would be highly
293
episodic and most hydrothermal circulations would occur at lower fluid-rock ratio in tectonically
294
damaged domains. The resulting axial temperature gradient should therefore be nearly conductive
295
(Figure 7c). Over time and as detachment #1 accommodates more displacement, greater footwall
296
flexure will occur, lowering the fault emergence angle and causing enhanced internal deformation and
serpentinization. Also, because of the near-zero melt input, the detachment system should migrate in
298
the direction of the hanging wall and away from the axial region of higher heat input and thinner
299
lithosphere, ultimately favoring the initiation of a new detachment (Buck et al., 2005).
300
301
More magmatically robust volcanic spreading mode. The gravity-derived crustal layer on-axis at the
302
longitude of profiles 3 and 4 is 6 to 7 km-thick (Cannat et al., 2006). Plate divergence there thus
303
concerns an axial lithosphere that is thinner than in the nearly amagmatic setting sketched in Figure
304
7a, but still thicker than the crust. Hence, even if magmatic dikes and gabbro bodies do accommodate
305
most plate divergence in the upper lithosphere, plate divergence acting on the deeper axial lithosphere
306
still requires tectonic uplift of mantle material from the asthenosphere, and through-going melts may
307
form mechanically weak intrusions in this axial lithospheric mantle (Cannat, 1993). Melts intruded
308
higher up, into the brittle lithosphere, will also constitute weak zones while they cool, crystallize, and
309
release the heat necessary to fuel vigorous black smoker-type hydrothermal circulation (eg Lowell et
310
al., 2013). The axial lithosphere in this volcanic setting (Figure 7b) should therefore not just be thinner
311
than in the nearly amagmatic detachment-dominated setting. It should also have a different type of
312
geotherm (Figure 7c), with an upper brittle part that is more efficiently cooled by hydrothermal
313
convection cells, and a lower part that is kept weak and thin by frequent melt injections. Temperatures
314
in the upper domain are expected to be variable in space and time (Figure 7c), depending on the
315
activation and geometry of black smoker circulations.
316
Whether magmatic intrusions that form in the lithospheric mantle are subsequently uplifted into the
317
crust, or remain at deep levels of the new plate as it is transported off-axis, should depend on the
318
distribution and offset of axial faults. In Figure 7b, we propose that several of the
symmetrically-319
distributed axial normal faults observed in profiles 3 and 4 (Figure 5) root into the melt-intruded axial
320
lithospheric mantle, and may thus lift some of its components into the crust. The axial domain of melt
321
emplacement may thus be thinned by faults to produce the off-axis crust. Therefore, although the melt
322
supply is probably such that the crustal layer off-axis is primarily magmatic, we predict that some of
323
these magmatic rocks have initially been intruded in the lithospheric mantle, then tectonically uplifted
324
into the crust by successive moderate offset normal faults, together with small volumes of their host
325
mantle rocks. Exhumed mantle-derived rocks have actually been dredged in the volcanic seafloor
326
domain a few km to the north west of profile 4 (Sauter et al., 2013).
327
This calls for a discussion of the applicability of the popular M ratio concept to this, and to other thick
328
lithosphere axial settings. The M ratio as defined by Buck et al. (2005) describes the fraction of the
329
total extension of the brittle lithosphere accommodated magmatically; (1-M) is accommodated by
faults. If melt emplacement accommodates plate divergence over the full thickness of the brittle plate,
331
as modelled for slow-spreading ridges by Buck et al. (2005) and Tucholke et al. (2008), M is a direct
332
function of the melt flux (m) per increment of plate separation (m can be expressed as the cumulated
333
thickness of melt provided per increment of spreading). On the other hand, the M ratio does not
334
directly reflect m if melts are either also emplaced below the plate on-axis (the common case at fast
335
and many slow ridges), or emplaced only over a portion of a thick axial brittle plate (probably the
336
common case at ultraslow mid-oceanic ridges) . Instead, M then also depends on the thickness of the
337
brittle lithosphere on-axis (HB), and on the thickness of the domain of axial melt emplacement (HM).
338
Olive et al. (2010) addressed this for the HM > HB case by defining a second ratio, MD for the contribution
339
of melt emplaced in the ductile domain. In the HM < HB case, M can be expressed as m/HB. In the
340
volcanic seafloor configuration of Figure 7b, this formula yields a M value of ~0.6, for HB = 12 km and
341
assuming that the off-axis crustal thickness (~7 km) is a good approximation for m (ie that this
off-342
axis crust is mostly free of mantle-derived peridotites, and that there is very little gabbro trapped in
343
the off-axis mantle lithosphere).
344
345
Transition between the detachment-dominated and volcanic modes of spreading. Profile 2 (Figure 5)
346
corresponds to an along-axis transition between the detachment-dominated (to the east) and volcanic
347
(to the west) modes of spreading. Seafloor imagery and sampling (Sauter et al., 2013) suggest that
348
plate divergence at this longitude occurs by a combination of displacement along the westward
349
continuation of detachment #1, along smaller offset normal faults in the axial valley, and by in-situ
350
magmatic injections forming prominent spreading-perpendicular volcanic ridges (Figure 4). As a result,
351
the geophysically-defined crustal layer should be more geologically composite than in the nearly
352
amagmatic smooth seafloor configuration (Figure 7a), with proportions of serpentinized ultramafic
353
rocks and magmatic intrusions that would depend both of recent magmatic input, and of whether the
354
axial configuration in the recent past was more magmatic (in which case the crust offset by detachment
355
#1 would be mostly magmatic), less magmatic (in which case this crust would be mostly ultramafic) or
356
similarly magmatic.
357
In this intermediate spreading configuration, more melts would transit through and react with the
358
lower lithospheric axial mantle than in the nearly amagmatic configuration. These deep melts would
359
slowly release their intrinsic and latent heat into the surrounding mantle and would therefore keep
360
the lower axial lithosphere thinner and hotter than in Figure 7a. A further increase in the melt supply
361
would eventually allow for axial faults (and for the hydrothermal systems that develop in permeable
362
brittle rocks) to reach down to very near these melt-rich and hot regions, leading to vigorous
363
hydrothermal circulation. This configuration would ultimately resemble the more magmatically robust
volcanic mode of Figure 7b. This leads us to conclude that the effect of melts emplaced in thick
365
lithosphere, ultraslow spreading ridge settings goes beyond the mere mechanical accommodation of
366
plate divergence. Melts thin and weaken the lithosphere (thereby modifying the thickness and
367
strength of the rigid domain in which plate separation needs to be accommodated). Melts emplaced
368
in and near the brittle lithosphere also modify the axial thermal regime by fueling vigorous, if transient,
369
hydrothermal circulation, so that the upper and lower lithosphere are maintained at temperatures
370
respectively cooler and hotter than the conductive geotherm. We propose that these combined effects
371
(rheological and thermal) are key to understand how the two highly contrasted ridge settings proposed
372
in Figure 7 transition along-axis over distances <30 km.
373
374
Spreading rate, melt supply, and the spreading mode at slow and ultraslow ridges
375
Spreading rate has a large impact on the thermal regime of mid-ocean ridges (eg Chen and Morgan,
376
1990). With a spreading rate about half of that of the MAR, the SWIR is expected to have a thicker axial
377
lithosphere in places where the melt budget per unit of plate separation is the same, and a fortiori also
378
in places where this melt budget is less (the axial lithosphere should be even thicker due to a lesser
379
input of magmatic heat). In thick axial lithosphere settings, lithosphere thickness affects the (M) ratio
380
between the magmatic and tectonic contributions to plate separation and could therefore be expected
381
to be one of the main factors controlling the spreading mode (Buck et al., 2005). We now assess this
382
effect through a comparison of well-studied axial configurations at the MAR and SWIR.
383
The nearly amagmatic flip-flop detachment (after the terminology of Reston and McDermott, 2011)
384
mode documented at the ultraslow SWIR has not so far been identified at slow ridges, an absence that
385
probably results from more extreme degrees of along-axis melt focusing at ultraslow ridges, another
386
consequence of having a very thick axial lithosphere (Cannat et al., 2003; Standish et al., 2008). The
387
other two modes of slow spreading accretion (volcanic and corrugated detachment modes) are
388
common to both slow and ultraslow settings and therefore offer points of comparison. Microseismicity
389
results acquired at 13°N at the Mid-Atlantic Ridge, and in the 49°E region of the SWIR indicate
390
seismogenic lithosphere thicknesses of up to 15 km and 20 km respectively (Parnell-Turner et al., 2017;
391
Yu et al., 2018). Corrugated, dome-shaped, core-complexes that form in the Antarctic plate at 49°39’E
392
on the SWIR (Zhao et al., 2013), therefore result from detachments that cut through some 20 km of
393
brittle lithosphere, compared to up to 15 km for the 13°N MAR detachments (Figure 8). In the two
394
cases, domal exposed detachment surfaces face volcanic seafloor in the other plate (MacLeod et al.,
395
2009; Zhao et al., 2013), and seismic crustal thicknesses are similar (with a large 2-5 km range of
396
variation in the two settings). There is therefore no evidence for a significant contrast between the
two settings in terms of the volume of melt supplied per increment of plate separation. Along the same
398
line, the volcanic axial configuration in profiles 3 and 4 of Figure 4 resembles that observed at MAR
399
segment centers, with a symmetrical topography, distributed faults and a crustal thickness of 6-7 km,
400
yet it has an axial seismogenic plate thickness that is probably greater (10 to 15 km; Schlindwein and
401
Schmid, 2016) than documented for volcanic domains of the MAR (less than 8 km; Wolfe et al., 1995),
402
and more similar to that of corrugated detachment MAR domains (Figure 8).
403
These comparisons therefore suggest that the activation of the volcanic, or of the corrugated mode of
404
spreading at slow and ultraslow ridges is connected more to the volume of melt per increment of plate
405
separation, than to the thickness of the axial lithosphere. This is not fully consistent with the
406
hypothesis, proposed by (Buck et al., 2005), that spreading modes are determined by the relative
407
contribution of magma and faults to plate divergence, expressed as the M ratio. M is less, for a given
408
magmatic contribution m (the cumulated thickness of melt provided to the ridge per increment of
409
spreading), if the axial brittle plate is thicker. The volcanic and corrugated modes therefore both
410
appear to be activated at lower M at ultraslow than at slow ridges. The explanation we now explore is
411
that the impact of the axial lithosphere on spreading modes at slow and ultraslow ridges lies not just
412
in its actual thickness, but also in its strength, and that this strength is affected by melt supply.
413
Detachment-dominated modes, corrugated or not, develop for substantial lithosphere thicknesses
414
(Figure 8). MAR corrugated detachments are steep at depth (ca 70°; de Martin et al., 2007;
Parnell-415
Turner et al., 2017) but, when mature, emerge at very low angles (<15°; Smith et al., 2006), indicating
416
low effective footwall flexural rigidity. Smooth seafloor detachments in nearly amagmatic corridors of
417
the SWIR experience substantial, but probably not as large, footwall flexure (Momoh et al., in prep.).
418
Given that the axial lithosphere is not thin in either case, such large flexures call for mechanisms that
419
weaken the detachment footwall as faulting proceeds, forming weaker domains in an otherwise thick
420
mechanical lithosphere (Buck, 1988; Lavier et al., 1999). Most slow spreading ridge numerical models
421
to date have implemented this effect by making rock strength a function of strain (Lavier et al., 1999).
422
Geological ground truth comes from studies of samples from the exposed footwall of axial
423
detachments. These studies show that strain localization occurs primarily in assemblages of one or
424
several weak hydrous minerals (serpentine, chlorite, amphibole and talc; Boschi et al., 2006; Escartín
425
et al., 2003; Picazo et al., 2012; Schroeder and John, 2004) that form in the hydrothermally altered
426
brittle lithosphere, at greenschists facies temperatures (<500°C). Talc, specifically, is significantly
427
weaker than serpentine, and is not formed in substantial amounts from peridotites without the input
428
of additional silica, via metasomatic hydrothermal fluids that have altered magmatic rocks, or directly
429
from magmatic veins intruded in the peridotites (Boschi et al., 2006; Picazo et al., 2012). Talc is
430
uncommon in samples from the nearly amagmatic smooth seafloor (Rouméjon et al., 2014). It is by
contrast common in samples from corrugated seafloor. Large footwall flexure in the corrugated
432
detachment mode is therefore likely facilitated by talc forming from peridotite gabbro mixtures, while
433
nearly amagmatic detachments would operate with more rigid footwalls (Cannat et al., 2009). Higher
434
melt supply, leading to a transition from the corrugated detachment to the volcanic mode, would also
435
likely strengthen the brittle lithosphere (Cannat et al., 2009) because: 1- the proportion of
mantle-436
derived peridotites would become too small to form pervasive serpentine and or talc-bearing zones of
437
weakness; and 2- new magmatic intrusions, which initially form weak melt-mush and ductile gabbro,
438
turn, as they cool, into pristine and strong brittle magmatic rocks (Figure 8). More abundant melt, by
439
contrast, weakens the ductile axial lithosphere. The nearly amagmatic detachment mode is therefore
440
expected to be distinct from both the corrugated detachment, and the volcanic mode, in that it
441
operates with a significantly stronger lower axial lithosphere (Figure 8), which would oppose large
442
flexure and may therefore prevent the development of detachments (Lavier, 2002). Field evidence that
443
detachments exist in the SWIR nearly amagmatic spreading corridors indicates that additional strain
444
weakening mechanisms are activated. Microstructures in ductile and semi-brittle shear zones in
445
dredged ultramafic samples show that dynamic grain size reduction in the ductile mantle lithosphere
446
is a plausible candidate (Bickert et al., submitted).
447
448
CONCLUSIONS
449
We propose the following conclusions:
450
1- new oceanic lithosphere in the nearly amagmatic detachment-dominated mode is accreted over the
451
lifetime of two successive detachment faults (ie over 1.5 to 3 myrs) and is for the most part made of
452
material that experienced a two-stages tectonic, hydrothermal, and magmatic evolution: first in the
453
footwall of one detachment fault, then in the hanging wall of the next detachment fault.
454
2- individual active detachments extend over the whole along-axis width of nearly amagmatic seafloor
455
spreading corridors, up to 95 km in the case studied here. They accommodate up to 20 km of plate
456
divergence, and probably cut through a very thick axial lithosphere (≥25 km). Breakaways are straight,
457
cutting into ultramafic seafloor that was exhumed up to 400 kyrs previously in the former detachment
458
fault's footwall. The emergence of mature detachment faults shows 15-20 km-long undulations, which
459
we propose are due to along-axis changes in the rheology of the detachment footwall, impacting the
460
fault's emergence angle.
461
3- the along-axis transition from nearly amagmatic, detachment-dominated spreading, to more
462
magmatic spreading next to axial volcanic centers, occurs gradually over distances of < 30 km through
463
a fine tuning of tectonic displacement on faults to the local rates of melt emplacement, so as to
accommodate the plate divergence. We propose that this gradual transition involves two main
465
processes that are both related to the increase of melt supply: 1- more melt reduces the need for
466
displacement on faults as a mean to accommodate plate divergence; 2- more melt heats and weakens
467
the deep axial lithosphere, thus reducing the thickness of the rigid domain over which divergence
468
needs to be accommodated.
469
4- A comparison with the slow spreading MAR further suggests that the activation of the volcanic or
470
detachment-dominated modes of spreading at slow and ultraslow spreading ridges is primarily
471
controlled by the melt budget (the volume of melt supplied per unit of plate separation), over a range
472
of axial lithosphere thickness (the thickness of the plate over which divergence must be
473
accommodated, decreasing with spreading rate at a given melt budget). Spreading modes are
474
therefore not determined solely by the relative contribution of magma and faults to plate divergence
475
(the M ratio of Buck et al., 2005), since this relative contribution also depends on axial lithosphere
476
thickness . We propose that the rheology of the axial lithosphere is a key additional parameter, that
477
also depends on the melt supply. Melt and melt products modify the strength of the brittle lithosphere,
478
resulting in contrasted potential for strain localization and footwall flexure, the strongest configuration
479
being that of the most magmatically active (volcanic) mode, and the weakest and most favorable to
480
long-lasting detachments and large flexure, being that of the moderately magmatic (corrugated)
481
detachment mode. Melt heat can also sustain vigourous, black smoker type hydrothermal circulations
482
that impact the thermal state of the lithosphere and may favor enhanced hydrothermal alteration.
483
Finally, the presence of melt weakens the ductile mantle at the base of the brittle plate, so that the
484
nearly amagmatic detachment mode probably operates on axial domains that are characterized by a
485
strong ductile lithospheric mantle that is lacking in the more magmatically active corrugated
486
detachment and volcanic modes of spreading.
487
488
Acknowledgements:
489
We thank our two reviewers for their work and several helpful comments. We acknowledge partial
490
funding by CNRS-INSU post cruise research grants obtained in 2015 and 2017 and by ANR
491
project "Ridge-Factory-Slow". This is IPGP paper #4025.
492
493
APPENDIX
494
Mapping of axial detachment faults and estimating their age and lifetime in melt-poor oceanic
495
lithosphere
In order to map past detachment faults in the nearly amagmatic spreading corridor of Figure 1, and to
497
estimate their age and lifetime (Table 1), we picked the top of the inward-facing (toward the axis) slope
498
of each detachment-controlled ridge as the best approximation for the breakaway, and the base of
499
their outward-facing slope as the best approximation for the emergence. This approach yields
500
uncertainties, primarily due to the effect of landslides, as illustrated in Figure A1 for presently active
501
detachment #1. For young detachments, the (eroded) breakaways (B in Figure A1) may be a few
502
hundred meters closer to the ridge axis than the top of the inward-facing slope of the detachment
503
ridge, but this discrepancy should diminish and eventually disappear as flexure proceeds so that the
504
outward facing slope of the detachment ridge steepens and also gets subjected to landslides (Figure
505
A1f). Similarly, the emergence of an active detachment may be several hundred meters closer to the
506
breakaway than the base of the detachment-controlled axial relief, which may correspond instead to
507
the front of landslide deposits (Figure A1d). For past detachments, however, this domain has been
508
captured into the footwall of a more recent detachment, probably causing flexure-related deformation
509
and further obscuring the relation between the base of the slope and the past location of the
510
emergence. We estimate that picking the emergence of past detachments at the base of the
outward-511
facing slopes is the most straightforward approach, although it may introduce errors of up to 2 km /
512
142 kyrs in the estimated displacement/duration of individual detachments. This is a large error on
513
individual detachments. However, because seafloor spreading in the study area has almost fully been
514
accommodated by detachment faulting from the initiation of detachment #6 (6.1 myrs ago; Table 1),
515
to the present, individual errors made with our method on each detachment must be compensated
516
on the others, within 2 km.
517
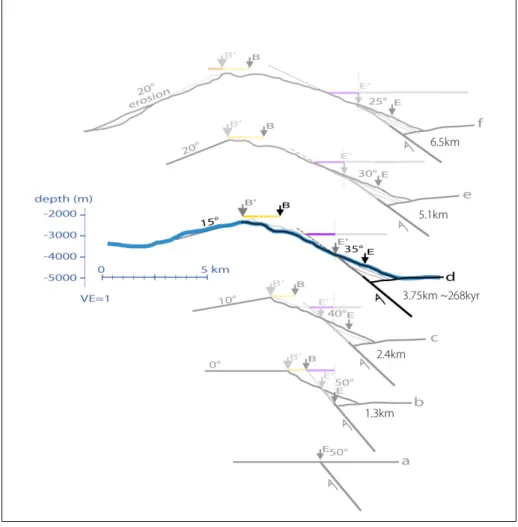
Figure A1. Conceptual sketches illustrating the evolution of presently active detachment #1. This
519
detachment is at an early stage. Its proposed present-day configuration is shown in A1d, with the
520
measured axial bathymetric profile in blue (no vertical exaggeration). The dip (~35°) and location of
521
the emergence are based on recent submersible observations (Cannat et al., AGU abstract 2017).
522
Panels A1c to A1a are back in time, and panels A1e to A1f into the near future, assuming a progressive
523
footwall flexure, resulting in a decrease of the faults emergence angle from an initial 50° dip (although
524
not shown, we assume that fault dips also increase with depth); and a 20° slope stability angle for
525
serpentinites (Cannat et al., 2013), which is maintained at each step by landslides so that the eroded
526
cross sectionnal area equals that of landslide deposits. B is the location of the actual breakaway, and
527
B' is the location of the top of the ridge-ward slope at each step. The distance between B and B' results
528
from mass-wasting and is expected to decrease with increasing offset and flexure along the
529
detachment. E is the emergence of the fault with respect to the hanging wall plate, and E' is the
530
emergence from the landslide package. Based on this sketch, our best estimate for the horizontal
531
offset/duration of detachment #1 are about 4 km/300 kyrs (Table 1).
532
533
534
535
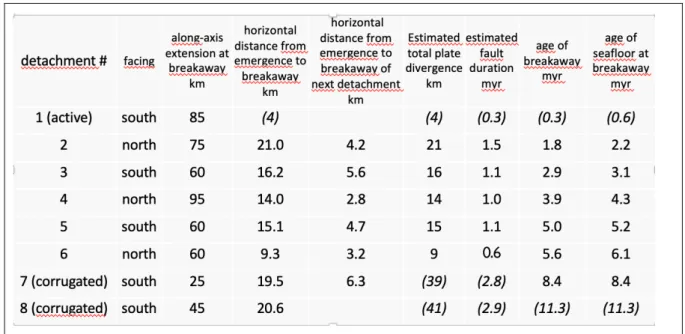
TABLE 1. Characteristics of successive axial detachments as measured and estimated (see Appendix)
536
along the profile of Figure 2.
537
538
539
FIGURE CAPTIONS
540
541
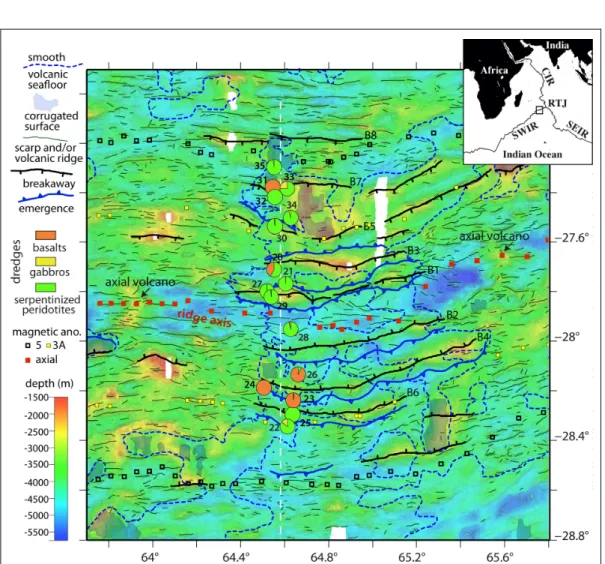
Figure 1. Tectonic sketch map showing the proposed breakaways and emergences of successive
542
detachments in the 64.6°E nearly amagmatic corridor; the volcanic scarps and ridges in the more
543
magmatically active volcanic domains to the east and west; the contours of these volcanic domains,
544
and of several corrugated detachment surfaces and pickings for magnetic anomalies 0, 3A and 5
545
(Cannat et al., 2006); the recovered lithologies in 16 dredges (Sauter et al., 2013); and the location of
546
the cross-section shown in Figure 2. Detachment faults breakaways (B) and emergences are numbered
547
from 1 (presently active) to 8 (initiated at the time of magnetic anomaly 5; ~11 Myrs ago).
548
549
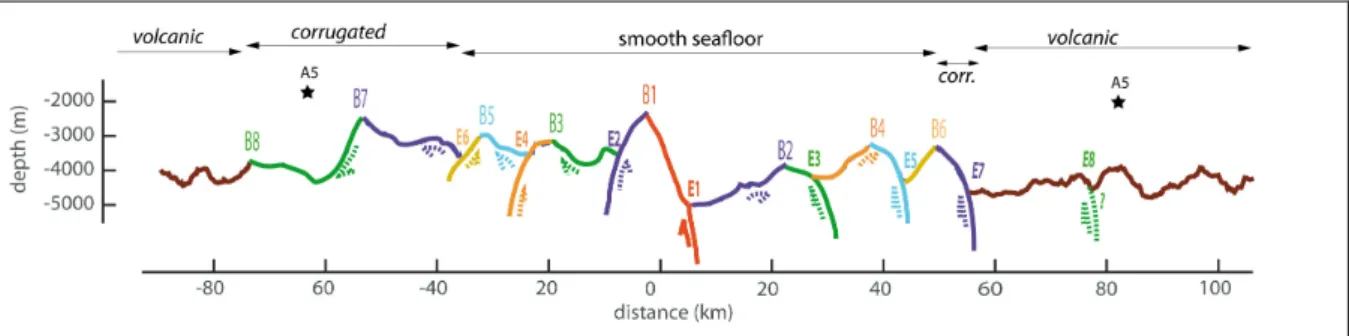
Figure 2. Tectonic interpretation of the along flowline cross-section located in Figure 1, modified after
550
(Sauter et al., 2013), showing the proposed sequence of successive detachments leading to the
551
continuous exposure of ultramafic rocks in the two diverging plates in smooth seafloor domain
552
(detachments #6 to 1), or in the northern, African plate, facing volcanic seafloor in the Antarctic plate
553
(corrugated-volcanic seafloor domains; detachments #8 and 7). Stars: pickings of anomaly A5 in
554
nearest shipboard magnetic profile (Cannat et al., 2006).
555
556
Figure 3. Tectonic interpretation of the along flowline cross-section located in Figure 1. Zoom to the
557
near-ridge region, showing the ages estimated (text and Table 1) for the initial exposure of ultramafic
558
rocks in the footwall (FW) of each detachment, and for subsequent tectonics, incipient volcanism, and
559
hydrothermal alteration in the hanging wall (HW) of the next detachment.
560
561
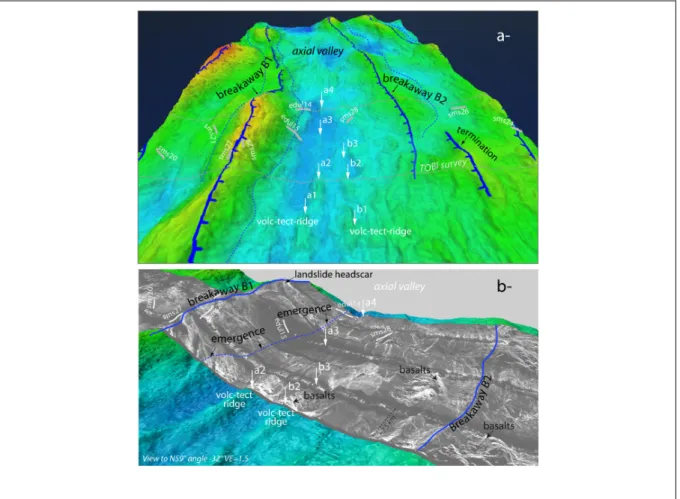
Figure 4. Perpective views of the near axis region in the 64.6°E nearly amagmatic corridor. a-
562
bathymetry (depth scale as in Figure 1) with proposed detachment fault breakaways B1 and B2, dredge
563
tracks (in grey, recovered rocks are > 90% ultramafic; (Sauter et al., 2013)), and outlines of the TOBI
564
(Towed Ocean Bottom Instrument) survey (Sauter et al., 2013). b- TOBI reflectivity image drapped on
565
bathymetry. Hummocky basaltic outcrops rest on less reflective ultramafic seafloor. They tend to form
566
spreading-perpendicular ridges (a1-a2 and b1-b2), that align with small offset faults of the ultramafic
567
basement (a2 to a4 and b2 to b3; these faults are more visible in the bathymetry of panel a). The
568
location of the emergence of detachment #1 is based on recent submersible observations (Cannat et
569
al., AGU abstract 2017).
570
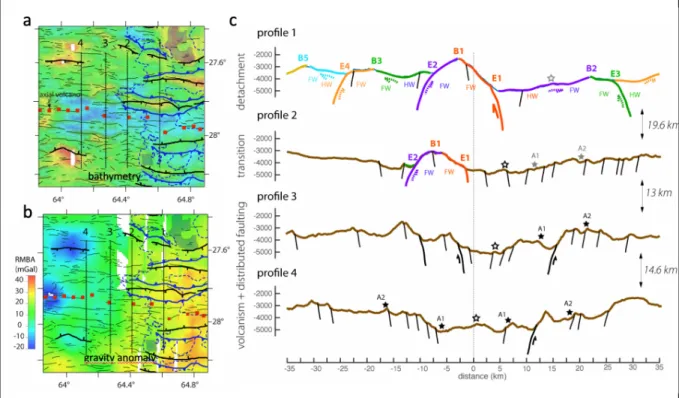
Figure 5. Tectonic interpretation of 4 along flowline cross-sections distributed over the transition from
572
nearly amagmatic seafloor in the east (profile 1), to fully volcanic seafloor in the west (profiles 3 and
573
4). Panels a and b show the location of these profiles on bathymetry (depth scale, tectonic features
574
and axial magnetic anomaly pickings as in Figure 1) and on a residual mantle Bouguer anomaly map
575
(Cannat et al., 2006). Panel c: seafloor is colored as in Figure 2 for ultramafic seafloor, and in brown
576
for volcanic seafloor; magnetic anomalies 0 (open star), A1 and A2 (closed stars, grey when picking is
577
ambiguous) as in (Cannat et al., 2006).
578
579
Figure 6. 3D perspective sketch of the axial region between across-axis profiles 1 and 3 (in blue;
580
location and tectonic interpretation of these profiles in Figure 5). The concept illustrated here is that
tectono-magmatic processes that accommodate plate divergence are tuned so that along-axis
582
variations of melt supply are compensated by greater tectonic displacement on faults. In the nearly
583
amagmatic configuration of profile 1, most plate divergence occurs at a single detachment fault, while
584
in the more magmatically active configuration of profile 3, only 30 km away along-axis, the same total
585
amount of divergence occurs through distributed faulting and magmatic injections. This sketch only
586
goes down ~10 km into basement and therefore does not fully reach to the base of the lithosphere,
587
particularly in the nearly amagmatic configuration, where it probably is >25km-deep (Schlindwein and
588
Schmid, 2016). Full plate 2D sketches for the configurations of profiles 1 and 3 are shown in Figure 7.
589
590
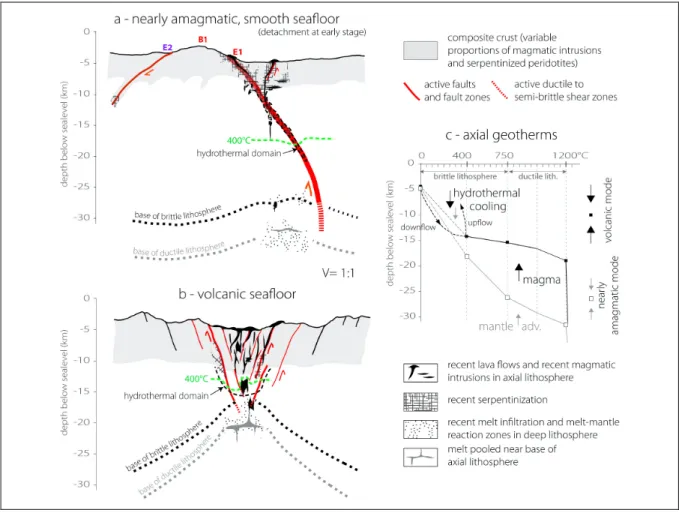
Figure 7. No vertical exaggeration, full plate 2D conceptual sketches of the ridge axis (a and b) and of
591
axial geotherms (c) for across-axis profiles 1 and 3 (location in Figure 5). The base of the brittle
592
lithosphere in a and b is drawn from constraints on the depth of seismicity (Schlindwein and Schmid,
593
2016). The crust (grey) is a low density, low seismic velocity layer. It is sketched on the basis of gravity
594
and seismic velocity constraints (Cannat et al., 2006; Momoh et al., 2017), and formed by the
595
combination of magmatic flows, intrusions, fault damage, and serpentinization. For clarity, the axial
596
sketches only show the most recent magmatic flows, intrusions, and infiltrations, and the most
597
recently serpentinized domains. See text for explanations.
599
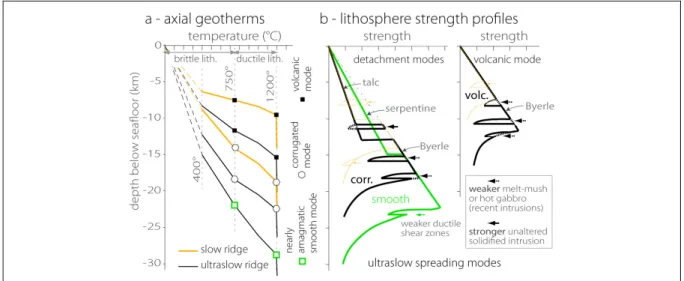
Figure 8. Conceptual sketches of axial geotherms (a) and lithosphere strength profiles (b) for the nearly
600
amagmatic smooth seafloor detachment mode, the weakly magmatic corrugated detachment mode,
601
and the magmatically more robust volcanic spreading mode, at slow and ultraslow ridges. Depth to
602
the base of the brittle lithosphere is based on constraints on the depth of seismicity at the MAR and
603
SWIR (Parnell-Turner et al., 2017; Schlindwein and Schmid, 2016; Wolfe et al., 1995; Yu et al., 2018).
604
Thermal gradients in the lower lithosphere are inferred to be higher at higher melt supply (see Figure
605
7c and text). Lithosphere strength (not scaled) is a function both of lithosphere thickness, and of two
606
types of weakening mechanisms: hydrothermal alteration yielding weaker minerals (simplified here as
607
a choice between serpentine or mechanically weaker talc; see text); and melt injection, which initially
608
weakens the plate as the melt cools, then could make it locally stronger (if cutting though weak,
609
hydrothermally altered exhumed mantle; see text). These weakening mechanisms differ between the
610
3 spreading modes and are proposed to contribute to the transition from one mode to another at
611
varying melt supply (see text).
612
613
REFERENCES
614
Andreani, M., Mével, C., Boullier, A.M., Escartín, J., 2007. Dynamic control on serpentine
615
crystallization in veins: Constraints on hydration processes in oceanic peridotites.
616
Geochemistry, Geophysics, Geosystems 8. https://doi.org/10.1029/2006GC001373
617
Boschi, C., Früh-Green, G.L., Escartín, J., 2006. Occurrence and significance of serpentinite-hosted,
618
talc- and amphibole-rich fault rocks in modern oceanic settings and ophiolite complexes: An
619
overview. Ofioliti 31, 129–140. https://doi.org/10.4454/ofioliti.v31i2.335
620
Bronner, A., Sauter, D., Munschy, M., Carlut, J., Searle, R., Cannat, M., Manatschal, G., 2014.