HAL Id: hal-00303915
https://hal.archives-ouvertes.fr/hal-00303915
Submitted on 28 Nov 2003
HAL is a multi-disciplinary open access archive for the deposit and dissemination of sci-entific research documents, whether they are pub-lished or not. The documents may come from teaching and research institutions in France or abroad, or from public or private research centers.
L’archive ouverte pluridisciplinaire HAL, est destinée au dépôt et à la diffusion de documents scientifiques de niveau recherche, publiés ou non, émanant des établissements d’enseignement et de recherche français ou étrangers, des laboratoires publics ou privés.
Observations of meteor-head echoes using the Jicamarca
50 MHz radar in interferometer mode
J. L. Chau, R. F. Woodman
To cite this version:
J. L. Chau, R. F. Woodman. Observations of meteor-head echoes using the Jicamarca 50 MHz radar in interferometer mode. Atmospheric Chemistry and Physics Discussions, European Geosciences Union, 2003, 3 (6), pp.6063-6091. �hal-00303915�
ACPD
3, 6063–6091, 2003 Meteor-head echoes over Jicamarca J. L. Chau and R. F. Woodman Title Page Abstract Introduction Conclusions References Tables Figures J I J I Back CloseFull Screen / Esc
Print Version Interactive Discussion
© EGU 2003
Atmos. Chem. Phys. Discuss., 3, 6063–6091, 2003 www.atmos-chem-phys.org/acpd/3/6063/
© European Geosciences Union 2003
Atmospheric Chemistry and Physics Discussions
Observations of meteor-head echoes
using the Jicamarca 50 MHz radar in
interferometer mode
J. L. Chau and R. F. Woodman
Radio Observatorio de Jicamarca, Instituto Geof´ısico del Per´u, Lima
Received: 1 October 2003 – Accepted: 11 November 2003 – Published: 28 November 2003 Correspondence to: J. L. Chau ([email protected])
ACPD
3, 6063–6091, 2003 Meteor-head echoes over Jicamarca J. L. Chau and R. F. Woodman Title Page Abstract Introduction Conclusions References Tables Figures J I J I Back CloseFull Screen / Esc
Print Version Interactive Discussion
© EGU 2003
Abstract
We present results of recent observations of meteor-head echoes obtained with the high-power large-aperture Jicamarca 50 MHz radar (11.95◦S, 76.87◦W) in an interfer-ometric mode. The large power-aperture of the system allows us to record more than 3000 meteors per hour in the small volume subtended by the 1◦ antenna beam, albeit 5
when the cluttering equatorial electrojet (EEJ) echoes are not present or are very weak. The interferometry arrangement allows the determination of the radiant (trajectory) and speed of each meteor. It is found that the radiant distribution of all detected meteors is concentrated in relative small angles centered around the Earth’s Apex as it transients over the Jicamarca sky, i.e. around the corresponding Earth heading for the particular 10
observational day and time, for all seasons observed so far. The dispersion around the Apex is ∼18◦in a direction transverse to the Ecliptic plane and only 8.5◦in heliocentric longitude in the Ecliptic plane both in the Earth inertial frame of reference. No appre-ciable interannual variability has been observed. Moreover, no population related to the optical (larger meteors) Leonid showers of 1998–2002 is found, in agreement with 15
other large power-aperture radar observations.
A novel cross-correlation detection technique (adaptive match-filtering) is used in combination with a 13 baud Barker phase-code. The technique allows us to get good range resolution (0.75 km) without any sensitivity deterioration for the same average power, compared to the non-coded long pulse scheme used at other radars. The 20
matching Doppler shift provides an estimation of the velocity within a pulse with the same accuracy as if a non-coded pulse of the same length had been used. The ve-locity distribution of the meteors is centered around 60 km s−1corresponding to veloc-ities slightly under the solar escape velocity (72 km s−1). Less than 8% of the veloci-ties correspond to interstellar speeds. Higher relative velocity accuracy is obtained by 25
cross-correlating the echoes from pulse-to-pulse, albeit with an ambiguous velocity dis-placement which cannot be resolved with the current observing technique. This higher relative accuracy allows the precise measurement of the deceleration of the meteors
ACPD
3, 6063–6091, 2003 Meteor-head echoes over Jicamarca J. L. Chau and R. F. Woodman Title Page Abstract Introduction Conclusions References Tables Figures J I J I Back CloseFull Screen / Esc
Print Version Interactive Discussion
© EGU 2003
as they enter the atmosphere. In addition, an independent radial velocity is determined from the derivative of the instantaneous position. Other statistical distributions of inter-est are also presented.
1. Introduction
High-power large-aperture radars frequently detect very fast meteor head echoes with 5
a range-rate velocity which follows the meteoroid as it travels through the upper atmo-sphere. Although meteor “head echoes” were first observed in the late 1940s, this topic has become an area of interest only recently as scientists have focused more intensely on the importance and usefulness of meteors (e.g.Chapin and Kudeki,1994;Mathews
et al.,1997;Zhou et al.,1998;Wannberg et al.,1996;Close et al.,2002a,b;Janches
10
et al.,2003). Head echo measurements give accurate radial velocities (along the radar line of sight) and altitude ranges of deposition. Measurements are also provided – with varying degrees of accuracy – for transverse velocities, deceleration rates, and signal strengths as a function of altitude. The powerful narrow-beam radars which measure head echoes detect far more and smaller meteors than do classical meteor radars (e.g. 15
Hocking et al.,2001). The use of these radars allows us to study the population of me-teors which probably contributes the most extraterrestrial material to the Earth’s upper atmosphere.
One of the main drivers for the increasing interest on meteor studies has been the presence in recent years of spectacular optical Leonid meteor showers. At Jicamarca 20
that was not an exception and meteor observations, particularly of head echoes, have been carried out since November 1998.
Meteor studies have been particularly difficult over Jicamarca due to the presence of very strong equatorial electrojet (EEJ) echoes (e.g.Farley,1985b) and non-specular trail echoes (e.g. Chapin and Kudeki, 1994). This geophysical “clutter” (for meteor 25
head echo studies) occur at similar altitudes where most head echoes are expected (between 90 and 12 km). Nonetheless, with the recent improvements of our acquisition
ACPD
3, 6063–6091, 2003 Meteor-head echoes over Jicamarca J. L. Chau and R. F. Woodman Title Page Abstract Introduction Conclusions References Tables Figures J I J I Back CloseFull Screen / Esc
Print Version Interactive Discussion
© EGU 2003
systems, we have started the head echo observations around sunrise times when there is not only an increase in the rate of meteor observations but also when EEJ echoes are expected to be weaker or sporadic.
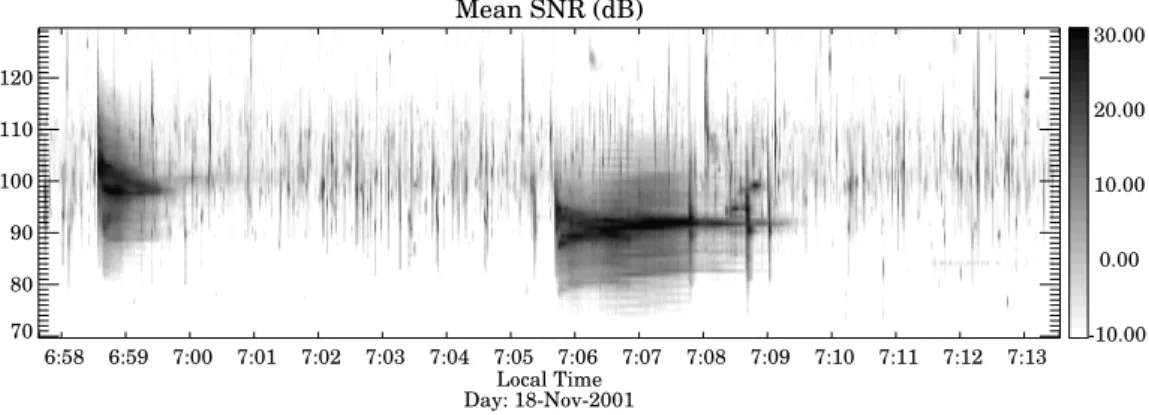
In Fig.1we show an example where meteor head echoes are observed at the same time when long-lived non-specular meteor trail echoes are present (around 06:59 and 5
07:06). All the striations in light gray represent head echoes (∼1 head-echo per sec-ond). Although in this work we discuss the head echo results, the long-lived (Chapin
and Kudeki, 1994) and the non-specular (Dyrud et al., 2002) meteor trails are being studied independently (M. Oppenheim personal communication).
As we show below, Jicamarca offers unique observations to the world-wide effort 10
of improving the understanding of the physical origin and orbits of the meteors. It has the lowest frequency of all the high-power large-aperture radars (50 Mhz), it is located under the magnetic equator (11.95◦S, 76.87◦W) and it is able to measure the three dimensional vector of head echoes by operating in the interferometer mode (e.g.
Woodman, 1971). The MU radar (34.85◦N, 136.11◦E) (Sato et al., 2000) and the 15
ALTAIR radar (9◦N, 167◦E) (Close et al.,2002a) are also able to determine the three dimensional vector velocity but both of them with smaller transmitting antennas.
Our paper is organized as follows. First we present a description of the experimental setup. Then we describe our technique, including the decoding process that allows us not only to improve the range resolution but also the meteor detection. In addition 20
we present the meteor characterization process. Results from Leonid and non-Leonid observations are presented and discussed, particularly related to their impact trajectory statistics. Finally we summarize our results and conclusions.
2. Experimental setup
Meteor-head observations have been made using the large Jicamarca array 25
(∼300 m×∼300 m) for transmission and all four quarter sections for reception (∼75 m×∼75 m). The same linear polarization (NE) has been used in both modes.
ACPD
3, 6063–6091, 2003 Meteor-head echoes over Jicamarca J. L. Chau and R. F. Woodman Title Page Abstract Introduction Conclusions References Tables Figures J I J I Back CloseFull Screen / Esc
Print Version Interactive Discussion
© EGU 2003
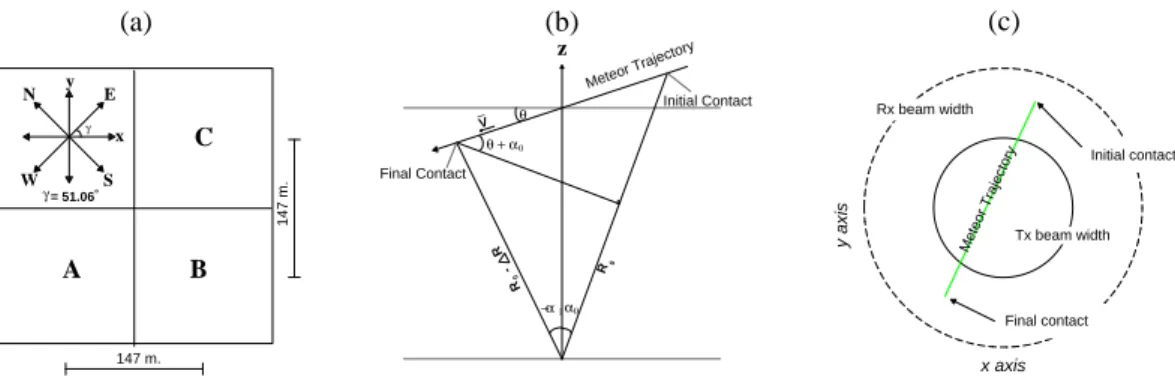
The antennas were phased to point on-axis, i.e. ∼−1.46◦ off-vertical in the y-direction (see Fig.2).
Although complex voltages (raw data) from four quarters were recorded, we only need the information of three non-collinear antennas in order to locate the meteors inside the transmitting beam. For the results we present in this paper, we have used 5
quarters A, C, and D to get the direction cosines of meteors respect to the x- and y-axis. Note that the x-axis is rotated with respect to the East-West baseline ∼51.06◦.
Figs. 2b and 2c show a simplified diagram of a meteor trajectory inside the illumi-nated beam as a vertical cut in the plane of the meteor trajectory and a plan view, respectively. The actual transmitting half-power beam width is ∼1◦.
10
The main radar parameters for the meteor mode are summarized in Table 1. We have used the full duty cycle available (5%) and a reasonable high range resolution by using a 13-bit Barker code (0.75 km baud).
3. Technique description
As it was mentioned in the introduction meteor-head echoes come from altitudes where 15
strong geophysical “clutter” due to EEJ and non-specular meteor trail echoes occur. Therefore, special observing and processing modes are needed to try to overcome this clutter. Our observing mode consists on (1) trying to operate when the EEJ echoes are absent or weak (e.g. around sunrise or during counter EEJ conditions), (2) using interferometry, (3) using pulse coding, and (4) recording raw data. The processing 20
mode is described below.
Once the raw data has been recorded, we proceed off-line to obtain the parameters of meteor-head echoes. We have divided our processing technique in three different stages: (a) decoding, (b) signal statistics and meteor detection, and (c) meteor char-acterization.
ACPD
3, 6063–6091, 2003 Meteor-head echoes over Jicamarca J. L. Chau and R. F. Woodman Title Page Abstract Introduction Conclusions References Tables Figures J I J I Back CloseFull Screen / Esc
Print Version Interactive Discussion
© EGU 2003
3.1. Decoding
Usually coded pulses are used in order to improve the range resolution without sac-rificing the maximum average power of the transmitter. In most applications, where the targets are quasi-stationary the decoding procedure is performed by correlating with the same code use for transmission (e.g.Farley,1985a). In the case of meteor-5
head echo observations, the large Doppler shift does not allow the use of a simple correlation with the transmitter pulse shape (e.g.Wannberg et al.,1996). Proper de-coding requires cross-correlating with the transmitter phase coded pulse but Doppler shifted by the radial velocity of the meteor. Since we are cross-correlating with the expected shape of the echo, we have actually an optimum cross-correlation detection 10
scheme. Nonetheless, the actual radial velocity of the meteor is not known, therefore one needs to perform a search. The search is performed by cross-correlating with dif-ferent Doppler shifts. The velocity that produces the optimum decoding is an estimate of the radial velocity of the meteor. Thus, the decoding is not only used for improving the range resolution but also for estimating the meteor radial velocities.
15
The expected range of radial velocities of meteor head echoes is very large, between 10 and 80 km/s. Normally a search within this range would be a lengthy procedure. A way around this is to use a traditional pulse-to-pulse method, as used in most coherent scatter applications. This technique would normally produce a more accurate velocity estimate because of the larger time span involved. Indeed it does, but for several dis-20
crete ambiguous values, but not as many as the complete range of continuous possible velocities mentioned above.
The approach we have used is a combination of both. A search is made with the few discrete velocities obtained from the pulse-to-pulse technique and the one that produces maximum correlation is selected for each raw data profile. If the uncer-25
tainty in defining the maximum correlation is small enough to discriminate between adjacent ambiguous velocities, the technique would produce velocities as accurate as those obtained with the pulse-to-pulse technique, and at the same time a proper
ve-ACPD
3, 6063–6091, 2003 Meteor-head echoes over Jicamarca J. L. Chau and R. F. Woodman Title Page Abstract Introduction Conclusions References Tables Figures J I J I Back CloseFull Screen / Esc
Print Version Interactive Discussion
© EGU 2003
locity for optimum decoding. Unfortunately, for the IPP we have used, i.e. a Nyquist limit of ±1.5 km s−1, the uncertainty in the maximum correlation does not allow us to discriminate between the two unambiguous possible values which produce the two maximum values. As a consequence, the accuracy achieved is that of the maximum cross-correlation technique. We plan to use in the future much shorter and aperiodic 5
IPPs to better exploit the more accurate velocities obtained with multiple-pulse tech-niques.
Another way to determine the velocity is by using a long pulse (e.g. Sato et al.,
2000;Janches et al.,2003). However, this approach is not suitable at Jicamarca due to the presence of geophysical clutter at similar altitudes. Our approach, i.e. coded 10
long pulse, has comparable sensitivity and Doppler velocity accuracy as the non-coded long-pulse. As we mentioned above, much better velocity accuracy is obtained from the pulse-to-pulse measurements which we have used to get the decelerations.
Barker decoding, including the proper Doppler correction mentioned above, pro-duces range sidelobes of −22 dB respect to the mainlobe. It is possible to reduce 15
the magnitude of the sidelobes by additional filtering at the expense of spreading the sidelobe contamination into more ranges. We have used a second filter on the decoded raw data profiles to decrease further the peak to sidelobe levels (from −22 dB to less than −32 dB) (e.g.Rihaczek and Golden,1971). This second filter is needed in order improve the discrimination between head and the geophysical clutter, i.e. meteor trail 20
and EEJ echoes.
3.2. Signal statistics and meteor detection
Once the Doppler velocity for optimum decoding (vopt(t)) is found, the raw voltages (Vi) for each of the channels i is decoded. Then, the following signal statistics are recorded along with vopt(t) for later processing,
25
ρi ,j(r, t : 0) for i , j = 0, 1, 2, 3 (1)
ACPD
3, 6063–6091, 2003 Meteor-head echoes over Jicamarca J. L. Chau and R. F. Woodman Title Page Abstract Introduction Conclusions References Tables Figures J I J I Back CloseFull Screen / Esc
Print Version Interactive Discussion
© EGU 2003
where ρi ,j(r, t : τ)=<Vi(r, t)Vj∗(r, t+τ)> is the cross-correlation between complex chan-nels corresponding to antennas i and j at range r and delay τ, <> represents em-semble averages of 4 (3) IPPs for τ=0 (τ=1 IPP) in this work. As we show later, the statistics at τ6=0 (equal to one IPP) are used to calculate a pulse-to-pulse Doppler velocity with good accuracy, but ambiguous.
5
Once all the signal statistics are recorded (needed for careful processing of meteor trail echoes), we proceed by finding the range (rp) where the power is maximum for each profile (“peak”). Then, the peak signal statistics of probable head echoes are recorded, i.e. ρi ,j(rp, t : 0), ρi ,i(rp, t : τ), vopt(t), in addition to rp(t).
3.3. Meteor characterization 10
Working with the peak signal statistics is much faster than working with the raw data, allowing us to test and implement robust algorithms for meteor characterization. Given the large number of head echoes, we have implemented an algorithm that is based on our experience after observing many of them very carefully. For example, among other criteria, we do not consider meteors moving away from the radar, or with positive 15
radial accelerations. A probable meteor-head echo has to be present for a minimum time interval in order to be considered. At this point, our approach has been very conservative in the sense that if a head echo is not well defined, then it is rejected. For example, we have observed cases where two or more head echoes are present at the same time but at different ranges, in such cases, we reject all of them since a more 20
intelligent algorithm is needed to characterize them. After this rejection process, we are observing ∼3000 meteor heads per hour.
From the peak signal statistic recorded we obtained directly the following meteor parameters:
1. Initial range (R0) 25
ACPD
3, 6063–6091, 2003 Meteor-head echoes over Jicamarca J. L. Chau and R. F. Woodman Title Page Abstract Introduction Conclusions References Tables Figures J I J I Back CloseFull Screen / Esc
Print Version Interactive Discussion
© EGU 2003
3. Duration of meteor event (∆t) 4. Mean signal-to-noise ratio (SNR)
5. Radial velocity (vr). This parameter is measured using three independent meth-ods: (a) from the first moment of the pulse-to-pulse statistics (vra), (b) from fitting a straight line (range versus time) of the meteor trajectory (vrb), (b) from the aver-5
age voptalong the observable meteor trajectory (vrc).
As we mentioned above, the radial velocity from pulse-to-pulse is ambiguous be-cause of the relatively long sampling period used (Nyquist theorem), however, it has very small uncertainties (e.g.Woodman,1985).
The correlation between the last two methods (vrb vs. vrc) is very high (>0.92) 10
but there is a bias that varies between 2 and 6 km s−1 (vrb<vrc) that we still do not understand its origin. Below we will use vrc for vr, and vra to get the radial accelerations.
6. Radial deceleration (ar). This parameter is obtained from the pulse-to-pulse radial velocity by fitting a line to vraversus time.
15
7. Azimuth (φ) and angular coverage (∆α). Using interferometry on the cross-correlation statistics between antennas, we have calculated the direction cosines (θx, θy) of the meteor position at any given time with respect to the x- and y-directions. Then, the azimuth direction is obtained, again, by fitting a constant azimuth line to the set of points (θx, θy) corresponding to different times. The 20
angular coverage (∆α = α0+ α1in Fig.2b) is also obtained from this analysis. In addition, we have derived the following parameters from the more direct ones enumerated above:
ACPD
3, 6063–6091, 2003 Meteor-head echoes over Jicamarca J. L. Chau and R. F. Woodman Title Page Abstract Introduction Conclusions References Tables Figures J I J I Back CloseFull Screen / Esc
Print Version Interactive Discussion
© EGU 2003
observed!) is given by,
θ≈ arctan ∆R
R0∆α. (3)
Here small angle approximations are used given the very narrow transmitting beam.
2. Absolute velocity (|v |). It is obtained from the radial velocity and the elevation 5
angle (|v | ∼ vr/ sin θ)
3. Absolute acceleration (|a|). As in the case of the velocity, the radar measures the radial component. Again using the small angle approximation and the geometry presented in Fig.2b, the absolute acceleration is given by
|a| ≈ ar+|v|∆α cos θ
∆t . (4)
10
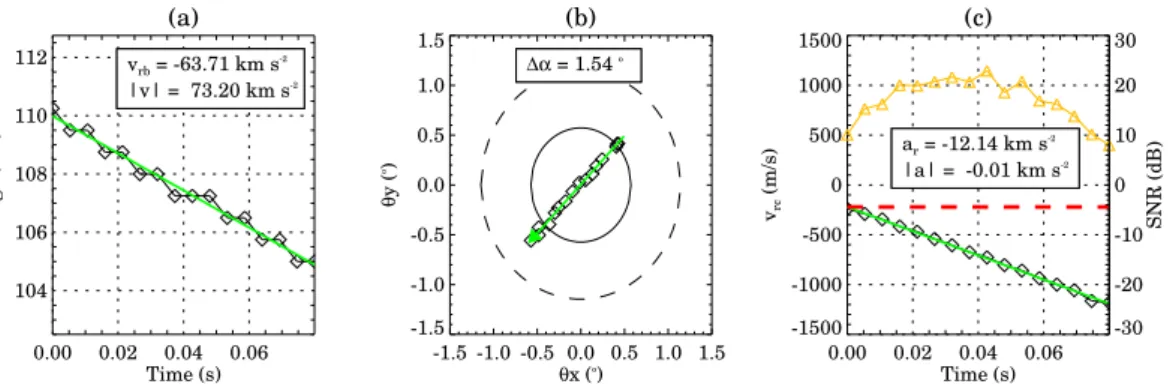
The second term comes from an apparent deceleration due to a range reduction during the meteor trajectory while it is illuminated, and which has to be corrected. In Fig. 3 we show a typical example of how the different parameters are obtained from the (a) range vs. time diagram, (b) θxvs. θy, and (c) pulse-to-pulse radial velocity (vrc) vs. time. In all three panels the fitted lines are represented in green. Fig. 3c 15
also shows the SNR along the meteor trajectory in orange (scale on the right axis) and a line with a slope equal to the absolute acceleration in red. The absolute and radial accelerations are indicated inside the box. In this particular case, we present the result of simulated meteor echo with parameters similar to most of our meteors observations (e.g. altitudinal, time, and angular coverage) and with constant velocity 20
along its trajectory. Note that |a|=0 as we expected.
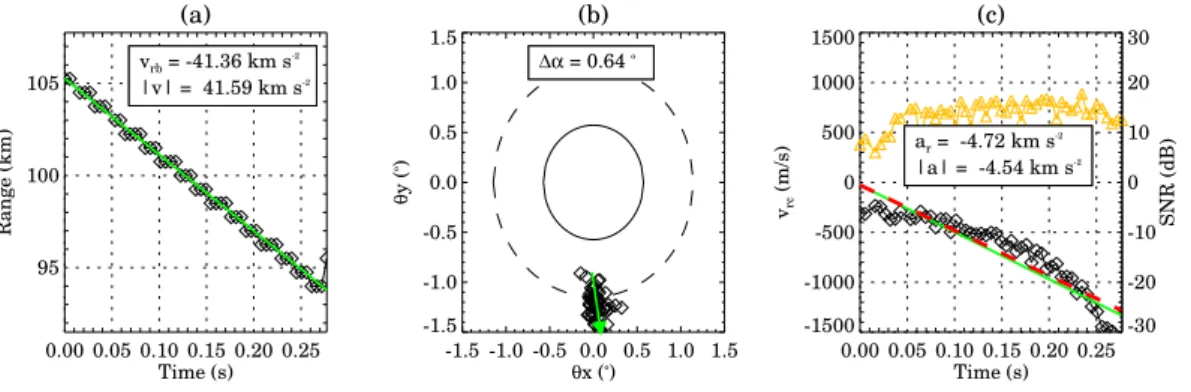
The great majority of our meteor observations present similar ballistic characteristics to the example shown in Fig.3. In Fig.4we show a real event where the meteor lasted
ACPD
3, 6063–6091, 2003 Meteor-head echoes over Jicamarca J. L. Chau and R. F. Woodman Title Page Abstract Introduction Conclusions References Tables Figures J I J I Back CloseFull Screen / Esc
Print Version Interactive Discussion
© EGU 2003
much longer (∼250 ms) and present a non-constant deceleration (note the exponential decay) with respect to the example shown in Fig. 3. Probably the non-constant de-celerations is due to the exponentially increasing atmospheric density and decreasing velocity, coupled with the shape and composition of the meteor itself. In this work we have omitted these peculiar observations by limiting the fitting errors to small numbers. 5
However, they are interesting cases and will be treated in detail in a future work.
4. Leonid vs. non-Leonid radar observations
In this section we present the observations of 19 November 2002, when a Leonid shower occurred, and those from 25 February 2003 as a control day, sufficiently far from the shower event. Although, we have performed this type of observations around 10
Leonid showers since 1998, the characteristics of these previous events, as far as the radar observations, are well represented by the November 2002 observations.
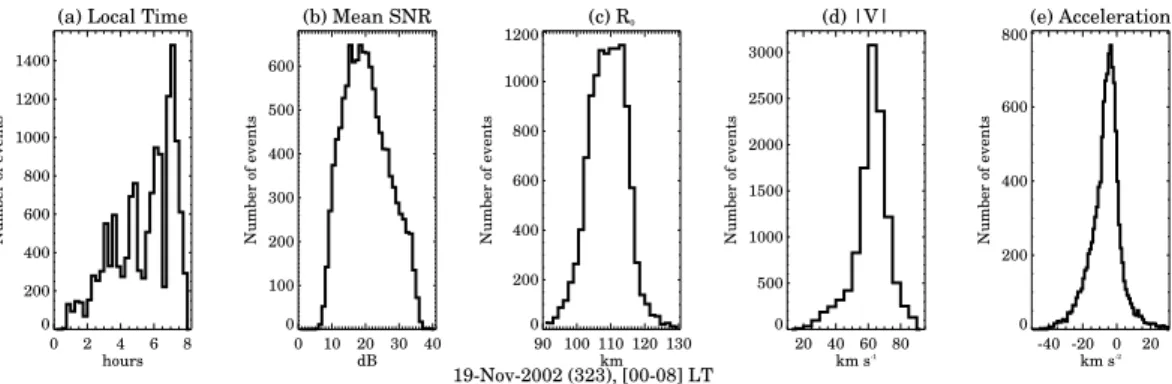
In Fig. 5 histograms of different parameters are shown for the Leonid night of 19 November 2002, (a) time distribution, (b) mean SNR of meteor trajectory, (c) initial range (R0), (d) absolute velocity (|v |), and (f) absolute acceleration (|a|). In Fig.6similar 15
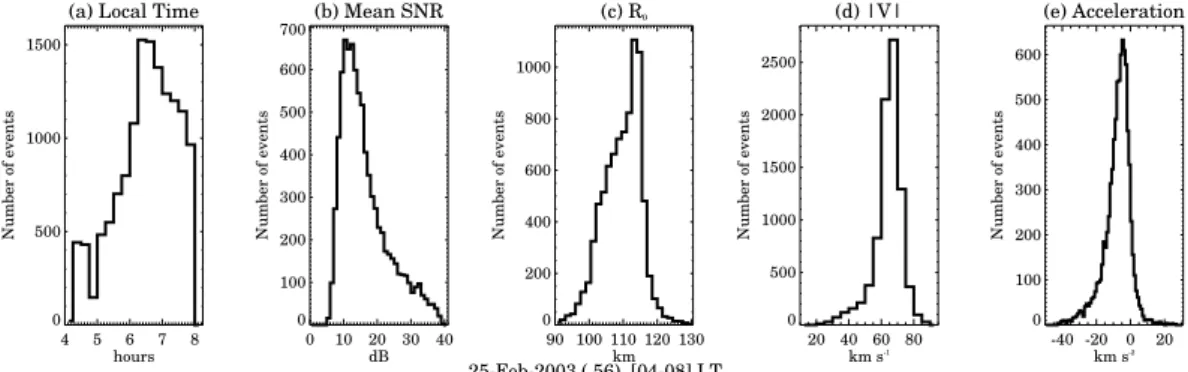
distributions are presented for the control day of 25 February 2003.
In general, these parameters that are usually measured by other large power-aperture radars, show similar characteristics during both days: (a) occurring around 110 km, (b) mean absolute velocities are very high around 60 km s−1, (c) similar SNR distributions, and (d) similar deceleration distributions. Nonetheless, these distributions 20
are slightly different than the distributions obtained with other radars. For example, (a) our head echoes occur at higher altitudes than those observed with the Arecibo (Janches et al.,2003) and ALTAIR (Close et al.,2002a) radars; (2) we do not observe a pronounced bimodal velocity distribution (Janches et al.,2003). These differences as well as the significant number of interstellar meteors (<8%), i.e. meteors with velocities 25
greater than 72 km s−1, are currently under study.
ACPD
3, 6063–6091, 2003 Meteor-head echoes over Jicamarca J. L. Chau and R. F. Woodman Title Page Abstract Introduction Conclusions References Tables Figures J I J I Back CloseFull Screen / Esc
Print Version Interactive Discussion
© EGU 2003
have been mentioning throughout this paper, meteor observations have been hard in the past due to the presence of strong EEJ echoes. The lack of a smooth time distribution of both days (e.g. around 05:00 LT in Fig. 6) is due to the presence of strong sporadic EEJ echoes. In any case, the maxima should be close to the actual rates, so a smooth envelope tangential to the maxima should be closer to the actual 5
one. We plan to get a more precise time distribution in the near future, by performing similar observations over continuous days expecting that the meteor characteristics will remain almost constant during those days while the EEJ echoes will appear at different local times.
As we mentioned in the Introduction, we were motivated by the expected spectacular 10
Leonid showers. We were hoping to contribute further knowledge on the nature of the showers with our unique observing system and geographic location. Meteors belong-ing to the Leonid showers are expected to have a velocity distribution around 70 km s−1 and a radiant clustered around a point in the Leo constellation (∼10h8’ hour angle and ∼22◦ declination) with a small angular dispersion. As it can be seen from Figs.5d and 15
6d, we do not observe an expected distribution enhancement with the aforementioned characteristics during the Leonid night, moreover both days show a very similar velocity distributions.
In order to see better if the meteors were coming from the expected radiant, we have plotted the elevation and azimuth parameters in a two-dimensional graph. We 20
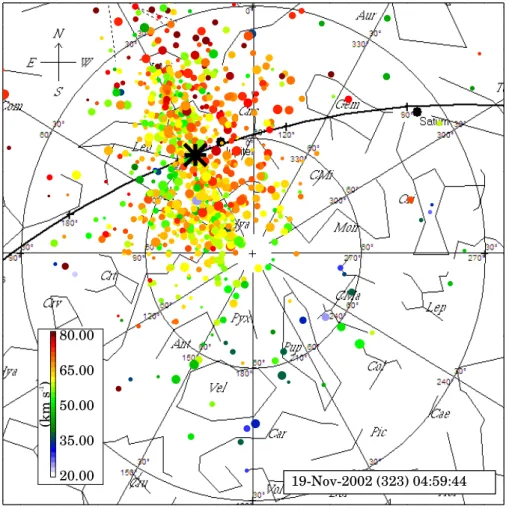
have integrated this information into a conventional sky map plot commonly used by Astronomers. In Fig.7 we show a sky map distribution of meteor radiants, based on their vector velocity, around 05:00 LT on 19 November 2002. The background map shows the sky above Jicamarca (±30◦elevation) moving from left (East) to right (West) as time advances. The solid black curve represents the Ecliptic plane projected into 25
the Celestial sphere and the thick asterisk represents the Earth Apex. For reference, the names of the visible constellations are also indicated. The radiant, i.e. where the meteors are coming from and not where the meteors are seen in the illuminated beam, are plotted with circles. The color of the circles represents their absolute velocity (see
ACPD
3, 6063–6091, 2003 Meteor-head echoes over Jicamarca J. L. Chau and R. F. Woodman Title Page Abstract Introduction Conclusions References Tables Figures J I J I Back CloseFull Screen / Esc
Print Version Interactive Discussion
© EGU 2003
color-coded bar in the figure) while the size is proportional to the SNR. With this type of map, we could be able to determine if a meteor shower is observed if meteors are clustered at their expected radiant and if they show their expected velocity (color).
As it can be observed, the great majority of meteors are coming from the Apex at 05:00 LT. Similar result, with an increased number of meteors, is also observed around 5
07:00 LT in Fig.8.
Note that the Leo constellation is located very close to the Apex. At the beginning we thought that all the meteors were coming from Leonid, however we observed similar results on our control days taken few days after Leonid (not shown here). These results were puzzling until we conducted the February observations, well beyond the Leonid 10
night.
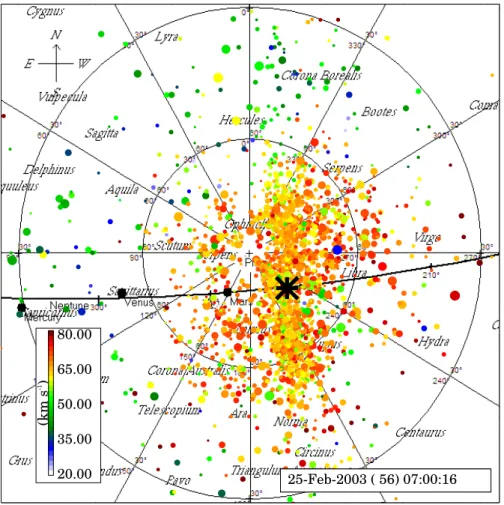
The sky map distribution for the control day is shown in Fig.9. Again the majority of meteors, which have very similar statistical characteristics to those observe during the Leonid night, are clustered around the Apex.
The picture that emerged from these observations is that the meteors detected by our 15
radar are always clustered around the Apex and that the Leonid radiant happened to be within the same region during the November observations. In addition, there was no measurable increase in the total meteor population during the meteor shower, not even when a smaller region around the optical radiant and with the expected velocity was considered. Moreover, the velocity distribution did not show any increase of population 20
at the expected velocity of the meteor shower. Therefore, for all practical purposes, we can ignore the existence of the Leonid shower on 19 November 2002 and take our results as those corresponding to the season. Similar results were also observed in November 2001 (not shown here) indicating that there is no annual variability, at least, between November 2001 and November 2002.
25
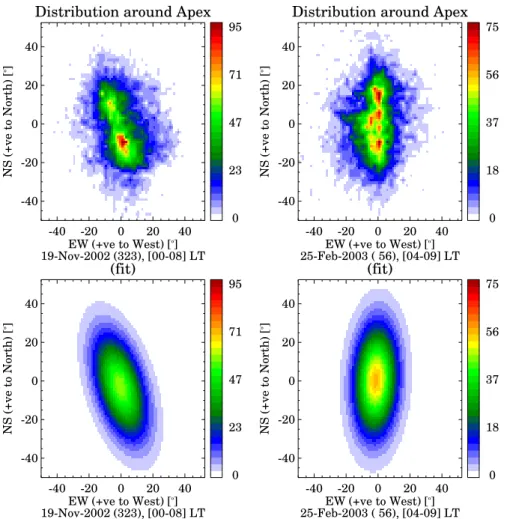
We have shown that majority echoes come from the Apex at different times during the same day and at different seasons. In order to save space and simplify our pre-sentation, in Fig. 10 we show bivariate angular velocity distributions (East-West vs. North-South) with respect to the Apex location for the Leonid night and control day.
ACPD
3, 6063–6091, 2003 Meteor-head echoes over Jicamarca J. L. Chau and R. F. Woodman Title Page Abstract Introduction Conclusions References Tables Figures J I J I Back CloseFull Screen / Esc
Print Version Interactive Discussion
© EGU 2003
Knowing where the Apex occurs at a given time, we have removed the Apex vector location from the vector radiant of meteors, i.e. we have plotted their velocity direction relative to the Apex in the same set of coordinates as in the sky maps (NS and EW angles).
In addition, we have fitted a two-dimensional Gaussian function to the bivariate dis-5
tributions (bottom panels). Note that the distributions are oriented as expected from Figs.7,8and9. The orientation depends on the position of the Ecliptic plane.
The main parameters of these distributions are presented in Table2. The rotation an-gle of the fitted distributions represents the rotation of the minor axis respect to the EW axis (positive counter clockwise). There is very good agreement between the widths of 10
the Leonid night and control day distributions. Furthermore, the rotation angles agree with the axis of the Ecliptic plane. Our results can be taken as the distribution of the meteors for the epochs selected (similar results have been obtained also in June and August 2003, not shown here). The Leonid population appear to affect only the large meteors which are visible optically and which seldom cross our 1◦beam.
15
Therefore our results indicates that the velocity distribution of meteors respect to the Earth’s frame of reference is clustered around the Earth Apex, within ±18◦ trans-verse to the Ecliptic and narrow (±8.5◦) in heliocentric longitude in the Ecliptic plane, independent of season.
By removing the Earth velocity around the Sun (∼29.8 km s−1) the mean widths of 20
the velocity distributions almost doubles (e.g. from 8.88◦ to 15.23◦ and from 18.05◦ to 32.00◦ for the November event) and remain clustered around the Apex moving on a retrograde direction.
Although Jicamarca is one of the few radars able to determine the three-dimensional velocity vector, we think our results can be extrapolated to other latitudes and possibly 25
to radars working at other frequencies. For example, the recent observations done with the Arecibo radar using two beams (Janches et al.,2003) are in excellent agreement with our results and the interpretation has to be worked out accordingly. Moreover, even when much narrower beams are used, one has to be aware that the majority of meteors
ACPD
3, 6063–6091, 2003 Meteor-head echoes over Jicamarca J. L. Chau and R. F. Woodman Title Page Abstract Introduction Conclusions References Tables Figures J I J I Back CloseFull Screen / Esc
Print Version Interactive Discussion
© EGU 2003
are probably coming from the Apex, as in our case, and therefore not necessarily coming along the beam as assumed byMathews et al. (1997). Knowing the source, we have been able to correct significantly our radial acceleration which in turn has implication on the controversial radar measurements of meteor mass flux (Mathews
et al.,2001). 5
5. Summary and conclusions
As it has been shown in previous sections, we have successfully implemented a tech-nique to observe and characterize meteor head echoes at equatorial latitudes. The use of the large power-aperture capabilities at Jicamarca has allowed us to observe a high rate of meteors (more than 3000 per hour) in the small volume subtended by the 1◦ 10
antenna-beam. Moreover, using interferometry, we have been able to characterize the three-dimensional components of meteor velocities in the Earth’s frame of reference.
Our results do not show any evidence of the Leonid meteor showers, in agreement to result reported by other large power-aperture radars (e.g. Janches et al., 2000;
Pellinen-Wannberg et al., 1998; Sato et al.,2000). We have shown that meteor pa-15
rameters during both Leonid night and a control day are statistically similar (range of occurrence, velocity distribution, deceleration distribution, origin). Apparently, we de-tect only the very small sporadic meteors, which are much more abundant than the larger meteors associated with major meteor showers optically observed and which seldom cross the 1◦antenna beam.
20
Besides providing meteor-head observations at a unique frequency (50 MHz) and location (equatorial latitudes), our results are particularly important for the 3D charac-terization of meteor heads. We have shown, at different seasons with negligible annual variation, that the velocity distribution of meteors respect to the Earth’s frame of ref-erence is clustered around the Earth Apex, within ±18◦ transverse to the Ecliptic and 25
narrow (±8.5◦) in heliocentric longitude in the Ecliptic plane. A change to a solar inertial frame of reference, roughly double the widths of these distributions, since most of the
ACPD
3, 6063–6091, 2003 Meteor-head echoes over Jicamarca J. L. Chau and R. F. Woodman Title Page Abstract Introduction Conclusions References Tables Figures J I J I Back CloseFull Screen / Esc
Print Version Interactive Discussion
© EGU 2003
meteors have a relative velocity (retrograde direction) which is about twice the orbital velocity of the Earth. The velocity representation in heliocentric coordinates including the gravitational attraction as well as its orbital distribution will be left for a future effort. So far, our observations have been concentrated around sunrise times when the EEJ echoes are expected to be absent or weak. In the future, we plan to extend our 5
observations to other times, particularly during daytime counter electrojet conditions when EEJ are also expected to be weak. Moreover, we plan to continue improving the technique in order to get better time coverage as well as more precise parameters.
Acknowledgements. We thank D. Janches, M. Oppenheim, T. Sato, M. Sulzer, and Q. Zhou for their fruitful comments and suggestions in early stages of this work. We thank the Jicamarca 10
staff for performing the observations, particularly M. Milla for helping with the processing and analysis. The Jicamarca Radio Observatory is operated by the Instituto Geof´ısico del Per´u, with support from the NSF Cooperative Agreement ATM-9911209 through Cornell University.
References
Chapin, E. and Kudeki, E.: Radar interferometric imaging studies of long-duration meteor 15
echoes observed at Jicamarca, J. Geophys. Res., 99, 8937–8949, 1994. 6065,6066 Close, S., Hunt, S. M., McKeen, F. M., and Minardi, M. J.: Characterization of Leonid meteor
head echo data collected using the VHF-UHF advanced reserach projects agency long-range tracking and instrumentation radar (ALTAIR), Radio Sci., 37, 10.1029/2000RS002 602, 2002a. 6065,6066,6073
20
Close, S., Oppeheim, M., Hunt, S., and Dyrud, L.: Scattering characteristics of
hig-resolution meteor head echoes detected at multiple frequencies, J. Geophys. Res., 107,
10.1029/2002JA009 253, 2002b. 6065
Dyrud, L. P., Oppeneheim, M., Close, S., and Hunt, S.: Interpretation of non-specular radar meteor trails, Geophys. Res. Lett., 29, 10.1029/2002GL015 953, 2002. 6066
25
Farley, D. T.: On-line data processing techniques for MST radars, Radio Sci., 20, 1177–1184, 1985a.
ACPD
3, 6063–6091, 2003 Meteor-head echoes over Jicamarca J. L. Chau and R. F. Woodman Title Page Abstract Introduction Conclusions References Tables Figures J I J I Back CloseFull Screen / Esc
Print Version Interactive Discussion
© EGU 2003
Farley, D. T.: Theory of equatorial electrojet plasma waves: New developments and current status, J. Atmos. Sol. Terr. Phys., 47, 729–744, 1985b. 6068 6065
Hocking, W. K., Fuller, B., and Vandepeer, B.: Real-time determination of meteor-related pa-rameters utilizing modern digital technology, J. Atmos. Sol. Terr. Phys., 63, 155–169, 2001. 6065
5
Janches, D., Mathews, J. D., Meisel, D. D., and Zhou, Q. H.: Micrometeor observations using the Arecibo 430 MHz radar i. determination of ballistic paramater from measured Doppler velocity and deceleration results, Icarus, 145, 10.1006/icar.1999.6330, 2000. 6077
Janches, D., Nolan, M. C., Meisel, D. D., Mathews, J. D., Zhou, Q. H., and Moser, D. E.: On the geocentric micrometeor velocity distribution, J. Geophys. Res., 108, 10
10.1029/2002JA009 789, 2003. 6065,6069,6073,6076
Mathews, J. D., Meisel, D. D., Kunter, K. P., Getman, V. S., and Zhou, Q. H.: Very high resolu-tion studies of micrometeors using the Arecibo 430 MHz radar, Icarus, 126, 157–169, 1997. 6065,6077
Mathews, J. D., Janches, D., Meisel, D. D., and Zhou, Q. H.: The micro-meteoroid mass flux 15
into the upper atmosphere: Arecibo results and a comparison with prior estimates, Geo-phys. Res. Lett., 28, 1929–1932, 2001. 6077
Pellinen-Wannberg, A., Westman, A., Wannberg, G., and Kaila, K.: Meteor fluxes and visual magnitudes from EISCAT radar event rates: A comparison with cross-section based magni-tudes estimates and optical data, Ann. Geophysicae, 116, 1475–1485, 1998. 6077
20
Rihaczek, A. W. and Golden, G. M.: Range sidelobe suppression fro barker codes, IEEE Trans. Aerosp. Electron Sys., AES-7, 1087–1092, 1971. 6069
Sato, T., Nakamura, T., and Nishimura, K.: Orbit determination of meteors using the MU radar, IEICE Trans. Commun., E83-B, 1990–1995, 2000. 6066,6069,6077
Wannberg, G., Pellinen-Wannberg, A., and Westman, A.: An ambiguity-fuction-based method 25
for anlaysis of doppler decompressed radar signals applied to EISCAT measurements of oblique UHF-VHF meteor echoes, Radio Sci., 31, 497–518, 1996. 6065,6068
Woodman, R. F.: Inclination of the geomagnetic field measured by an incoherent scatter tech-nique, J. Geophys. Res., 76, 178–184, 1971. 6066
Woodman, R. F.: Spectral moment estimation in MST radars, Radio Sci., 20, 1185–1195, 1985. 30
6071
Zhou, Q. H., Perillat, P., Cho, J. Y. N., and Mathews, J. D.: Simultaneous meteor echo observa-tions by large aperture VHF and UHF radars, Radio Sci., 33, 1641–1654, 1998. 6065
ACPD
3, 6063–6091, 2003 Meteor-head echoes over Jicamarca J. L. Chau and R. F. Woodman Title Page Abstract Introduction Conclusions References Tables Figures J I J I Back CloseFull Screen / Esc
Print Version Interactive Discussion
© EGU 2003 Table 1. Radar parameters for observing meteor-head echoes at Jicamarca.
Parameter Value Units
Inter pulse period (IPP) 200 km
Pulse width 9.75 km
Barker code 13
Sampling rate 0.75 km
Initial range 70 km
Number of samples 92
Number of complex channels 4
ACPD
3, 6063–6091, 2003 Meteor-head echoes over Jicamarca J. L. Chau and R. F. Woodman Title Page Abstract Introduction Conclusions References Tables Figures J I J I Back CloseFull Screen / Esc
Print Version Interactive Discussion
© EGU 2003 Table 2. Main parameters of angular velocity distribution around the Apex.
Parameter Leonid night Control day
Date 19 November 2002 25 February 2003
Period 00:00–08:00 LT 04:00–09:00 LT Mean EW 0.08◦ 0.78◦ Mean NS −2.25◦ 1.11◦ Minor axis 8.88◦ 8.46◦ Major axis 18.05◦ 17.92◦ Rotation respect to EW 21.11◦ −3.28◦
ACPD
3, 6063–6091, 2003 Meteor-head echoes over Jicamarca J. L. Chau and R. F. Woodman Title Page Abstract Introduction Conclusions References Tables Figures J I J I Back CloseFull Screen / Esc
Print Version Interactive Discussion
© EGU 2003
Chau and Woodman: Meteor-head echoes over Jicamarca 3
6:58 6:59 7:00 7:01 7:02 7:03 7:04 7:05 7:06 7:07 7:08 7:09 7:10 7:11 7:12 7:13 Local Time 70 80 90 100 110 120 Range (km) Mean SNR (dB) Day: 18-Nov-2001 -10.00 0.00 10.00 20.00 30.00
Fig. 1. Range-time intensity plot of meteor echoes. Head echoes are represented by the vertical gray striations (∼1 per second). Examples of long-lived meteor trails occur around 0659 and 0706 LT
Meteor TrajectoryTx beam width
Rx beam width Initial contact Final contact x axis y axis (c) (b) z Initial Contact Final Contact Meteor Trajectory V _ R0 R - R 0 θ θ + α0 α0 −α1 147 m. 147 m. N W x y S E A B C = 51.06o (a) γ γ
Fig. 2. (a) Antenna configuration for interferometric observations of meteors, note that the x axis is rotated with respect to the East-West
baseline ∼ 51.06◦. Simplified geometry of a meteor trajectory respect to the illuminated beam: (b) altitudinal and (c) horizontal views.
1996). Proper decoding requires cross-correlating with the transmitter phase coded pulse but Doppler shifted by the ra-dial velocity of the meteor. Since we are cross-correlating with the expected shape of the echo, we have actually an op-timum cross-correlation detection scheme. Nonetheless, the actual radial velocity of the meteor is not known, therefore one needs to perform a search. The search is performed by cross-correlating with different Doppler shifts. The velocity that produces the optimum decoding is an estimate of the ra-dial velocity of the meteor. Thus, the decoding is not only used for improving the range resolution but also for estimat-ing the meteor radial velocities.
The expected range of radial velocities of meteor head echoes is very large, between 10 and 80 km/s. Normally a search within this range would be a lengthy procedure. A way around this is to use a traditional pulse-to-pulse method, as used in most coherent scatter applications. This technique would normally produce a more accurate velocity estimate because of the larger time span involved. Indeed it does, but for several discrete ambiguous values, but not as many as the complete range of continuous possible velocities mentioned
above.
The approach we have used is a combination of both. A search is made with the few discrete velocities obtained from the pulse-to-pulse technique and the one that produces max-imum correlation is selected for each raw data profile. If the uncertainty in defining the maximum correlation is small enough to discriminate between adjacent ambiguous veloc-ities, the technique would produce velocities as accurate as those obtained with the pulse-to-pulse technique, and at the same time a proper velocity for optimum decoding. Unfor-tunately, for the IPP we have used, i.e., a Nyquist limit of ± 1.5kms−1
, the uncertainty in the maximum correlation does not allow us to discriminate between the two unambiguous possible values which produce the two maximum values. As a consequence, the accuracy achieved is that of the maximum cross-correlation technique. We plan to use in the future much shorter and aperiodic IPPs to better exploit the more accurate velocities obtained with multiple-pulse techniques.
Another way to determine the velocity is by using a long pulse (e.g., Sato et al., 2000; Janches et al., 2003). How-ever, this approach is not suitable at Jicamarca due to the
Fig. 1. Range-time intensity plot of meteor echoes. Head echoes are represented by the
vertical gray striations (∼1 per second). Examples of long-lived meteor trails occur around 06:59 and 07:06 LT.
ACPD
3, 6063–6091, 2003 Meteor-head echoes over Jicamarca J. L. Chau and R. F. Woodman Title Page Abstract Introduction Conclusions References Tables Figures J I J I Back CloseFull Screen / Esc
Print Version Interactive Discussion
© EGU 2003
Chau and Woodman: Meteor-head echoes over Jicamarca 3
6:58 6:59 7:00 7:01 7:02 7:03 7:04 7:05 7:06 7:07 7:08 7:09 7:10 7:11 7:12 7:13 Local Time 70 80 90 100 110 120 Range (km) Mean SNR (dB) Day: 18-Nov-2001 -10.00 0.00 10.00 20.00 30.00
Fig. 1. Range-time intensity plot of meteor echoes. Head echoes are represented by the vertical gray striations (∼1 per second). Examples of long-lived meteor trails occur around 0659 and 0706 LT
Meteor TrajectoryTx beam width
Rx beam width Initial contact Final contact x axis y axis (c) (b) z Initial Contact Final Contact Meteor Trajectory V _ R0 R - R 0 θ θ + α0 α0 −α1 147 m. 147 m. N W x y S E A B C = 51.06o (a) γ γ
Fig. 2. (a) Antenna configuration for interferometric observations of meteors, note that the x axis is rotated with respect to the East-West
baseline ∼ 51.06◦. Simplified geometry of a meteor trajectory respect to the illuminated beam: (b) altitudinal and (c) horizontal views.
1996). Proper decoding requires cross-correlating with the transmitter phase coded pulse but Doppler shifted by the ra-dial velocity of the meteor. Since we are cross-correlating with the expected shape of the echo, we have actually an op-timum cross-correlation detection scheme. Nonetheless, the actual radial velocity of the meteor is not known, therefore one needs to perform a search. The search is performed by cross-correlating with different Doppler shifts. The velocity that produces the optimum decoding is an estimate of the ra-dial velocity of the meteor. Thus, the decoding is not only used for improving the range resolution but also for estimat-ing the meteor radial velocities.
The expected range of radial velocities of meteor head echoes is very large, between 10 and 80 km/s. Normally a search within this range would be a lengthy procedure. A way around this is to use a traditional pulse-to-pulse method, as used in most coherent scatter applications. This technique would normally produce a more accurate velocity estimate because of the larger time span involved. Indeed it does, but for several discrete ambiguous values, but not as many as the complete range of continuous possible velocities mentioned
above.
The approach we have used is a combination of both. A search is made with the few discrete velocities obtained from the pulse-to-pulse technique and the one that produces max-imum correlation is selected for each raw data profile. If the uncertainty in defining the maximum correlation is small enough to discriminate between adjacent ambiguous veloc-ities, the technique would produce velocities as accurate as those obtained with the pulse-to-pulse technique, and at the same time a proper velocity for optimum decoding. Unfor-tunately, for the IPP we have used, i.e., a Nyquist limit of ± 1.5kms−1, the uncertainty in the maximum correlation does not allow us to discriminate between the two unambiguous possible values which produce the two maximum values. As a consequence, the accuracy achieved is that of the maximum cross-correlation technique. We plan to use in the future much shorter and aperiodic IPPs to better exploit the more accurate velocities obtained with multiple-pulse techniques.
Another way to determine the velocity is by using a long pulse (e.g., Sato et al., 2000; Janches et al., 2003). How-ever, this approach is not suitable at Jicamarca due to the
Fig. 2. (a) Antenna configuration for interferometric observations of meteors, note that the
x-axis is rotated with respect to the East-West baseline ∼51.06◦. Simplified geometry of a meteor trajectory respect to the illuminated beam:(b) altitudinal and (c) horizontal views.
ACPD
3, 6063–6091, 2003 Meteor-head echoes over Jicamarca J. L. Chau and R. F. Woodman Title Page Abstract Introduction Conclusions References Tables Figures J I J I Back CloseFull Screen / Esc
Print Version Interactive Discussion
© EGU 2003
6 Chau and Woodman: Meteor-head echoes over Jicamarca
(a) 0.00 0.02 0.04 0.06 Time (s) 104 106 108 110 112 Range (km) vrb = -63.71 km s -2 |v| = 73.20 km s-2 (c) 0.00 0.02 0.04 0.06 Time (s) -1500 -1000 -500 0 500 1000 1500 vrc (m/s) ar = -12.14 km s -2 |a| = -0.01 km s-2 -30 -20 -10 0 10 20 30 SNR (dB) (b) -1.5 -1.0 -0.5 0.0 0.5 1.0 1.5 θx (o) -1.5 -1.0 -0.5 0.0 0.5 1.0 1.5 θ y ( o) ∆α = 1.54 o
Fig. 3. Meteor characterization for most meteor events. (a) Range vs. time, (b) θxvs. θy, and (c) pulse-to-pulse Doppler vs. time. In all three cases the fitting lines are represented in green. In panel (c) the SNR is shown a long the meteor trajectory (scale on the right) in orange, while the absolute acceleration is given by the slope of the red line.
(a) 0.00 0.05 0.10 0.15 0.20 0.25 Time (s) 95 100 105 Range (km) vrb = -41.36 km s -2 |v| = 41.59 km s-2 (c) 0.00 0.05 0.10 0.15 0.20 0.25 Time (s) -1500 -1000 -500 0 500 1000 1500 vrc (m/s) ar = -4.72 km s-2 |a| = -4.54 km s-2 -30 -20 -10 0 10 20 30 SNR (dB) (b) -1.5 -1.0 -0.5 0.0 0.5 1.0 1.5 θx (o ) -1.5 -1.0 -0.5 0.0 0.5 1.0 1.5 θ y ( o) ∆α = 0.64 o
Fig. 4. Same as Fig. 3 for a meteor event with non-constant deceleration.
ure) while the size is proportional to the SNR. With this type of map, we could be able to determine if a meteor shower is observed if meteors are clustered at their expected radiant and if they show their expected velocity (color).
As it can be observed, the great majority of meteors are coming from the Apex at 0500 LT. Similar result, with an in-creased number of meteors, is also observed around 0700 LT in Fig. 8. Note that the Leo constellation is located very close to the Apex. At the beginning we thought that all the mete-ors were coming from Leonid, however we observed similar results on our control days taken few days after Leonid (not shown here). These results were puzzling until we conducted the February observations, well beyond the Leonid night.
The sky map distribution for the control day is shown in Fig. 9. Again the majority of meteors, which have very similar statistical characteristics to those observe during the Leonid night, are clustered around the Apex.
The picture that emerged from these observations is that the meteors detected by our radar are always clustered around the Apex and that the Leonid radiant happened to be within the same region during the November observations. In ad-dition, there was no measurable increase in the total
me-teor population during the meme-teor shower, not even when a smaller region around the optical radiant and with the ex-pected velocity was considered. Moreover, the velocity dis-tribution did not show any increase of population at the ex-pected velocity of the meteor shower. Therefore, for all prac-tical purposes, we can ignore the existence of the Leonid shower in November 19, 2002 and take our results as those corresponding to the season. Similar results were also ob-served in November 2001 (not shown here) indicating that there is no annual variability, at least, between November 2001 and November 2002.
We have shown that majority echoes come from the Apex at different times during the same day and at different sea-sons. In order to save space and simplify our presentation, in Fig. 10 we show bivariate angular velocity distributions (East-West vs. North-South) with respect to the Apex loca-tion for the Leonid night and control day. Knowing where the Apex occurs at a given time, we have removed the Apex vec-tor location from the vecvec-tor radiant of meteors,i.e., we have plotted their velocity direction relative to the Apex in the same set of coordinates as in the sky maps (NS and EW direc-tional cosines). In addition, we have fitted a two-dimensional
Fig. 3. Meteor characterization for most meteor events. (a) Range vs. time, (b) θx vs. θy, and
(c) pulse-to-pulse Doppler vs. time. In all three cases the fitting lines are represented in green.
In panel (c) the SNR is shown a long the meteor trajectory (scale on the right) in orange, while the absolute acceleration is given by the slope of the red line.
ACPD
3, 6063–6091, 2003 Meteor-head echoes over Jicamarca J. L. Chau and R. F. Woodman Title Page Abstract Introduction Conclusions References Tables Figures J I J I Back CloseFull Screen / Esc
Print Version Interactive Discussion
© EGU 2003
6 Chau and Woodman: Meteor-head echoes over Jicamarca
(a) 0.00 0.02 0.04 0.06 Time (s) 104 106 108 110 112 Range (km) vrb = -63.71 km s-2 |v| = 73.20 km s-2 (c) 0.00 0.02 0.04 0.06 Time (s) -1500 -1000 -500 0 500 1000 1500 vrc (m/s) ar = -12.14 km s -2 |a| = -0.01 km s-2 -30 -20 -10 0 10 20 30 SNR (dB) (b) -1.5 -1.0 -0.5 0.0 0.5 1.0 1.5 θx (o) -1.5 -1.0 -0.5 0.0 0.5 1.0 1.5 θ y ( o) ∆α = 1.54 o
Fig. 3. Meteor characterization for most meteor events. (a) Range vs. time, (b) θxvs. θy, and (c) pulse-to-pulse Doppler vs. time. In all
three cases the fitting lines are represented in green. In panel (c) the SNR is shown a long the meteor trajectory (scale on the right) in orange, while the absolute acceleration is given by the slope of the red line.
(a) 0.00 0.05 0.10 0.15 0.20 0.25 Time (s) 95 100 105 Range (km) vrb = -41.36 km s -2 |v| = 41.59 km s-2 (c) 0.00 0.05 0.10 0.15 0.20 0.25 Time (s) -1500 -1000 -500 0 500 1000 1500 vrc (m/s) ar = -4.72 km s -2 |a| = -4.54 km s-2 -30 -20 -10 0 10 20 30 SNR (dB) (b) -1.5 -1.0 -0.5 0.0 0.5 1.0 1.5 θx (o) -1.5 -1.0 -0.5 0.0 0.5 1.0 1.5 θ y ( o) ∆α = 0.64 o
Fig. 4. Same as Fig. 3 for a meteor event with non-constant deceleration.
ure) while the size is proportional to the SNR. With this type of map, we could be able to determine if a meteor shower is observed if meteors are clustered at their expected radiant and if they show their expected velocity (color).
As it can be observed, the great majority of meteors are coming from the Apex at 0500 LT. Similar result, with an in-creased number of meteors, is also observed around 0700 LT in Fig. 8. Note that the Leo constellation is located very close to the Apex. At the beginning we thought that all the mete-ors were coming from Leonid, however we observed similar results on our control days taken few days after Leonid (not shown here). These results were puzzling until we conducted the February observations, well beyond the Leonid night.
The sky map distribution for the control day is shown in Fig. 9. Again the majority of meteors, which have very similar statistical characteristics to those observe during the Leonid night, are clustered around the Apex.
The picture that emerged from these observations is that the meteors detected by our radar are always clustered around the Apex and that the Leonid radiant happened to be within the same region during the November observations. In ad-dition, there was no measurable increase in the total
me-teor population during the meme-teor shower, not even when a smaller region around the optical radiant and with the ex-pected velocity was considered. Moreover, the velocity dis-tribution did not show any increase of population at the ex-pected velocity of the meteor shower. Therefore, for all prac-tical purposes, we can ignore the existence of the Leonid shower in November 19, 2002 and take our results as those corresponding to the season. Similar results were also ob-served in November 2001 (not shown here) indicating that there is no annual variability, at least, between November 2001 and November 2002.
We have shown that majority echoes come from the Apex at different times during the same day and at different sea-sons. In order to save space and simplify our presentation, in Fig. 10 we show bivariate angular velocity distributions (East-West vs. North-South) with respect to the Apex loca-tion for the Leonid night and control day. Knowing where the Apex occurs at a given time, we have removed the Apex vec-tor location from the vecvec-tor radiant of meteors,i.e., we have plotted their velocity direction relative to the Apex in the same set of coordinates as in the sky maps (NS and EW direc-tional cosines). In addition, we have fitted a two-dimensional
Fig. 4. Same as Fig.3for a meteor event with non-constant deceleration.
ACPD
3, 6063–6091, 2003 Meteor-head echoes over Jicamarca J. L. Chau and R. F. Woodman Title Page Abstract Introduction Conclusions References Tables Figures J I J I Back CloseFull Screen / Esc
Print Version Interactive Discussion
© EGU 2003
Chau and Woodman: Meteor-head echoes over Jicamarca 7
(a) Local Time
0 2 4 6 8 hours 0 200 400 600 800 1000 1200 1400 Number of events (b) Mean SNR 0 10 20 30 40 dB 0 100 200 300 400 500 600 Number of events (c) R0 90 100 110 120 130 km 0 200 400 600 800 1000 1200 Number of events (d) |V| 20 40 60 80 km s-1 0 500 1000 1500 2000 2500 3000 Number of events (e) Acceleration -40 -20 0 20 km s-2 0 200 400 600 800 Number of events 19-Nov-2002 (323), [00-08] LT
Fig. 5. Meteor statistics during the November 19, 2002 when a Leonid shower occurred. (a) time, (b) mean SNR of meteor trajectory, (c)
initial range, (d) absolute velocity, and (e) absolute acceleration.
(a) Local Time
4 5 6 7 8 hours 0 500 1000 1500 Number of events (b) Mean SNR 0 10 20 30 40 dB 0 100 200 300 400 500 600 700 Number of events (c) R0 90 100 110 120 130 km 0 200 400 600 800 1000 Number of events (d) |V| 20 40 60 80 km s-1 0 500 1000 1500 2000 2500 Number of events (e) Acceleration -40 -20 0 20 km s-2 0 100 200 300 400 500 600 Number of events 25-Feb-2003 ( 56), [04-08] LT
Fig. 6. Meteor statistics similar to Fig. 6 during a control day (when Leonid shower was not present) of February 25, 2003.
Gaussian function to the bivariate distributions (bottom pan-els). Note that the distributions are oriented as expected from Figs. 7, 8 and 9. The orientation depends on the position of the Ecliptic plane.
The main parameters of these distributions are presented in Table 2. The rotation angle of the fitted distributions rep-resents the rotation of the minor axis respect to the EW axis (positive counter clockwise). There is very good agreement between the widths of the Leonid night and control day dis-tributions. Furthermore, the rotation angles agree with the axis of the Ecliptic plane. Our results can be taken as the distribution of the meteors for the epochs selected (similar results have been obtained also in June and August 2003, not shown here). The Leonid population appear to affect only the large meteors which are visible optically and which seldom
cross our 1◦beam.
Therefore our results indicates that the velocity distribu-tion of meteors respect to the Earth’s frame of reference is
clustered around the Earth Apex, within ±18◦ transverse
to the Ecliptic and narrow (±8.5◦) in heliocentric
longi-Table 2. Main parameters of angular velocity distribution around
the Apex
Parameter Leonid night Control day
Date November 19, 2002 February 25, 2003
Period 00-08 LT 04-09 LT Mean EW 0.08◦ 0.78◦ Mean NS −2.25◦ 1.11◦ Minor axis 8.88◦ 8.46◦ Major axis 18.05◦ 17.92◦ Rotation respect to EW 21.11◦ −3.28◦
tude in the Ecliptic plane, independent of season. By
re-moving the Earth velocity around the Sun (∼ 29.8kms−1)
the mean widths of the velocity distributions almost doubles
(e.g., from 8.88◦to 15.23◦and from 18.05◦to 32.00◦for the
Fig. 5. Meteor statistics during 19 November 2002 when a Leonid shower occurred. (a) time, (b) mean SNR of meteor trajectory, (c) initial range, (d) absolute velocity, and (e) absolute
acceleration.
ACPD
3, 6063–6091, 2003 Meteor-head echoes over Jicamarca J. L. Chau and R. F. Woodman Title Page Abstract Introduction Conclusions References Tables Figures J I J I Back CloseFull Screen / Esc
Print Version Interactive Discussion
© EGU 2003
Chau and Woodman: Meteor-head echoes over Jicamarca 7
(a) Local Time
0 2 4 6 8 hours 0 200 400 600 800 1000 1200 1400 Number of events (b) Mean SNR 0 10 20 30 40 dB 0 100 200 300 400 500 600 Number of events (c) R0 90 100 110 120 130 km 0 200 400 600 800 1000 1200 Number of events (d) |V| 20 40 60 80 km s-1 0 500 1000 1500 2000 2500 3000 Number of events (e) Acceleration -40 -20 0 20 km s-2 0 200 400 600 800 Number of events 19-Nov-2002 (323), [00-08] LT
Fig. 5. Meteor statistics during the November 19, 2002 when a Leonid shower occurred. (a) time, (b) mean SNR of meteor trajectory, (c)
initial range, (d) absolute velocity, and (e) absolute acceleration.
(a) Local Time
4 5 6 7 8 hours 0 500 1000 1500 Number of events (b) Mean SNR 0 10 20 30 40 dB 0 100 200 300 400 500 600 700 Number of events (c) R0 90 100 110 120 130 km 0 200 400 600 800 1000 Number of events (d) |V| 20 40 60 80 km s-1 0 500 1000 1500 2000 2500 Number of events (e) Acceleration -40 -20 0 20 km s-2 0 100 200 300 400 500 600 Number of events 25-Feb-2003 ( 56), [04-08] LT
Fig. 6. Meteor statistics similar to Fig. 6 during a control day (when Leonid shower was not present) of February 25, 2003.
Gaussian function to the bivariate distributions (bottom pan-els). Note that the distributions are oriented as expected from Figs. 7, 8 and 9. The orientation depends on the position of the Ecliptic plane.
The main parameters of these distributions are presented in Table 2. The rotation angle of the fitted distributions rep-resents the rotation of the minor axis respect to the EW axis (positive counter clockwise). There is very good agreement between the widths of the Leonid night and control day dis-tributions. Furthermore, the rotation angles agree with the axis of the Ecliptic plane. Our results can be taken as the distribution of the meteors for the epochs selected (similar results have been obtained also in June and August 2003, not shown here). The Leonid population appear to affect only the large meteors which are visible optically and which seldom
cross our 1◦beam.
Therefore our results indicates that the velocity distribu-tion of meteors respect to the Earth’s frame of reference is
clustered around the Earth Apex, within ±18◦ transverse
to the Ecliptic and narrow (±8.5◦) in heliocentric
longi-Table 2. Main parameters of angular velocity distribution around
the Apex
Parameter Leonid night Control day
Date November 19, 2002 February 25, 2003
Period 00-08 LT 04-09 LT Mean EW 0.08◦ 0.78◦ Mean NS −2.25◦ 1.11◦ Minor axis 8.88◦ 8.46◦ Major axis 18.05◦ 17.92◦ Rotation respect to EW 21.11◦ −3.28◦
tude in the Ecliptic plane, independent of season. By
re-moving the Earth velocity around the Sun (∼ 29.8kms−1)
the mean widths of the velocity distributions almost doubles
(e.g., from 8.88◦to 15.23◦and from 18.05◦to 32.00◦for the
Fig. 6. Meteor statistics similar to Fig.5 during a control day (when Leonid shower was not present) of 25 February 2003.
ACPD
3, 6063–6091, 2003 Meteor-head echoes over Jicamarca J. L. Chau and R. F. Woodman Title Page Abstract Introduction Conclusions References Tables Figures J I J I Back CloseFull Screen / Esc
Print Version Interactive Discussion
© EGU 2003
8
Chau and Woodman: Meteor-head echoes over Jicamarca
(km s -1 ) 20.00 35.00 50.00 65.00 80.00 19-Nov-2002 (323) 04:59:44
Fig. 7. Skymap distribution of meteor radiants around 0500 LT
dur-ing the Leonid night of November 19, 2002. The absolute velocity
is color-coded while the SNR is represented by the size of the
cir-cles. The Ecliptic plane projected into the celestial sphere is shown
with a black curve, and the Earth’s Apex with thick asterisk.
(km s -1 ) 20.00 35.00 50.00 65.00 80.00 19-Nov-2002 (323) 07:00:16
Fig. 8. Skymap distribution of meteors similar to Fig. 7 but around
0700 LT.
(km s -1 ) 20.00 35.00 50.00 65.00 80.00 25-Feb-2003 ( 56) 07:00:16Fig. 9. Skymap distribution of meteors similar to Fig. 7 but for a
control day around 0700 LT on February 25, 2003.
-40 -20 0 20 40 EW (+ve to West) [o ] -40 -20 0 20 40 NS (+ve to North) [ o]
Distribution around Apex
19-Nov-2002 (323), [00-08] LT 0 23 47 71 95 -40 -20 0 20 40 EW (+ve to West) [o ] -40 -20 0 20 40 NS (+ve to North) [ o]
Distribution around Apex
25-Feb-2003 ( 56), [04-09] LT 0 18 37 56 75 -40 -20 0 20 40 EW (+ve to West) [o ] -40 -20 0 20 40 NS (+ve to North) [ o] (fit) 19-Nov-2002 (323), [00-08] LT 0 23 47 71 95 -40 -20 0 20 40 EW (+ve to West) [o ] -40 -20 0 20 40 NS (+ve to North) [ o] (fit) 25-Feb-2003 ( 56), [04-09] LT 0 18 37 56 75
Fig. 10. Angular velocity distribution of meteors around the Apex
for the Leonid night (left) and control day (right). Bottom panels
show the fitted distributions using two-dimensional Gaussian
func-tions.
Atmos. Chem. Phys., 0000, 0001–10, 2003
www.atmos-chem-phys.org/0000/0001/
Fig. 7. Skymap distribution of meteor radiants around 05:00 LT during the Leonid night of 19
November 2002. The absolute velocity is color-coded while the SNR is represented by the size of the circles. The Ecliptic plane projected into the celestial sphere is shown with a black curve, and the Earth’s Apex with thick asterisk.
ACPD
3, 6063–6091, 2003 Meteor-head echoes over Jicamarca J. L. Chau and R. F. Woodman Title Page Abstract Introduction Conclusions References Tables Figures J I J I Back CloseFull Screen / Esc
Print Version Interactive Discussion
© EGU 2003
8
Chau and Woodman: Meteor-head echoes over Jicamarca
(km s -1 ) 20.00 35.00 50.00 65.00 80.00 19-Nov-2002 (323) 04:59:44
Fig. 7. Skymap distribution of meteor radiants around 0500 LT
dur-ing the Leonid night of November 19, 2002. The absolute velocity
is color-coded while the SNR is represented by the size of the
cir-cles. The Ecliptic plane projected into the celestial sphere is shown
with a black curve, and the Earth’s Apex with thick asterisk.
(km s -1 ) 20.00 35.00 50.00 65.00 80.00 19-Nov-2002 (323) 07:00:16
Fig. 8. Skymap distribution of meteors similar to Fig. 7 but around
0700 LT.
(km s -1 ) 20.00 35.00 50.00 65.00 80.00 25-Feb-2003 ( 56) 07:00:16Fig. 9. Skymap distribution of meteors similar to Fig. 7 but for a
control day around 0700 LT on February 25, 2003.
-40 -20 0 20 40 EW (+ve to West) [o] -40 -20 0 20 40 NS (+ve to North) [ o]
Distribution around Apex
19-Nov-2002 (323), [00-08] LT 0 23 47 71 95 -40 -20 0 20 40 EW (+ve to West) [o] -40 -20 0 20 40 NS (+ve to North) [ o]
Distribution around Apex
25-Feb-2003 ( 56), [04-09] LT 0 18 37 56 75 -40 -20 0 20 40 EW (+ve to West) [o] -40 -20 0 20 40 NS (+ve to North) [ o] (fit) 19-Nov-2002 (323), [00-08] LT 0 23 47 71 95 -40 -20 0 20 40 EW (+ve to West) [o] -40 -20 0 20 40 NS (+ve to North) [ o] (fit) 25-Feb-2003 ( 56), [04-09] LT 0 18 37 56 75
Fig. 10. Angular velocity distribution of meteors around the Apex
for the Leonid night (left) and control day (right). Bottom panels
show the fitted distributions using two-dimensional Gaussian
func-tions.
Atmos. Chem. Phys., 0000, 0001–10, 2003
www.atmos-chem-phys.org/0000/0001/
Fig. 8. Skymap distribution of meteors similar to Fig.7but around 07:00 LT.
ACPD
3, 6063–6091, 2003 Meteor-head echoes over Jicamarca J. L. Chau and R. F. Woodman Title Page Abstract Introduction Conclusions References Tables Figures J I J I Back CloseFull Screen / Esc
Print Version Interactive Discussion
© EGU 2003
8
Chau and Woodman: Meteor-head echoes over Jicamarca
(km s -1 ) 20.00 35.00 50.00 65.00 80.00 19-Nov-2002 (323) 04:59:44
Fig. 7. Skymap distribution of meteor radiants around 0500 LT
dur-ing the Leonid night of November 19, 2002. The absolute velocity
is color-coded while the SNR is represented by the size of the
cir-cles. The Ecliptic plane projected into the celestial sphere is shown
with a black curve, and the Earth’s Apex with thick asterisk.
(km s -1 ) 20.00 35.00 50.00 65.00 80.00 19-Nov-2002 (323) 07:00:16
Fig. 8. Skymap distribution of meteors similar to Fig. 7 but around
0700 LT.
(km s -1 ) 20.00 35.00 50.00 65.00 80.00 25-Feb-2003 ( 56) 07:00:16Fig. 9. Skymap distribution of meteors similar to Fig. 7 but for a
control day around 0700 LT on February 25, 2003.
-40 -20 0 20 40 EW (+ve to West) [o] -40 -20 0 20 40 NS (+ve to North) [ o]
Distribution around Apex
19-Nov-2002 (323), [00-08] LT 0 23 47 71 95 -40 -20 0 20 40 EW (+ve to West) [o] -40 -20 0 20 40 NS (+ve to North) [ o ]
Distribution around Apex
25-Feb-2003 ( 56), [04-09] LT 0 18 37 56 75 -40 -20 0 20 40 EW (+ve to West) [o ] -40 -20 0 20 40 NS (+ve to North) [ o] (fit) 19-Nov-2002 (323), [00-08] LT 0 23 47 71 95 -40 -20 0 20 40 EW (+ve to West) [o ] -40 -20 0 20 40 NS (+ve to North) [ o ] (fit) 25-Feb-2003 ( 56), [04-09] LT 0 18 37 56 75
Fig. 10. Angular velocity distribution of meteors around the Apex
for the Leonid night (left) and control day (right). Bottom panels
show the fitted distributions using two-dimensional Gaussian
func-tions.
Atmos. Chem. Phys., 0000, 0001–10, 2003
www.atmos-chem-phys.org/0000/0001/
Fig. 9. Skymap distribution of meteors similar to Fig.7but for a control day around 07:00 LT on 25 February 2003.