HAL Id: hal-00304900
https://hal.archives-ouvertes.fr/hal-00304900
Submitted on 1 Jan 2003HAL is a multi-disciplinary open access archive for the deposit and dissemination of sci-entific research documents, whether they are pub-lished or not. The documents may come from teaching and research institutions in France or abroad, or from public or private research centers.
L’archive ouverte pluridisciplinaire HAL, est destinée au dépôt et à la diffusion de documents scientifiques de niveau recherche, publiés ou non, émanant des établissements d’enseignement et de recherche français ou étrangers, des laboratoires publics ou privés.
Modelling sulphate stream concentrations in the Black
Forest catchments Schluchsee and Villingen
A. Prechtel, M. Armbruster, E. Matzner
To cite this version:
A. Prechtel, M. Armbruster, E. Matzner. Modelling sulphate stream concentrations in the Black Forest catchments Schluchsee and Villingen. Hydrology and Earth System Sciences Discussions, European Geosciences Union, 2003, 7 (4), pp.552-560. �hal-00304900�
Modelling sulphate stream concentrations in the Black Forest
catchments Schluchsee and Villingen
A. Prechtel
1, M. Armbruster
2and E. Matzner
11Department of Soil Ecology, BITÖK, University of Bayreuth, D-95440 Bayreuth, Germany
2Institute of Soil Science, Technical University of Dresden, D-01735 Tharandt, Germany
Email for corresponding author: [email protected]
Abstract
The sulphate (SO4) released by mineralisation and desorption from soil can play an important role in determining concentrations of SO4 in streams. The MAGIC model was calibrated for two catchments in the Black Forest, Germany (Schluchsee and Villingen) and SO4 concentrations in the streams for the years 2016 and 2030 were predicted. Special emphasis was placed on the dynamics of soil sulphur (S) pools. At Schluchsee, 90% of soil S is stored in the organic S (Sorg) pool, whereas at Villingen, 54% is in the inorganic (Sinorg) pool. The Villingen stream chemistry was modelled successfully by measured Langmuir isotherm parameters (LIPs) for Sinorg. Schluchsee data could not be modelled satisfactorily using measured or freely adapted LIPs only, as the Sinorg pool would have to be more than five times larger than what was measured. With 60.5 mmolc SO4 m-2 yr-1 as internal soil source by mineralisation and the measured LIPs, stream data was modelled successfully. The modelling shows that in these two catchments pre-industrial concentrations of SO4 in runoff can be reached in the next two decades if S deposition decreases as intended under currently agreed national and international legislation. Sorg is the most likely dominant source of SO4 released at Schluchsee. Mineralization from the Sorg pool must be included when modelling SO4 concentrations in the stream. As the dynamics and the controlling factors of S release by mineralisation are not yet clear, this process remains a source of uncertainty for predictions of SO4 concentrations in streams. Future research should concentrate on dynamics of S mineralisation in the field, such that mathematical descriptions of long-term S-mineralisation can be incorporated into biogeochemical models.
Keywords: sulphate release, organic S, mineralisation, acidification, recovery, modelling, MAGIC, catchments, predictions, Germany, forest
Introduction
Since the industrial revolution, deposition of anthropogenic sulphate (SO4) has led to SO4 accumulation in forest soils
and acidification of surface waters (Reuss and Johnson, 1985). Sulphur (S) is stored in the soil as inorganic SO4 by
adsorption and/or cycled through the organic S (Sorg) pool
before being released to soil solution and stream water (Alewell, 2001). The importance of these processes depends on soil characteristics. In the upper horizons of many soils, Sorg is the dominant S fraction, and can comprise 60 90 %
of total S pool (David et al., 1984; Mitchell et al., 1986; Autry et al., 1990; Fitzgerald and Autry, 1992; Erkenberg et al., 1996; Prietzel et al., 2001).
SO4 release from the Sorg and other soil S pools has become
of increasing importance as the atmospheric S input has declined during the last two decades. A study of the response
of S dynamics to decreasing S deposition in several
European catchments showed a net release of SO4 in most
catchments since the late 1980s and the early 1990s (Prechtel et al., 2001). As the SO4 released is accompanied in part by
base cations, net SO4 loss from soil enhances soil
acidification and in acid soils increases acidification of soil solution and surface water. Therefore, understanding the S dynamics in soil and evaluating the relevant S sources is crucial for predicting the reversibility of acidification.
It has been hypothesised that mineralisation of soil estersulphates (E-S) is regulated by a biological requirement for S whereas mineralisation of carbon-bound S (C-S) is more closely associated with concomitant mineralisation of C and N as energy source for soil microbes (McGill and Cole, 1981). Norman et al. (2002) described S mineralisation as a two-step reaction during which C-S is converted slowly
Modelling sulphate stream concentrations in the Black Forest catchments Schluchsee and Villingen
to E-S followed by fast hydrolysis of E-S. The factors controlling mineralisation rates in the field, however, are are poorly known.
Alewell (2001) and Gbondo-Tugbawa et al. (2002) among others suggested that SO4 released from mineralisation can
play an important role in concentrations of SO4 in streams.
The discrepancy between measured and modelled SO4
concentrations was reduced considerably when biotic processes such as plant uptake and mineralisation were
included in the model (PnET-BGC) (Gbondo-Tugbawa et al., 2002). They suggested that under conditions of decreasing S deposition, mineralisation in excess of immobilization and plant uptake becomes more important in controlling SO4 losses than SO4 desorption and that
models which only describe abiotic processes will not be suitable for predicting long-term recovery of stream water from acidification. Most biogeochemical models for soil and water acidification consider inorganic SO4 adsorption and
desorption only. Thus, specific results from forecasts are highly dependent on the assumptions made concerning the S sources to and within the catchment (Gbondo-Tugbawa et al., 2002).
S pools and SO4 dynamics of the Black Forest, Germany,
catchments Schluchsee and Villingen (Table 1a) have been analysed by Feger et al. (1990), Feger (1993a,b), Armbruster (1998) and Prietzel (1998a). These detailed data, the proximity of the catchments to each other (same deposition history), and their differences in soil S pools and S release make these catchments well-suited for this attempt to model the past and future concentrations of SO4 in streamwater.
At Schluchsee, 90% of total S is found in the organic fraction (Sorg), whereas at Villingen only 54% is in this pool
(Table 1b). The absolute amounts of Sorg, however, are
similar in both catchments. While at Schluchsee the SO4
net loss (input minus output) was 50 mmolc SO4 m-2 yr-1
(mean 19881996), the SO4 budget at Villingen was almost
balanced (1988-1995). Feger et al. (1990) suggested that mineralisation of the Sorg pool is the most likely SO4 source
at Schluchsee. Furthermore, a comparison of soil S pools (forest floor and 0-80 cm) with the cumulative SO4 net
Table 1a. Site characteristics of catchments studied: area, climate,
catchment discharge, bedrock, soil and vegetation.
SCHLUCHSEE VILLINGEN Area (ha) 11 46.3 Altitude (m a.s.l.) 1150-1290 810-945 Temperature (C°)* 4.4 6.3 Precipitation (m yr-1)** 1.87 1.33 Annual discharge (m yr-1)** 1.40*** 0.47***
Bedrock Granite triassic sandstone major soil types (FAO) Haplic Podzol Dystric cambisols
(70%)
Dystric Planosol (30%)
Forest Norway Spruce Norway Spruce Natural forest species beech, fir, fir, spruce, pine composition spruce
*annual mean air temperature **annual mean
***hydrological years
Table 1b. Pools of total S (Stot), organic S (Sorg), inorganic S (Sinorg), carbon-bound S (C-S) and estersulphate-S (E-S) in the main soil types
(O-horizon and 0100 cm) of the studied catchments Schluchsee and Villingen (after Prietzel, 1998a) (pools were determined in samples from 1986). Measured values and percentages of total S.
mmol S m-2 Podzol
SCHLUCHSEE Depth [cm] Stot Sorg Sinorg C-S E-S
O 5-0 372 12% 363 12% 9 0% 281 9% 84 3% A 0-30 928 30% 872 29% 56 2% 506 17% 366 12% B 30-80 1534 50% 1338 44% 197 6% 819 27% 519 17% C 80-100 225 8% 175 5% 50 2% 19 1% 156 5% Sum 3059 100% 2744 90% 316 10% 1625 53% 1125 37% mmol S m-2 Cambisol
VILLINGEN Depth [cm] Stot Sorg Sinorg C-S E-S
O 6-0 422 9% 409 9% 13 0% 331 7% 75 2%
A, AB 0-20 975 20% 856 18% 119 3% 569 12% 288 6% B, BC 20-70 2447 51% 859 18% 1584 33% 369 8% 491 10% C 70-100 922 19% 438 9% 484 10% 166 3% 272 6%
release (19881995) showed that the release at Schluchsee cannot be explained by losses from the inorganic SO4 pool
(Alewell, 2001). The catchment received 253 mmolc S m2
yr1 and released 550 mmol
c S m2 yr1 with seepage water.
With an inorganic S pool of 263 mmolc S m2 and a Sorg pool
of 2572 mmolc S m2, the net release of 297 mmolc S m2
yr1 most likely originates from the S org pool.
The aims of this study were to (i) apply the model MAGIC to the two catchments Schluchsee and Villingen and predict concentrations of SO4 in the streams in the years 2016 and
2030 and (ii) to evaluate the role of soil S pools for modelling SO4 stream concentrations. The year 2016 was chosen as it
is the year by which good surface water status is to be achieved in the implementation of the Water Framework Directive (European Commission, 2000), and 2030 was chosen as a further forecast target year.
Methods
DESCRIPTION OF CATCHMENTS
The catchments, Schluchsee (47°49´ N, 8°06´ E) and Villingen (48°03´ N, 8°22´ E) are located in the higher altitudes of the Black Forest (Table 1a). Both catchments are completely forested and have not been affected by agricultural activities, fertilization or road salts. Research in the catchments started in 1988 (Feger, 1993a) and deposition and stream chemistry data has been collected from 1988 until 1995 and 1996 at Villingen and Schluchsee, respectively. A detailed description of the catchments is given in Feger et al. (1990), Feger (1993a), and Mayer et al. (1995).
The Schluchsee catchment is covered by well-drained Podzols of 60100 cm depth. Prevailing soil types at Villingen are dystric Cambisols (70% of catchment area) and dystric Planosols (30% of catchment area) of about 70 cm depth (Feger, 1993a). S pools in the catchments differ greatly (Table 1b).
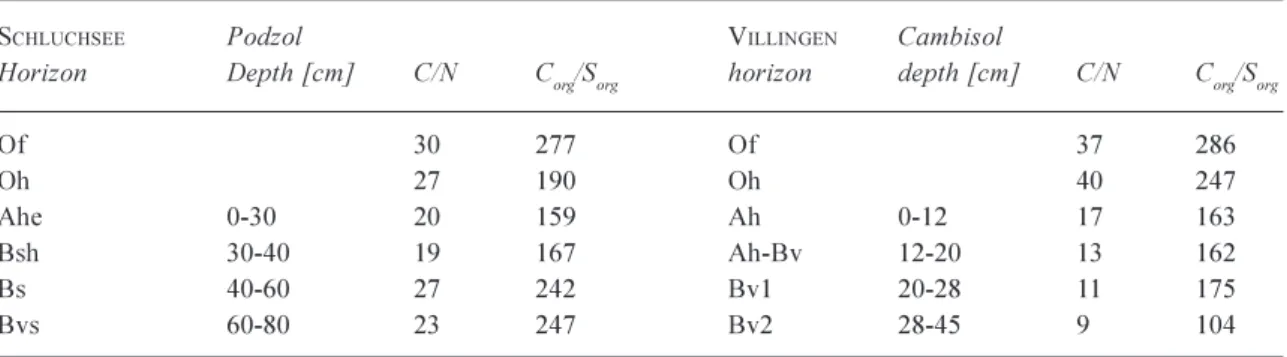
Elemental ratios in the organic matter of the soils also differ between the catchments (Table 1c). According to Prietzel (1998a), mineralisation of humus and adsorption of E-S explain the higher Corg/Sorg-ratios inthe Schluchsee
Ahe- and Bsh-horizon, respectively, than in the organic layers. Due to this, four times more Sorg is adsorbed to the
soil than SO4-S. In contrast at Villingen, all of the adsorbed
S in the deeper mineral soil is SO4-S. The small Corg/Sorg
-ratio in the Bv2 might be a result of the very low Corg- and
Sorg-contents. Removed S-rich organic matter from the
organic layers is also stored in the upper mineral soil at Villingen.
Atmospheric SO4 input of 5659 mmolc SO4 m2 yr1
(mean 19881995/1996) to the catchments Schluchsee and Villingen is low to moderate as compared with other German and central European forested catchments (Prechtel et al., 2001). The Black Forest catchments are relatively remote; long-range transport of air-pollutants is more important than emissions from local sources and the inputs are very similar to the levels measured in southern Scandinavia (Feger et al., 1990).
Average SO4 concentrations in streamwater (1988-1995/
1996) were 75 (Schluchsee) and 115 (Villingen) µmolc SO4
l1; these levels are similar to those of the Norwegian streams
Birkenes, Langtjern and Storgama (same time period) and are much lower than in streams of other low mountain ranges in Germany, e.g.: Lehstenbach (341 µmolc SO4 l1) and
Lange Bramke (252 µmolc SO4 l1) (same time period)
(Prechtel et al., 2001).
Model set-up
MODEL DESCRIPTION
The MAGIC (version 7) model is a simplified process-oriented model for forecasting effects of acidic deposition on water quality and is described in detail by Cosby et al. (1986, 2001). Many applications of MAGIC aim to forecast
Table 1c. C/N- and Corg/Sorg-ratios in the main soil types (O-horizon and 0-45/80 cm) of the studied catchments Schluchsee
and Villingen (after Prietzel, 1998a) (pools were determined in samples from 1986).
SCHLUCHSEE Podzol VILLINGEN Cambisol
Horizon Depth [cm] C/N Corg/Sorg horizon depth [cm] C/N Corg/Sorg
Of 30 277 Of 37 286 Oh 27 190 Oh 40 247 Ahe 0-30 20 159 Ah 0-12 17 163 Bsh 30-40 19 167 Ah-Bv 12-20 13162 Bs 40-60 27 242 Bv1 20-28 11 175 Bvs 60-80 23247 Bv2 28-45 9 104
Modelling sulphate stream concentrations in the Black Forest catchments Schluchsee and Villingen timescales of reversibility of acidification of lakes and
streams. As a lumped-parameter model it is assumed that a set of average physical and chemical parameters can be found to describe effectively the response of a whole catchment (Cosby et al., 1986). Major soil processes in MAGIC are cation exchange, weathering, plant uptake and
SO4 sorption which is described by a Langmuir isotherm.
The Langmuir isotherm parameters (LIPs) Emax (maximum
SO4 adsorption capacity, in mmolc kg1) and C (half
saturation constant, in mmolc m3) are MAGIC input
parameters which have to be set for calibrating the model to the observed stream SO4 data. Further, the model requires
a number of fixed parameters to describe the stream and soil physically and chemically.
ROUTING PARAMETERS SOIL BOXES
The model represents the catchment soil as a homogeneous unit that can be described in soil boxes of which one (Schluchsee: Podzol) or two (Villingen: Cambisol and Planosol) can be defined. Soil boxes can be arranged horizontally (as soil layers) or vertically (as soil types); for the latter version the percentage of covered area or rather of flow fractions through the soils must be set (used at Villingen; see Table 1). Parameters for these soil boxes include bulk density, CEC (cation exchange capacity), dissolved organic carbon (DOC) and the LIPs and were weighted over soil depth (Table 2a). The LIPs chosen for the different calibrations are shown later (see Calibration).
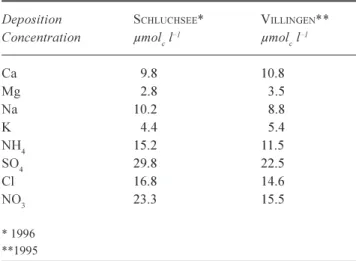
DEPOSITION AND STREAM DATA
The last year of the data set was used as reference year for calibration, which was 1995 and 1996 at Villingen and
Schluchsee, respectively (Armbruster, 1998). Data for deposition and stream chemistry for these years are given
in Tables 2b and 2c. Deposition of Na+, NO
3, NH4+ and
SO42 was set equal to measured throughfall in the
catchments. Ca2+-, Mg2+-, K+- and Cl--bulk deposition was
multiplied by the Na throughfall to Na bulk deposition ratio to calculate
total deposition (Prechtel et al., 2001).
For the hindcast, SO4 deposition was estimated from S
emissions data in Europe (Mylona, 1996) combined with currently calculated data for the period since 1960 (Schöpp et al., 2003). As both catchments are situated in the same EMEP grid square the hindcast deposition scenario was the same for Schluchsee and Villingen.
Table 2a. MAGIC input: Soil characteristics of the catchments
(soil depth, bulk density, cation exchange capacity (CEC), base saturation and DOC).
SCHLUCHSEE* VILLINGEN**
soil box soil box 1# 2##
Soil depth (m) 0.8 0.7 0.7 Bulk density (kg m-3) 1083 1335 1661
CEC (meq kg-1) 55.8 60.2 23.3
Base saturation (% of CEC) 3 3.3 4.6 DOC (mmol m-3) 55.3 32.8 32.8 *profile weighted over 80 cm (A- and B-horizons)
**profile weighted over 70 cm (A- and B-horizons) # Cambisol
## Planosol
Table 2b. MAGIC input: Deposition chemistry in reference year. Deposition SCHLUCHSEE* VILLINGEN**
Concentration µmolc l1 µmolc l1
Ca 9.8 10.8 Mg 2.8 3.5 Na 10.2 8.8 K 4.4 5.4 NH4 15.2 11.5 SO4 29.8 22.5 Cl 16.8 14.6 NO3 23.3 15.5 * 1996 **1995
Table 2c. MAGIC target values: Stream chemistry in reference
year.
Stream SCHLUCHSEE* VILLINGEN**
Concentration µmolc l1 µmolc l1
Ca 51.5 39.8 Mg 12.7 26.6 Na 78.2 35.8 K 15.1 12.0 NH4 0.2 0.2 NO3 37.6 4.4 Cl 17.9 29.0 SO4 67.0 96.5 ANCX 35.1 15.5 BCXX 157.4 114.2 Ph 5.6 4.5 * 1996 **1995
X Acid Neutralising Capacity XX Sum of base cations
556
SINKS AND SOURCES
In MAGIC the S sink net uptake is defined as uptake necessary for tree biomass increment. Feger (1993b) reported annual element uptake rates for increment of 45-year and 100-45-year old spruce trees at Schluchsee (14 mmolc
SO4 m2 yr1) and Villingen (6 mmolc SO4 m2 yr1),
respectively (Feger, 1993b). Assuming that during tree growth element uptake increases and reaches a maximum sometime after the juvenile phase a sink sequence for base cations and also S was constructed to reflect forest history in the catchments: At Schluchsee the natural forest was clearcut in 1750 and a pure spruce forest was planted. After another clearcut in 1943, 100% spruce was planted again. At Villingen, the old coniferous forest (see Table 1a) was clearcut in 1887 and replanted with 100% spruce.
CALIBRATION
With the parameters and assumptions described above, MAGIC was calibrated to target year values of stream and soil chemistry and further by comparing the long-term trends of element concentrations with the measured data set. Strong acid anion concentrations (NO3, Cl and SO42) were
calibrated first. Base cation concentrations were then calibrated by adjusting base cation exchange selectivity coefficients and base cation weathering in an interactive procedure until the model simulations matched the observed data. Finally, pH and concentrations of organic anions in the stream were calibrated by adjusting parameters controlling weak acid-base chemistry (Sullivan and Cosby, 1998).
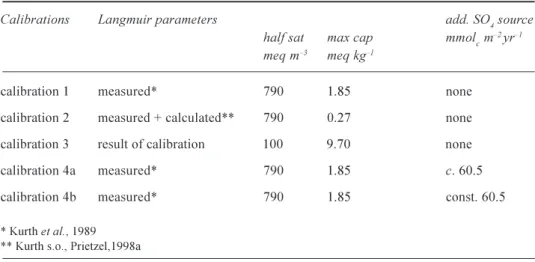
For calibrating SO4 in the stream, LIPs have to be set in
the parameter file. For Schluchsee Podzol, Villingen Cambisol and Villingen Planosol Emax and C have been
determined in the A- and B-horizons by Kurth et al. (1989) in a batch extraction. For the first calibration, these LIPs were used (Table 3). At Schluchsee different calibrations were run: For calibration 2, Emax was calculated from the
measured soil S pool (Prietzel, 1998a) (Table 3). In calibration 3, LIPs were the result of an interactive
procedure: the best approach to the measured SO4stream
concentration was modelled by adjusting freely chosen LIPs (Table 3). After that, calibrations 4a and 4b were run with an additional S source term that is attributed to net mineralisation of the soil Sorg pool (Table 3).
FORECAST
The so-called current legislation scenario for the decrease in S deposition was used. This scenario assumes implementation of the Gothenburg protocol and relevant EU Directives (Schöpp et al., 2003) and entails a 55, 57
and 60% reduction of SO4 deposition for 2010, 2016 and
2030, respectively, compared to the reference year 1995/ 1996. Scale factors for the deposition in the future in relation to the reference year were calculated and the forecast was run with (calibrations 4a and 4b) and without (calibrations 1 and 3) the additional soil S source for Schluchsee (see above).
Results
ACIDIFICATION HISTORY
The generalised historical deposition (hindcast scenario) well matched the measured deposition data since the mid-1980s for Schluchsee and Villingen catchments (Fig. 1). Over the 140-year hindcast period the SO4 fluxes in runoff
increased as a result of the increasing S deposition.
Table 3. MAGIC input: Soil parameters for S dynamics (Langmuir isotherm parameters and additional
SO4 source) for the different calibration procedures.
Calibrations Langmuir parameters add. SO4 source
half sat max cap mmolc m2yr1
meq m3 meq kg1
calibration 1 measured* 790 1.85 none calibration 2 measured + calculated** 790 0.27 none calibration 3result of calibration 100 9.70 none calibration 4a measured* 790 1.85 c. 60.5
calibration 4b measured* 790 1.85 const. 60.5
* Kurth et al., 1989 ** Kurth s.o., Prietzel,1998a
Modelling sulphate stream concentrations in the Black Forest catchments Schluchsee and Villingen
MODELLING OF MEASURED STREAM SO4
CONCENTRATION
Modelling SO4 concentrations in streamwater at Schluchsee
using the measured LIPs (calibration 1) was not successful; the measured SO4 concentrations stream were greatly underestimated (Fig. 2). As a result, additional calibrations with various sets of input parameters for the S dynamics were tried. Calibration 2 was run with a smaller Emax and the
same C as calibration 1 (Table 3), but resulted in the same or lower SO4 concentrations in the stream (Fig. 2).
Calibration 3 attempted to reach the measured SO4
concentration level by adjusting freely chosen LIPs in an interactive procedure. The best LIP was 9.7 (Emax) and 100
(C), but still resulted in a 22% underestimation of SO4
concentrations. In calibration 3, MAGIC calculated a soil Sinorg pool of 1295 mmol S m-2 in 1986, whereas the measured
Sinorg pool in 1986 was only 253 mmol S m-2 (080 cm; Table
1b). For modelling SO4 stream concentrations with this
ad-/desorption only approach, a more than five times larger Emax and soil Sinorg pool compared to measured values must
be assumed.
For calibration 4a an additional S source meant to comprise net mineralisation from the Sorg pool was included 0 20 40 60 80 100 120 140 1856 1862 1868 1874 1880 1886 1892 1898 1904 1910 1916 1922 1928 1934 1940 1946 1952 1958 1964 1970 1976 1982 1988 1994 year SO 4 2- [mmol c m -2 yr -1 ]
modelled deposition Schluchsee measured deposition Schluchsee modelled deposition Villingen measured deposition Villingen
Fig. 1. Modelled and measured SO4 fluxes with input (total deposition) at Schluchsee and Villingen.
0 20 40 60 80 100 120 140 160 180 1970 1972 1974 1976 1978 1980 1982 1984 1986 1988 1990 1992 1994 1996 years SO 4 2- [µ eq*l -1]
measured: Schluchsee calibration 1 calibration 2 calibration 3
calibration 4b measured: Villingen modelled: Villingen
in the same parameter file used in calibration 1 (measured LIPs). Measured data could be modelled by adding up the missing SO4 with a variable S source which varied from
year-to-year such that the modelled and measured stream SO4 concentrations matched. The average S source for these
years (60.5 mmolc SO4 m2 yr1) was then used as a constant
soil S source in calibration 4b. With these additional 60.5 mmolc SO4 m2 yr1, measured data were matched by the
model with a correlation coefficient of 0.98.
The measured LIPs led to a successful calibration at Villingen (Fig. 2). No changes of LIPs or soil sources and sinks were necessary to achieve satisfactory simulation of SO4 concentrations in the stream. The modelled SO4
concentrations were on average 1.14 times higher than measured. The modelled soil Sinorg pool (maximum in 1980:
1145 mmol S m2) compared relatively well with the
measured (Table 1b).
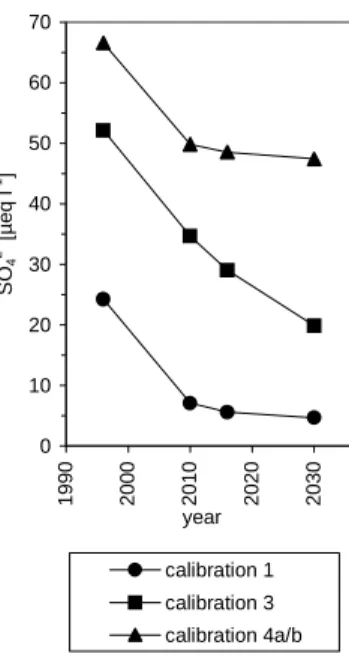
FORECAST
At Schluchsee stream SO4 concentrations predicted using
calibration 1 decreased to 5.6 µmolc SO4 l1 in 2016, a level
near the modelled pre-industrial level (calibration 1, before 1856) (Fig. 3a). Calibration 3 resulted in 29.0 µmolc SO4
l1 in 2016. With the additional S source, SO
4 in the stream
was 48.5 µmolc SO4 l-1 in 2016 compared to 67 µmolc SO4
l1 in 1996 (measured value). At Villingen, a SO
4 stream
concentration of 39.8 µmolc SO4 l1 was predicted for 2016,
which is equivalent to the hindcast for 1904 (Fig. 3b).
Discussion
The modelling indicated that in these two catchments pre-industrial conditions of SO4 concentrations in runoff can be
reached in the next two decades, if S deposition declines as agreed in current legislation. The forecast concentration at Schluchsee depends highly on the magnitude of Sorg released
from mineralisation. The difference in the forecasts with and without an additional S source at Schluchsee was 43 µmolc SO4 l1 in 2016/2030 (Fig. 3a). Theoretically, and
in dependency of the mineralisation dynamics, the Sorg pool
could, as worst case scenario, release the same amount of SO4 as in calibration 4a/4b constantly for decades. Without
considering SO4 release from mineralisation, a faster
reversibility of stream SO4 concentration was predicted at
Schluchsee (Fig. 3a).
At Villingen the model suggested a relatively quick reversibility of SO4 concentrations to less than half the 1995
value in 2016 and another 50% reduction by 2030 (Fig. 3b). the Uncertainty with respect to the relevant processes for SO4 release and the Sorg source,however, is quite large
0 10 20 30 40 50 60 70 1990 2000 2010 2020 2030 year SO 4 2- [µ e q l -1] calibration 1 calibration 3 calibration 4a/b
Fig. 3a. Schluchsee: Modelled SO4 stream concentration in 1996, 2010, 2016 and 2030 depending on calibration.
Fig. 3b. Villingen: Modelled SO4 stream concentration in 1995, 2010, 2016 and 2030. 0 20 40 60 80 100 120 1990 2000 2010 2020 2030 year SO 4 2- [µ e q l -1]
(Fig. 3a). Therefore, it is crucial to identify the sources of SO4 release from catchments soils for modelling future
trends of stream SO4 concentrations.
In general, four major processes can be responsible for S release from soil: (i) desorption of inorganic SO4, (ii)
oxidation of reduced S species, (iii) excess mineralisation of organically bound S, and (iv) weathering of S-containing minerals. Feger et al. (1990) and Mayer et al. (1995) assumed that oxidation and weathering are negligible (max. 0.013 mmolc SO4 m2 yr1; Prietzel, 1998b) in the two
catchments.
At Schluchsee, a high percentage of the annual precipitation is falls as snow. Due to this, a 10% underestimation of the SO4 input fluxes is possible (Feger
Modelling sulphate stream concentrations in the Black Forest catchments Schluchsee and Villingen et al., 1990). This might account for part of the missing
SO4 in the stream. But, increasing the amount of precipitation
and the SO4 input to the catchment was not sufficient to
account for the measured SO4 concentrations in the stream.
An additional soil S source was necessary. About 60.5 mmolc SO4 m2 yr1 were needed to yield SO4 stream
concentrations at the measured level (calibrations 4a, 4b). This amount is consistent with those reported by Feger et al. (1990), Mayer et al. (1995) and Prietzel (1998b) (62 94 mmolc SO4 m2 yr1) to balance S flux budgets. The
modelling shows that SO4 release from the catchment cannot
be explained solely with ad-/desorption. Kurth et al. (1989) found that adsorption in the humus-rich podzol is largely blocked by organic anions even in the subsoil. From depleted d18O
sulphate-values in soil leachates Mayer et al. (1995)
concluded that a considerable portion of SO4 in the subsoil
seepage must be derived from excess mineralisation of C-S. On basis of SO4 fluxes and soil S pools (Table 1b)
together with results on N dynamics Feger et al. (1990) and Feger (1993a) assumed that microbial turnover of relict subsoil humus pools (originating from the former deep-rooting beech-fir forest stand) might be responsible for the nitrate and SO4 release at Schluchsee (Table 2c). This is
supported by the fact that half of the Sorg pool is stored in
the B-horizon (Table 1b).
When the model was calibrated without the additional S source (calibration 3), MAGIC calculated a Sinorg pool that
was five times larger than the measured Sinorg pool in 1986.
Thus, MAGIC gives an additional indication that the Sorg
rather than Sinorg pool is the dominant soil SO4 source at
Schluchsee.
In contrast to Schluchsee, at Villingen adsorption/ desorption processes can explain the concentrations and isotope composition of SO4 in seepage water of the subsoil
(Mayer et al., 1995). This is due to the high sesquioxide content in the soil (Kurth et al., 1989). This was confirmed by the successful calibration of MAGIC to the measured stream data with the measured LIPs (Fig. 2). Thus, S release from mineralisation of Sorg played only a minor role,
although the Sorg pool still accounts for 54% of Stot (Table
1b).
Consideration of the modelling results and S dynamics for these catchments leaves some questions open. This study only indicated that net mineralisation is a probable SO4
source at Schluchsee. It remains open, if the relict humus and a high microbial activity in this humus actually are the reasons for SO4 net release there as suggested by Feger et
al. (1990). The question why the Sorg should be mineralised
in excess at Schluchsee and not at Villingen cannot be answered based on the available information. Mayer et al. (1995) concluded that at Villingen immobilization and
mineralisation most likely occur concurrently at the same rate, resulting in more or less balanced S budgets and depleted d18O
sulphate-values in soil leachates. How the Sorg pool
in these catchments will react in the future, and whether it might also become a net source at Villingen remain unanswered questions. Similar uncertainties on the future behaviour of Sorg were indicated for the Gårdsjön catchment
in Sweden (Torssander and Mörth, 1998). There, excess mineralisation of Sorg in the B-horizon (where most of it is
stored) is currently not important as a SO4 source but could
prolong acidification processes for centuries.
Sulphur mineralisation might increase with decreasing SO4 concentration in soil solution (Maynard et al., 1985;
Simon et al., 1989). If this happens for the soil Sorg pool in
the studied catchments, an increasing S release from mineralisation in the future is likely. In addition, it is quite possible that other factors which control mineralisation (e.g. temperature, moisture) are may change in the future and could therefore influence S release from the Sorg pool. The
excess mineralisation of Sorg remains a source of uncertainty
for predictions of the future concentrations of SO4 in
streamwater.
Conclusions
The model calibrations and S budgets from earlier studies indicated that the soil organic S pool most likely is the dominant source for SO4 release from the Schluchsee
catchment. Thus, Sorg and S mineralisation have to be
considered when modelling SO4 stream concentrations there.
Excess mineralisation can be modelled with MAGIC by implementing a soil S source. As the future dynamics of S release from mineralisation and the controlling factors are not clear, this process has to be taken into account as a source of uncertainty when predicting SO4 concentrations in
catchments. Future research should concentrate on dynamics of S mineralisation to be able to implement a more precise description of long-term S mineralisation into biogeochemical models.
Acknowledgements
This project was supported financially by the Commission of European Communities RECOVER:2010 project (EVK1-CT-1999-00018) and the German Ministry of Education and Research, grant no. PT BEO 51-0339476.
The assistance in modelling with MAGIC by Richard F. Wright and Jack B. Cosby is gratefully acknowledged.
References
Alewell, C., 2001. Predicting reversibility of acidification: the European sulfur story. Water Air Soil Pollut., 130, 12711276. Armbruster, M., 1998. Zeitliche Dynamik der Wasser- und Elementflüsse in Waldökosystemen. Freiburger Bodenkundl.
Abh., Band 38.
Autry, A.R., Fitzgerald, J.W. and Caldwell, P.R., 1990. Sulfur fractions and retention mechanisms in forest soils. Can. J. Forest
Res., 20, 337342.
Cosby, B.J., Hornberger, G.M., Wright, R.F. and Galloway, J.N., 1986. Modeling the effects of acid deposition: control of long-term sulfate dynamics by soil sulfate adsorption. Water Resour.
Res., 22 , 12831291.
Cosby, B.J., Ferrier, R.C., Jenkins, A. and Wright, R.F., 2001. Modelling the effects of acid deposition: refinements, adjustments and inclusion of nitrogen dynamics in the MAGIC model. Hydrol. Earth Syst. Sci., 5, 499517.
David, M.B., Mitchell, M.J. and Schindler, S.C., 1984. Dynamics of organic and inorganic sulfur constituents in hardwood forest soils. In: Forest soils and treatment impacts; Sixth North
American forest soil conference, E.L. Stone, (Ed.). Knoxville,
Tenn.,USA. 221245.
Erkenberg, A., Prietzel, J. and Rehfuess, K.-E., 1996. Schwefelausstattung ausgewählter europäischer Waldböden in Abhängigkeit vom atmogenen S-Eintrag. Z. Pflanzenernaehr.
Bodenkd., 159, 101109.
European Commission, 2000. Directive 2000/60/EC of the European Parliament and of the Council of 23 October 2000 establishing a framework for Community action in the field of water policy. Official Journal L327 of 22.12.2000.
Feger, K.-H., 1993a. The ARINUS project: effects of whole-watershed nitrogen and sulfur additions on biogeochemical cycling in spruce forests. In: Ecosystems Research Report, L. Rasmussen, T. Brydges and P. Mathy (Eds.). 4, 1222. Feger, K.-H., 1993b. Bedeutung von ökosysteminternen Umsätzen
und Nutzungseingriffen für den Stoffhaushalt von Waldlandschaften. Freiburger Bodenkundl. Abh., Band 31. Feger, K.-H., Brahmer, G. and Zöttl, H.W., 1990. Element budgets
of two contrasting catchments in the Black Forest (Federal Republic of Germany). J. Hydrol., 116, 8599.
Fitzgerald, J.W. and Autry, A.R., 1992. Organic sulfur dynamics including mineralization and immobilization of various organic fractions. In: Atmospheric deposition and forest nutrient cycling, W.J. Dale and S.E. Lindberg (Eds.). Springer, Ecological
Studies, 91, 118129.
Gbondo-Tugbawa, S.S., Driscoll, C.T., Mitchell, M.J., Aber, J.D. and Likens, G.E., 2002. A model to simulate the response of a northern hardwood forest ecosystem to changes in S deposition.
Ecol. Applic., 12, 823.
Kurth, F., Feger, K.-H. and Fischer, M., 1989. Sulfat-adsorptionskapazität und Schwefelbindungsformen in Böden des Schwarzwaldes. In: Immissionsbelastung des Waldes und
seiner Böden Gefahr für die Gewässer? DVWK Mitteilungen,
17, 149156.
Mayer, B., Feger, K.H., Giesemann, A. and Jäger, H.-J., 1995. Interpretation of sulfur cycling in two catchments in the Black Forest (Germany) using stable sulfur and oxygen isotope data.
Biogeochemistry, 30, 3158.
Maynard, D.G., Stewart, J.W.B. and Bettany, J.R., 1985. The effects of plants on soil sulfur transformations. Soil Biol.
Biochem., 17 , 127134.
McGill, W.B. and Cole, C.V., 1981. Comparative aspects of cycling of organic C, N, S and P through soil organic matter. Geoderma,
26, 267286.
Mitchell, M.J., David, M.B., Maynard, D.G. and Telang, S.A., 1986. Sulfur constituents in soils and streams of a watershed in the Rocky Mountains of Alberta. Can. J. Forest Res., 16, 315 320.
Mylona, S., 1996. Sulphur dioxide emissions in Europe 1880-1991 and their effect on sulphur concentrations and depositions.
Tellus, 48B, 662689.
Norman, A.L., Giesemann, A., Krouse, H.R. and Jäger, H.J., 2002. Sulphur isotope fractionation during sulphur mineralization: results of an incubation-extraction experiment with a Black Forest soil. Soil Biol. Biochem., 34, 14251438.
Prechtel, A., Alewell, C., Armbruster, M., Bittersohl, J., Cullen, J.M., Evans, C.D., Helliwell, R., Kopácek, J., Marchetto, A., Matzner, E., Meesenburg, H., Moldan, F., Moritz, K., Vesely, J. and Wright, R., 2001. Response of sulphur dynamics in European catchments to decreasing sulphate deposition. Hydrol.
Earth Syst. Sci., 5, 311325.
Prietzel, J., 1998a. Untersuchungen zur Boden-Schwefel-Ausstattung zweier Schwarzwaldstandorte räumliche Variabilität, zeitliche Dynamik und Auswirkungen experimenteller Sulfatgaben. Habilitation Thesis, University of
Munich, 1399.
Prietzel, J., 1998b. Untersuchungen zum S-Haushalt Zusammenfassende Diskussion. In: Ökosystemforschung im
Schwarzwald, S. Raspe, K.H. Feger and H.W. Zöttl (Eds.).
Ecomed, Freiburg, Germany. 1-533.
Prietzel, J., Weick, C., Korintenberg, J., Seybold, G., Thumerer, T. and Treml, B., 2001. Effects of repeated (NH4)2SO4
application on sulfur pools in soil, soil microbial biomass, and ground vegetation of two watersheds in the Black Forest/ Germany. Plant Soil, 230, 287305.
Reuss, J.O. and Johnson, D.W., 1985. Effect of soil processes on the acidification of water by acid deposition. J. Environ. Qual.,
14 , 2631.
Schöpp, W., Posch, M., Mylona, S. and Johansson, J., 2003. Trends in acid deposition (1880-2030) for sensitive freshwater regions in Europe. Hydrol. Earth Syst. Sci., 7, 436446.
Simon, B., Feger, K.-H. and Zöttl, H.W., 1989. Mikrobielle N-und S-Umsetzungen im Auflagehumus N-und oberen Mineralbodenhorizonten von Schwarzwaldböden. In:
Immissionsbelastung des Waldes und seiner Böden Gefahr für die Gewässer? DVWK Mitteilungen, 17, 157165.
Sullivan, T.J. and Cosby, B.J., 1998. Modeling the concentration of aluminium in surface waters. Water Air Soil Pollut., 105, 643659.
Torssander, P. and Mörth, C.-M., 1998. Sulfur dynamics in the roof experiment at Lake Gårdsjön deduced from sulfur and oxygen isotope ratios in sulfate. In: Experimental reversal of
acid rain effects: The Gårdsjön roof project, H. Hultberg and