HAL Id: hal-02446168
https://hal.archives-ouvertes.fr/hal-02446168
Submitted on 21 Jan 2021
HAL is a multi-disciplinary open access
archive for the deposit and dissemination of
sci-entific research documents, whether they are
pub-lished or not. The documents may come from
teaching and research institutions in France or
abroad, or from public or private research centers.
L’archive ouverte pluridisciplinaire HAL, est
destinée au dépôt et à la diffusion de documents
scientifiques de niveau recherche, publiés ou non,
émanant des établissements d’enseignement et de
recherche français ou étrangers, des laboratoires
publics ou privés.
particle formation based on long-term measurements
Tuomo Nieminen, Veli-Matti Kerminen, Tuukka Petäjä, Pasi Aalto, Mikhail
Arshinov, Eija Asmi, Urs Baltensperger, David Beddows, Johan Paul Beukes,
Don Collins, et al.
To cite this version:
Tuomo Nieminen, Veli-Matti Kerminen, Tuukka Petäjä, Pasi Aalto, Mikhail Arshinov, et al.. Global
analysis of continental boundary layer new particle formation based on long-term measurements.
Atmospheric Chemistry and Physics, European Geosciences Union, 2018, 18 (19), pp.14737-14756.
�10.5194/acp-18-14737-2018�. �hal-02446168�
https://doi.org/10.5194/acp-18-14737-2018 © Author(s) 2018. This work is distributed under the Creative Commons Attribution 4.0 License.
Global analysis of continental boundary layer new particle
formation based on long-term measurements
Tuomo Nieminen1,2, Veli-Matti Kerminen1, Tuukka Petäjä1, Pasi P. Aalto1, Mikhail Arshinov3, Eija Asmi4,5, Urs Baltensperger6, David C. S. Beddows7, Johan Paul Beukes8, Don Collins9, Aijun Ding10, Roy M. Harrison7,11, Bas Henzing12, Rakesh Hooda4,13, Min Hu14, Urmas Hõrrak15, Niku Kivekäs4, Kaupo Komsaare15, Radovan Krejci16, Adam Kristensson17, Lauri Laakso4,8, Ari Laaksonen4,2, W. Richard Leaitch18, Heikki Lihavainen4,
Nikolaos Mihalopoulos19, Zoltán Németh20, Wei Nie10, Colin O’Dowd21, Imre Salma20, Karine Sellegri22,
Birgitta Svenningsson17, Erik Swietlicki17, Peter Tunved16, Vidmantas Ulevicius23, Ville Vakkari4, Marko Vana15, Alfred Wiedensohler24, Zhijun Wu14, Annele Virtanen2, and Markku Kulmala1,10,25
1Institute for Atmospheric and Earth System Research/Physics, Faculty of Science, University of Helsinki, Helsinki, Finland 2Department of Applied Physics, University of Eastern Finland, Kuopio, Finland
3V.E. Zuev Institute of Atmospheric Optics SB RAS, Tomsk, Russia 4Finnish Meteorological Institute, Helsinki, Finland
5Servicio Meteorológico Nacional, Buenos Aires, Argentina
6Laboratory of Atmospheric Chemistry, Paul Scherrer Institute, Villigen, Switzerland
7School of Geography, Earth and Environmental Sciences, University of Birmingham, Birmingham, UK 8Unit for Environmental Sciences and Management, North-West University, Potchefstroom, South Africa 9Department of Atmospheric Sciences, Texas A&M University, College Station, Texas, USA
10Joint International Research Laboratory of Atmospheric and Earth System Sciences, School of Atmospheric Sciences,
Nanjing University, Nanjing 210023, China
11Department of Environmental Sciences/Center of Excellence in Environmental Studies, King Abdulaziz University,
PO Box 80203, Jeddah, 21589, Saudi Arabia
12Netherlands Organization for Applied Scientific Research (TNO), Utrecht, the Netherlands 13The Energy and Resources Institute, IHC, Lodhi Road, New Delhi, India
14State Key Joint Laboratory of Environmental Simulation and Pollution Control, College of Environmental Sciences and
Engineering, Peking University, Beijing 100871, China
15Institute of Physics, University of Tartu, Tartu, Estonia
16Department of Environmental Science and Analytical Chemistry & Bolin Centre of Climate Research,
Stockholm University, Stockholm, Sweden
17Department of Physics, Lund University, Lund, Sweden
18Climate Research Division, Environment and Climate Change Canada, Toronto, Canada 19Department of Chemistry, University of Crete, Heraklion, Greece
20Institute of Chemistry, Eötvös University, Budapest, Hungary
21School of Physics and Centre for Climate and Air Pollution Studies, National University of Ireland Galway, Galway, Ireland 22Laboratoire de Météorologie Physique, Observatoire de Physique du Globe de Clermont-Ferrand,
Université Clermont-Auvergne, CNRS UMR6016, Aubière, France
23Department of Environmental Research, SRI Center for Physical Sciences and Technology, Vilnius, Lithuania 24Leibniz Institute for Tropospheric Research, Leipzig, Germany
25Aerosol and Haze Laboratory, Beijing Advanced Innovation Center for Soft Matter Science and Engineering,
Beijing University of Chemical Technology, Beijing, China Correspondence: Tuomo Nieminen ([email protected]) Received: 23 March 2018 – Discussion started: 12 April 2018
Abstract. Atmospheric new particle formation (NPF) is an important phenomenon in terms of global particle number concentrations. Here we investigated the frequency of NPF, formation rates of 10 nm particles, and growth rates in the size range of 10–25 nm using at least 1 year of aerosol num-ber size-distribution observations at 36 different locations around the world. The majority of these measurement sites are in the Northern Hemisphere. We found that the NPF fre-quency has a strong seasonal variability. At the measurement sites analyzed in this study, NPF occurs most frequently in March–May (on about 30 % of the days) and least frequently in December–February (about 10 % of the days). The median formation rate of 10 nm particles varies by about 3 orders of magnitude (0.01–10 cm−3s−1) and the growth rate by about an order of magnitude (1–10 nm h−1). The smallest values of both formation and growth rates were observed at polar sites and the largest ones in urban environments or anthropogeni-cally influenced rural sites. The correlation between the NPF event frequency and the particle formation and growth rate was at best moderate among the different measurement sites, as well as among the sites belonging to a certain environmen-tal regime. For a better understanding of atmospheric NPF and its regional importance, we would need more observa-tional data from different urban areas in practically all parts of the world, from additional remote and rural locations in North America, Asia, and most of the Southern Hemisphere (especially Australia), from polar areas, and from at least a few locations over the oceans.
1 Introduction
Atmospheric aerosol particles have large impacts on air qual-ity and human health (Apte et al., 2015; Brauer et al., 2015; Lelieveld et al., 2015; Zhang et al., 2015), on the current and future behavior of the climate system (IPCC, 2013; Shindell et al., 2015), and on climate–air quality interactions (Makko-nen et al., 2012; Lacressonniere et al., 2014; Pietikäi(Makko-nen et al., 2015; Westervelt et al., 2015; Shen et al., 2017). Accord-ing to large-scale model simulations, globally the most im-portant source of atmospheric aerosol particles, at least in terms of their total number concentration but perhaps also of climate-relevant particles, is atmospheric new particle forma-tion (NPF) and subsequent particle growth (e.g., Spracklen et al., 2008; Merikanto et al., 2009; Yu et al., 2010; Dunne et al., 2016). The relative importance of atmospheric NPF and primary emissions of aerosol particles into the atmosphere is, however, expected to vary regionally, as well as over the course of the year at any specific location.
Particle number size distribution measurements suggest that atmospheric boundary layer NPF is dominated by regional-scale NPF events. These events typically last for at least a few hours and simultaneously take place over
dis-tances of hundreds of kilometers. Regional NPF events have been observed worldwide (e.g., Kulmala et al., 2004) and have also been characterized for a few relatively large ar-eas in Europe, China, and North America (Manninen et al., 2010; Peng et al., 2014; Pietikäinen et al., 2014; Yu et al., 2015; Kulmala et al., 2016; Vana et al., 2016; Berland et al., 2017; Wang et al., 2017). In spite of numerous and an increasing number of high-quality atmospheric aerosol size-distribution measurements, we are still lacking a global ob-servationally based and internally consistent data set on at-mospheric NPF that would cover the full annual cycle. Such data, especially from the Southern Hemisphere and tropics, would be valuable for multiple purposes, including global and regional model validation and complementary use of var-ious modeling and measurement tools to enhance our general understanding of this phenomenon.
The primary goal of this study is to present the first global-scale picture of the main characteristics of atmospheric NPF based on atmospheric observations, including the seasonal frequency of regional NPF events and the formation and growth rates (GRs) of the newly formed particles during these events. More specifically, we aim to shed new light on the following questions:
1. How frequent is regional NPF in different types of con-tinental environments overall and during the different seasons?
2. How do the particle formation and GRs, as recorded during the observed NPF events, vary with the type of environment and season?
3. To which extent are the NPF event frequency and the particle formation and GRs connected with each other? In order to address our goal and specific questions, we gath-ered observations of atmospheric NPF from several measure-ment sites where at least 1 year of particle number size dis-tribution measurements are available. Since the number of such sites turned out to be rather limited, we included sites with shorter data coverage, provided that these data could be parsed into a full seasonal cycle. Published peer-reviewed ar-ticles do not always present NPF event frequencies or parti-cle formation and GRs. Therefore we collected observational data of submicron aerosol number size distributions from open databases (EBAS and ARM) and performed a standard-ized NPF analysis (see, e.g., Kulmala et al., 2012) for these data. This way, we were able to create an internally consis-tent data set on atmospheric NPF. This feature is not only crucial to the reliability of the result presented here but also extremely beneficial for any further use of our data.
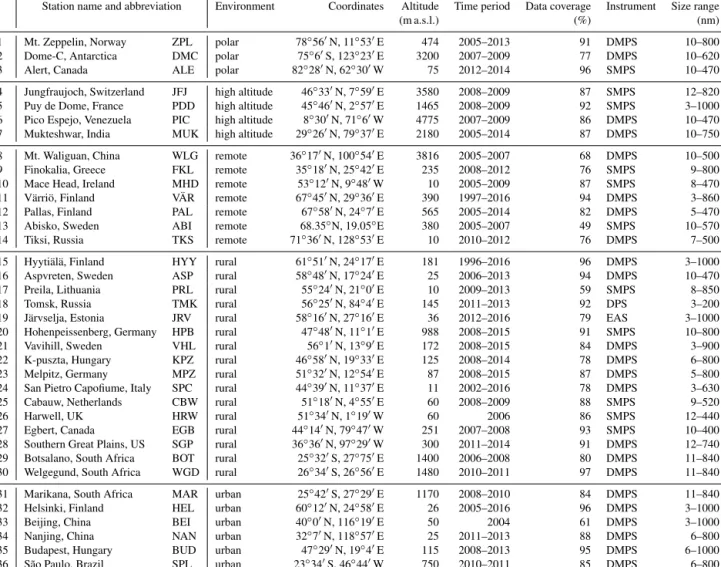
Table 1. List of the measurement sites included in this study, the station name abbreviation used to identify the sites in all the figures, station environment type, coordinates and altitude above sea level (a.s.l.), time period from which data were analyzed, availability of data (percentage of days with available data between start and end of the studied time period), instrumentation, and the particle size range. The instruments used to measure aerosol number size distributions were a differential mobility particle sizer (DMPS), scanning mobility particle sizer (SMPS), diffusion particle spectrometer (DPS), and electrical aerosol spectrometer (EAS).
Station name and abbreviation Environment Coordinates Altitude Time period Data coverage Instrument Size range
(m a.s.l.) (%) (nm)
1 Mt. Zeppelin, Norway ZPL polar 78◦560N, 11◦530E 474 2005–2013 91 DMPS 10–800
2 Dome-C, Antarctica DMC polar 75◦60S, 123◦230E 3200 2007–2009 77 DMPS 10–620 3 Alert, Canada ALE polar 82◦280N, 62◦300W 75 2012–2014 96 SMPS 10–470 4 Jungfraujoch, Switzerland JFJ high altitude 46◦330N, 7◦590E 3580 2008–2009 87 SMPS 12–820 5 Puy de Dome, France PDD high altitude 45◦460N, 2◦570E 1465 2008–2009 92 SMPS 3–1000 6 Pico Espejo, Venezuela PIC high altitude 8◦300N, 71◦60W 4775 2007–2009 86 DMPS 10–470 7 Mukteshwar, India MUK high altitude 29◦260N, 79◦370E 2180 2005–2014 87 DMPS 10–750 8 Mt. Waliguan, China WLG remote 36◦170N, 100◦540E 3816 2005–2007 68 DMPS 10–500 9 Finokalia, Greece FKL remote 35◦180N, 25◦420E 235 2008–2012 76 SMPS 9–800 10 Mace Head, Ireland MHD remote 53◦120N, 9◦480W 10 2005–2009 87 SMPS 8–470
11 Värriö, Finland VÄR remote 67◦450N, 29◦360E 390 1997–2016 94 DMPS 3–860 12 Pallas, Finland PAL remote 67◦580N, 24◦70E 565 2005–2014 82 DMPS 5–470 13 Abisko, Sweden ABI remote 68.35◦N, 19.05◦E 380 2005–2007 49 SMPS 10–570
14 Tiksi, Russia TKS remote 71◦360N, 128◦530E 10 2010–2012 76 DMPS 7–500 15 Hyytiälä, Finland HYY rural 61◦510N, 24◦170E 181 1996–2016 96 DMPS 3–1000 16 Aspvreten, Sweden ASP rural 58◦480N, 17◦240E 25 2006–2013 94 DMPS 10–470 17 Preila, Lithuania PRL rural 55◦240N, 21◦00E 10 2009–2013 59 SMPS 8–850
18 Tomsk, Russia TMK rural 56◦250N, 84◦40E 145 2011–2013 92 DPS 3–200 19 Järvselja, Estonia JRV rural 58◦160N, 27◦160E 36 2012–2016 79 EAS 3–1000 20 Hohenpeissenberg, Germany HPB rural 47◦480N, 11◦10E 988 2008–2015 91 SMPS 10–800
21 Vavihill, Sweden VHL rural 56◦10N, 13◦90E 172 2008–2015 84 DMPS 3–900 22 K-puszta, Hungary KPZ rural 46◦580N, 19◦330E 125 2008–2014 78 DMPS 6–800 23 Melpitz, Germany MPZ rural 51◦320N, 12◦540E 87 2008–2015 87 DMPS 5–800
24 San Pietro Capofiume, Italy SPC rural 44◦390N, 11◦370E 11 2002–2016 78 DMPS 3–630 25 Cabauw, Netherlands CBW rural 51◦180N, 4◦550E 60 2008–2009 88 SMPS 9–520 26 Harwell, UK HRW rural 51◦340N, 1◦190W 60 2006 86 SMPS 12–440 27 Egbert, Canada EGB rural 44◦140N, 79◦470W 251 2007–2008 93 SMPS 10–400 28 Southern Great Plains, US SGP rural 36◦360N, 97◦290W 300 2011–2014 91 DMPS 12–740 29 Botsalano, South Africa BOT rural 25◦320S, 27◦750E 1400 2006–2008 80 DMPS 11–840 30 Welgegund, South Africa WGD rural 26◦340S, 26◦560E 1480 2010–2011 97 DMPS 11–840 31 Marikana, South Africa MAR urban 25◦420S, 27◦290E 1170 2008–2010 84 DMPS 11–840 32 Helsinki, Finland HEL urban 60◦120N, 24◦580E 26 2005–2016 96 DMPS 3–1000 33 Beijing, China BEI urban 40◦00N, 116◦190E 50 2004 61 DMPS 3–1000
34 Nanjing, China NAN urban 32◦70N, 118◦570E 25 2011–2013 88 DMPS 6–800 35 Budapest, Hungary BUD urban 47◦290N, 19◦40E 115 2008–2013 95 DMPS 6–1000 36 São Paulo, Brazil SPL urban 23◦340S, 46◦440W 750 2010–2011 85 DMPS 6–800
2 Description of the data and data analysis methods Data of aerosol number concentration size distributions was obtained from the EBAS (http://ebas.nilu.no/ (last ac-cess: 15 August 2017) and ARM (http://www.archive.arm. gov/discovery/ (last access: 13 June 2017)) databases and from several research groups running long-term atmospheric aerosol measurements. Mobility-based particle spectrome-ters (differential mobility particle sizer, DMPS; scanning mo-bility particle sizer, SMPS) typically have lower detection limits varying between 3 and 10 nm in particle diameter. In order to have comparable results among different sites, a common size range of 10–25 nm was used for nucleation-mode particles in this study.
As part of the data analysis of this study, all the data were visually examined. Time periods when there was
sus-picion of instrument malfunction or other effects affecting the quality of the data were left out of the subsequent analy-sis. It should be noted, however, that the different measure-ment setups used at different measuremeasure-ment sites (and possi-bly changes in the measurement setups) could introduce bi-ases among the data sets from different measurement sites. In the literature, there are a few guidelines for ambient aerosol size-distribution measurements and quality assurance proce-dures (e.g., Wiedensohler et al., 2012, 2017), but not all of the measurement sites follow these guidelines.
Altogether, we identified 36 measurement sites world-wide, for which particle number size distributions have been measured for at least 1 year (either continuously or during separate campaigns covering the full annual cycle). These sites were divided into five groups based on their general en-vironmental characteristics (Table 1, Fig. 1), ranging from
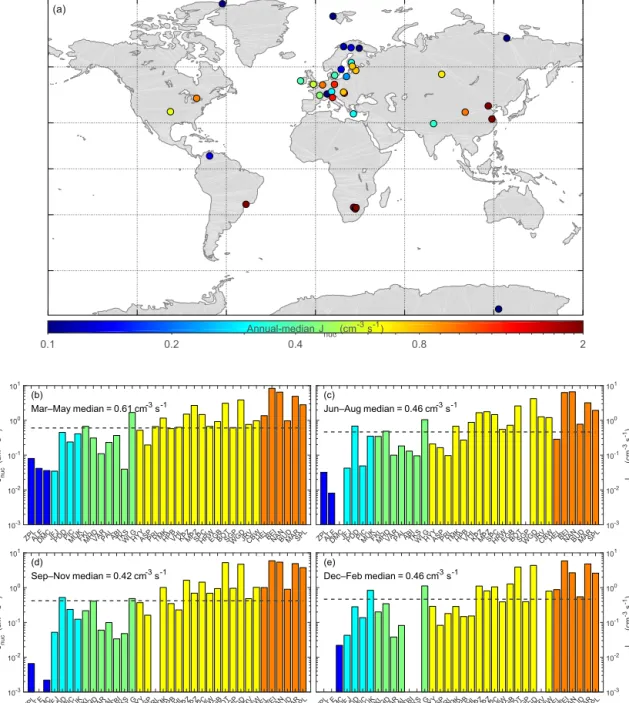
180oW 120oW 60oW 0o 60oE 120oE 180oW 60 S o 30 S o 0o 30 N o 60 N o Polar High altitude Remote Rural Urban
Figure 1. Geographical coverage of the measurement sites offering long-term (at least 1 full year) aerosol number size distribution in the submicron size range. The color of the points refers to the group-ing of the sites in Table 1 accordgroup-ing to their environment type.
polar and other remote areas with low anthropogenic influ-ence to heavily polluted megacities. While most of the sites included in this study are located in Europe, we have at least two measurement sites from every other continent except Antarctica (only one site) and Australia (no sites). The mea-surement period lengths range from 1 year at two sites to just over 20 years in the Finnish boreal forest site. Most of the sites had data available for 5–10 years (Table 1).
Concerning the global spatial representativeness of the data sets analyzed in this study, it should be kept in mind that we have considered only measurements from continen-tal areas that cover 29 % of the Earth’s surface, the rest being the oceans. Although the emissions of nucleation precursors and condensing vapors from the sea are much smaller than from the land vegetation (Carpenter et al., 2012), the larger overall surface area that they represent and the subsequent impacts on cloud cover may have a significant influence on global climate. However, currently there is no evidence in the published literature from available measurements that NPF over the ocean is a common phenomenon compared to conti-nental environments. Thus, as a future challenge, it would be very important to obtain similar long-term observations from at least a few locations over the Atlantic, Pacific, and Arctic oceans.
2.1 Description of the measurement sites
Here we present a very short summary of the 36 sites in-cluded in this study. For more detailed information about each site, including their infrastructure, measurement pro-gram, and environmental characteristics, we refer to the pub-lications cited below.
2.1.1 Polar sites
The Zeppelin Observatory (ZPL) is located on top of Mt. Zeppelin, Svalbard (78◦560N, 11◦530E, 474 m above sea
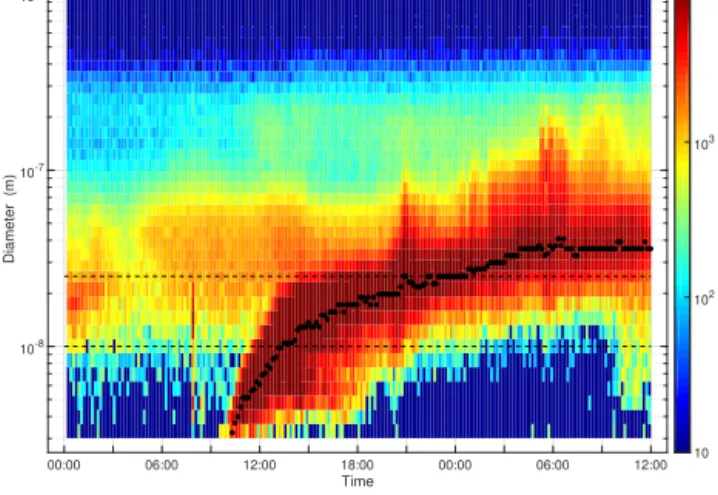
00:00 06:00 12:00 18:00 00:00 06:00 12:00 Time 10-8 10-7 10-6 Diameter (m) 10 102 103 104 dN /dlog 10 dp (cm -3)
Figure 2. An example of a new particle formation event observed in Hyytiälä, Finland, 15–16 March 2011, illustrating the continuous growth of the newly formed aerosol particles for about 25 h. The ge-ometric mean size of the fitted lognormal size distributions is shown with black dots, and the black dashed lines show the 10–25 nm size
range that is used for calculating the formation rate Jnucand growth
rate GRnuc.
level, a.s.l.), and is situated just outside the small community of Ny-Ålesund. It is part of the ACTRIS, GAW, and ICOS programs. The station is mostly unaffected by local sources and is considered to be within the boundary layer most of the time. The station represents remote Arctic conditions and of-fers a unique possibility to study the characteristic features of Arctic atmospheric trace constituents such as trace gases and aerosols (Tunved et al., 2013).
The Dome-C site (DMC) is located at the East Antarc-tica plateau at the Italian–French Concordia station, 1100 km away from the coast (75◦060S, 123◦230E, 3200 m a.s.l.; Järvinen et al., 2013). The station buildings are 1 km from the sampling site and upwind relative to the prevailing wind direction. The aerosol measurements with respect to the wind direction from the station are excluded from our analysis.
Alert (ALE) of the Canadian Aerosol Baseline Measure-ment Program is the northernmost atmospheric measure-ment site in the world, located on the northeastern part of Ellesmere Island in Nunavut (82◦280N, 62◦300W, 75 m a.s.l.; Leaitch et al., 2013). It is part of the World Meteorological Organization’s Global Atmosphere Watch (GAW) network. Alert is characterized by clean Arctic air during summer and long-range transport of more polluted air in southerly air masses primarily from Europe and Asia during winter and spring.
2.1.2 High-altitude sites
Jungfraujoch (JFJ) is a background site located in the Alps on a mountain ridge away from major pollution sources, and be-longs to the GAW network (46◦330N, 7◦590E, 3580 m a.s.l; Boulon et al., 2010; Bianchi et al., 2016; Bukowiecki et al.,
10 20 30 40 50 60 70 Annual-median NPF frequency (%) (a) (b) Mar–May median = 31 % ZPLALEDMCJFJPDDPICMUKFKLMHDVÄRPALABITKSWLGHYYASPPRLTMKHPBVHLKPZMPZSPCHRWEGBBOTSGPWGDJRVCBWHELBEINANBUDMARSPL 0 20 40 60 80 NPF frequency (%) (c) Jun–Aug median = 27 % ZPLALEDMCJFJPDDPICMUKFKLMHDVÄRPALABITKSWLGHYYASPPRLTMKHPBVHLKPZMPZSPCHRWEGBBOTSGPWGDJRVCBWHELBEINANBUDMARSPL 0 20 40 60 80 NPF frequency (%) (d) Sep–Nov median = 20 % ZPLALEDMCJFJPDDPICMUKFKLMHDVÄRPALABITKSWLGHYYASPPRLTMKHPBVHLKPZMPZSPCHRWEGBBOTSGPWGDJRVCBWHELBEINANBUDMARSPL 0 20 40 60 80 NPF frequency (%) (e) Dec–Feb median = 8 % ZPLALEDMCJFJPDDPICMUKFKLMHDVÄRPALABITKSWLGHYYASPPRLTMKHPBVHLKPZMPZSPCHRWEGBBOTSGPWGDJRVCBWHELBEINANBUDMARSPL 0 20 40 60 80 NPF frequency (%)
Figure 3. Annual-median (a) and seasonal-median (b–e) frequency of the NPF formation events at the different measurement sites. The dashed lines in panels (b–e) show the median seasonal values, and the color scheme represents the classification of the sites into polar, high-altitude, remote, rural, and urban environments.
2016). It contributes to numerous networks, including GAW, ACTRIS, ICOS, NDACC, and AGAGE. For approximately 40 % of the time the station is inside clouds, and part of the time the station is considered to be in the free troposphere.
The Puy de Dôme GAW research station (PDD; 45◦460N, 2◦570E) is located in central France, approximately 200 km from the Atlantic Ocean coast and 150 km from the Mediter-ranean Sea. It is on top of a volcano, at 1465 m a.s.l., and may be located either in the continental boundary layer or the free
troposphere (Venzac et al., 2009; Boulon et al., 2011). It is representative of a large regional fingerprint and is classified as a background regional site (Asmi et al., 2011).
Pico Espejo (PIC; 8◦300N, 71◦60W) is a tropical high-altitude station located at 7◦N on top of the Venezuelan An-des at an altitude of 4775 m a.s.l. (Schmeissner et al., 2011). It is representative of the tropical free troposphere and for studies on the influence of orographic lifting of boundary layer air to the free troposphere.
0.1 0.2 0.4 0.8 2 Annual-median Jnuc (cm-3 s-1) (a) (b) Mar–May median = 0.61 cm s-3 -1 ZPLALEDMCJFJPDDPICMUKFKLMHDVÄRPALABITKSWLGHYYASPPRLTMKHPBVHLKPZMPZSPCHRWEGBBOTSGPWGDJRVCBWHELBEINANBUDMARSPL 10-3 10-2 10-1 100 101 Jnuc (cm -3 s -1) (c) Jun–Aug median = 0.46 cm s-3 -1 ZPLALEDMCJFJPDDPICMUKFKLMHDVÄRPALABITKSWLGHYYASPPRLTMKHPBVHLKPZMPZSPCHRWEGBBOTSGPWGDJRVCBWHELBEINANBUDMARSPL 10-3 10-2 10-1 100 101 Jnuc (cm -3 s -1) (d) Sep–Nov median = 0.42 cm s-3 -1 ZPLALEDMCJFJPDDPICMUKFKLMHDVÄRPALABITKSWLGHYYASPPRLTMKHPBVHLKPZMPZSPCHRWEGBBOTSGPWGDJRVCBWHELBEINANBUDMARSPL 10-3 10-2 10-1 100 101 Jnuc (cm -3 s -1) (e) Dec–Feb median = 0.46 cm s-3 -1 ZPLALEDMCJFJPDDPICMUKFKLMHDVÄRPALABITKSWLGHYYASPPRLTMKHPBVHLKPZMPZSPCHRWEGBBOTSGPWGDJRVCBWHELBEINANBUDMARSPL 10-3 10-2 10-1 100 101 Jnuc (cm -3 s -1)
Figure 4. Annual-median (a) and seasonal-median (b–e) particle formation rate at the different measurement sites. The dashed lines in panels (b–e) show the median seasonal values, and the color scheme represents the classification of the sites into polar, high-altitude, remote, rural, and urban environments.
The Mukteshwar station (MUK; 29◦260N, 79◦370E, 2180 m a.s.l.) is located in northeast India about 250 km from Delhi at the foothills of the central Himalayan mountains (Hyvärinen et al., 2009; Neitola et al., 2011). The area sur-rounding the site consists of low mountains (peaks at 1500– 2500 m a.s.l.) between the plains (100–200 m a.s.l.) and the Himalayas (peaks at 6000–8000 m a.s.l). The site is influ-enced by regional polluted air that has been transported from the plains below.
2.1.3 Remote sites
The Finokalia station (FKL; 35.3◦N, 25.7◦E; 235 m a.s.l) is
located at the top of a hill over the coastline, in the northeast-ern part of the island of Crete (Greece). The station is little influenced by local anthropogenic sources and it is consid-ered representative for the background marine conditions of the eastern Mediterranean (Mihalopoulos et al., 1997).
Mace Head (MHD; 53.2◦N, 9.8◦W; 10 m a.s.l) is a coastal station on the west coast of Ireland and receives clean
ma-rine air masses from the northeastern Atlantic approximately 50 % of the time. It serves as an excellent background ma-rine aerosol characterization station as well as a polluted Eu-ropean outflow station. Mace Head is a WMO-GAW global station and an EMEP supersite and contributes to the AC-TRIS and AGAGE networks. A full description can be found in O’Connor et al. (2008) and O’Dowd et al. (2014).
The Värriö (VÄR) SMEAR I (Station for Measuring For-est Ecosystem–Atmosphere Relations) measurement site is located on top of the Kotovaara fjeld, surrounded by a 60-year-old Scots pine forest (67◦450N, 29◦360E, 390 m a.s.l). The station is close to the Finnish–Russian border and is at times impacted by the air pollution coming from the Kola Peninsula mining and industrial areas 200–300 km northeast and east from the station (Kyrö et al., 2014).
The Pallas Atmosphere-Ecosystem Supersite station (PAL; 67◦580N, 24◦070E; 565 m a.s.l.) is located in northern
Finland. The main station building is within a natural park area, on top of a hill above the tree line (Hatakka et al., 2003; Lohila et al., 2015). It is surrounded by vegetation of low vascular plants, moss, and lichen. The environment is repre-sentative of remote sub-Arctic and boreal forests. The station contributes to numerous European and global research pro-grams, such as GAW, ICOS, ACTRIS, and EMEP.
The Abisko measurement station (ABI) is located in a dis-continuous permafrost zone at the Stordalen mire, approxi-mately 14 km east of the small village of Abisko in north-ern Sweden (68.35◦N, 19.05◦E, 380 m a.s.l). The area is characterized by subarctic birch forest, wetlands, and tundra ecosystems as well as a low population density (Svennings-son et al., 2008).
The Tiksi Hydrometeorological Observatory (TKS;
71◦360N, 128◦530E, 10 m a.s.l) is located in northern
Siberia on the coast of the Laptev Sea (Uttal et al., 2013; Asmi et al., 2016). The station is about 5 km southwest from the city of Tiksi and about 500 m from the sea. The site is surrounded by low tundra vegetation with no trees.
The Waliguan Baseline Observatory (WLG; 36◦170N, 100◦540E, 3816 m a.s.l; Kivekäs et al., 2009) is part of the GAW network, situated on top of Mt. Waliguan, located at the edge of the northeastern part of the Qinghai–Xizang (Ti-bet) Plateau in a remote region of western China. Even though the station is located at a mountain peak and at a very high altitude, a clear planetary boundary layer–free tropo-sphere daily cycle in aerosol properties is not observed there. Therefore the Waliguan site is more representative of remote conditions.
2.1.4 Rural sites
The Hyytiälä measurement site (HYY) is at the SMEAR II station located in southern Finland 60 km northeast from Tampere (61◦510N, 24◦170E, 181 m a.s.l.; Hari and Kulmala, 2005). The station is equipped with extensive facilities to measure forest ecosystem–atmosphere interactions
continu-ously and comprehensively. A rather homogeneous conifer-ous boreal forest surrounds this rural continental station.
Aspvreten (ASP) is located ca. 2 km inland from the Baltic Sea (58.8◦N, 17.4◦E, 25 m a.s.l.) and some 80 km south of Stockholm. The surroundings are dominated by deciduous and coniferous forest, and the station is relatively unaffected by local anthropogenic activities (Tunved et al., 2004).
The Preila station (PRL; 55.4◦N, 21.0◦E, 10 m a.s.l.) is located in the western part of Lithuania on the shore of the Baltic Sea, on the Curonian Spit. The Curonian Spit is a nar-row sandy strip peninsula (0.4 to 4.0 km in width), which separates the Baltic Sea from the Curonian Lagoon. Its width is approximately 2 km at the Preila site. The dunes, up to 50 m in height, as well as natural forests in low-lying lands predominate in the region. The marine, submarine climate is specific to this terrain. This monitoring site was selected ac-cording to strict criteria designed to avoid undue influence from point sources, area sources, and local activities (Pau-raite et al., 2015).
The Tomsk Fonovaya Observatory (TMK) for monitoring atmospheric composition is located in the southern taiga belt of West Siberia (56◦250N, 84◦40E, 145 m a.s.l.; Matvienko et al., 2015). It is representative of a background boreal en-vironment and is situated on the bank of the river Ob, 60 km west of the city of Tomsk. In close proximity to the site there is a mixed forest and large areas surrounding the site are cov-ered mainly with coniferous trees.
The Järvselja SMEAR Estonia station (JRV) is located in the Järvselja Experimental Forest in the southeastern part of Estonia, about 35 km southeast of Tartu (58◦160N, 27◦160E, 36 m a.s.l.; Noe et al., 2015; Vana et al., 2016). The site, lo-cated in the vicinity of Lake Peipus, is surrounded by mixed forest in the hemi-boreal forest zone. There are no large vil-lages or cities near the site.
Hohenpeissenberg (HPB) is a GAW station located 60 km south of Munich on a mountain elevated 300 m above the surrounding countryside in southern Germany (47◦480N, 11◦10E, 988 m a.s.l.; Birmili et al., 2003). There are no major anthropogenic pollution sources nearby the station.
Vavihill station (VHL) is located at the southernmost part of Sweden (56◦10N, 13◦90E, 172 m a.s.l.; Kristensson et al., 2008). The station is away from local air pollution sources but still within 40–45 km from the densely populated cities of Malmö and Copenhagen. Air masses arriving at the station from the northwest to northeast are typically very clean.
The K-puszta site (KPZ) is located in a rural area in Hungary, 15 km away from the nearest town of Kecskemét and 71 km from Budapest (46◦580N, 19◦330E, 125 m a.s.l.;
Salma et al., 2016a). The station is in a clearing within a mixed forest of coniferous and deciduous trees.
Melpitz (MPZ) is located 40 km northeast of Leipzig and surrounded by flat and seminatural grasslands without any obstacles in all directions (51◦320N, 12◦540E, 87 m a.s.l.; Hamed et al., 2010). Agricultural pastures and wooded ar-eas make up the wider regional surroundings of this regional
background site. It is representative of the central European background. Measurements at the Melpitz site are part of ACTRIS, GUAN, and GAW programs.
The San Pietro Capofiume station (SPC) is located in the Po Valley, Italy, approximately 30 km from Bologna (44◦390N, 11◦370E, 11 m a.s.l.; Hamed et al., 2007). The Po Valley area is an industrial and agricultural area with a high population density. The station itself is in rural area sur-rounded by the Adriatic Sea on the east and densely popu-lated areas on its southern, western, and northern sides.
The Cabauw (CBW) Experimental Site for Atmospheric Research (CESAR) is located in the central Netherlands close to the North Sea (51◦180N, 4◦550E, 60 m a.s.l.; Russ-chenberg et al., 2005). The CESAR observatory is located at a rural site with flat meadows in an otherwise densely popu-lated area. It is representative for different environments de-pending on the wind directions.
The Harwell measurement site (HRW) is located in a ru-ral environment in southern England (51◦340N, 1◦190W, 60 m a.s.l.; Charron et al., 2007). It is representative of the rural background in one of the more densely populated areas within western Europe.
The Egbert site (EGB) of Environment and Climate Change Canada Centre for Atmospheric Research Experi-ments is located in rural Ontario surrounded by agricultural areas and small towns (44◦140N, 79◦470W, 251 m a.s.l; Ru-pakheti et al., 2005; Slowik et al., 2010; Pierce et al., 2014). With extensive forest to the north and the major urban cen-ter of Toronto about 80 km to the south, the site experiences many different types of aerosol depending on the wind direc-tion.
The Southern Great Plains (SGP) central facility site of the US Department of Energy Atmospheric Radiation Mea-surement (ARM) program is located near Lamont, Oklahoma (36◦360N, 97◦290W, 300 m a.s.l.; Parworth et al., 2015). It is representative of the Great Plains region, and the surrounding areas have various anthropogenic activities including agricul-ture, animal husbandry, and oil and gas extraction.
Botsalano (BOT) is located in South Africa, 200 km west-northwest of Johannesburg in a game reserve in a savannah environment (25◦320S, 27◦750E, 1400 m a.s.l.; Laakso et al., 2008; Vakkari et al., 2011). Although there are no local an-thropogenic sources, Botsalano is impacted by aged emis-sions from industrialized Highveld and is thus considered a semi-clean location.
Welgegund (WGD) is located in central South Africa within the grassland biome on a private farm, with no local sources (26◦340S, 26◦560E, 1480 m a.s.l.; Tiitta et al., 2014;
Jaars et al., 2016). The site is impacted by the emissions from various strongly anthropogenically impacted source regions (e.g., the Bushveld Complex 100 km to the north and north-east, the Johannesburg–Pretoria megacity and surrounding industries 100 km to the north and east, and the Highveld and Vaal Triangle areas 100 km to the east and southeast). It also has a wide clean sector to the west. Welgegund is
representa-tive of the mosaic of grassland, cropland, and anthropogenic activities in the interior of southern Africa.
2.1.5 Urban and anthropogenically influenced sites Marikana (MAR) is located in the middle of a platinum group of metal refineries near the city of Rustenburg, South Africa (25◦420S, 27◦290E, 1170 m a.s.l.; Venter et al., 2012, 2016). In addition to the industrial SO2emissions, the site is
heav-ily impacted by domestic heating and cooking emissions in nearby low-income residential areas.
The Helsinki measurement site (HEL) is the SMEAR III station in the University of Helsinki campus area (60◦120N, 24◦580E, 26 m a.s.l.; Hussein et al., 2008). The site is located next to a busy road on a hill elevated by 20 m from the sur-rounding area.
The Beijing site (BEI) is located on a rooftop in the cam-pus area of Peking University in the northwestern part of Bei-jing (40◦000N, 116◦190E, 50 m a.s.l.; Wu et al., 2007), as the Peking University Urban Atmosphere Environment Monitor-ing Station (PKUERS). A major road is located 500 m from the site, but there are no significant stationary air pollution sources nearby.
The Nanjing SORPES station (NAN) is located about 20 km northeast of downtown Nanjing, China (32◦70N, 118◦570E, 25 m a.s.l.; Qi et al., 2015; Ding et al., 2016). With only few local sources within its 2–3 km surroundings and generally upwind of the city, it can be considered to be a re-gional background site in the urbanized Yangtze River Delta region of eastern China.
The measurements in Budapest (BUD) were conducted at two nearby sites: at the Budapest Platform for Aerosol Re-search and Training in the city center on the bank of the Danube (47◦290N, 19◦40E, 115 m a.s.l.; Salma et al., 2016b) and at the Konkoly Observatory in a background area near the city (47◦300N, 18◦580E, 478 m a.s.l). The first of the sites is representative of well-mixed urban air, and the second site is located in a wooded area (Németh and Salma, 2014).
The São Paulo measurement site (SPL) is located in the campus area of the University of São Paulo 10 km from the city center (23◦340S, 46◦440W, 750 m a.s.l.; Backman et al., 2012). The São Paulo metropolitan area is the world’s sev-enth largest city, and the measurement site is representative of the anthropogenic pollution of the city area with no strong local sources in the vicinity of the site.
2.2 Data analysis methods
All data sets were analyzed with the procedure following the particle number size distribution data analysis guidelines pre-sented by Kulmala et al. (2012). This was carried out in or-der to obtain a data set as coherent as possible. We classified every measurement day at each measurement site into one of the following three categories: NPF event day, non-event day, or undefined day (those days that could not be
unam-biguously classified into NPF or non-NPF days). We used the criteria originally introduced by Dal Maso et al. (2005), in which the class I event days are those during which the for-mation and subsequent growth of the nucleation-mode parti-cles is clearly distinguishable in the number size-distribution data for at least a few hours (Fig. 2). Class II event days are those during which there are evident inhomogeneities in the sampled air masses, causing fluctuations in aerosol processes and in the observed particle size distributions, but the regional NPF is still clearly observable. For a more de-tailed discussion of the analysis procedure, see Kulmala et al. (2012).
In order to quantify the intensity of individual NPF events, we calculated the formation rate Jnuc of nucleation-mode
particles (10–25 nm in diameter) based on the following bal-ance equation (Kulmala et al., 2012):
Jnuc= dNnuc dt +CoagS · Nnuc+ GR 1dp, nuc ·Nnuc. (1)
Here Nnuc is the total number concentration of 10–25 nm
nucleation-mode particles, CoagS is the coagulation sink for the nucleation-mode particles (calculated using the particle diameter of 15 nm as the geometric mean of the 10–25 nm size range) due to the preexisting larger particles, GR is the observed GR of particles through the 10–25 nm size range, and 1dp,nuc is the width of the 10–25 nm size range. The
GR was calculated by first fitting lognormal modes to the measured particle number size-distribution data using an au-tomated algorithm developed by Hussein et al. (2008), and then following the time evolution of the geometric mean of the nucleation mode. A linear function was fitted to the data points of the nucleation-mode size as a function of time, and the slope of the fitted line gave the GR. The coagulation sinks were calculated based on the dry size distribution. The relative-humidity-dependent hygroscopic growth of the par-ticles was not taken into account in our analyses since this might differ among sites according to the particles’ chemical composition and there are only a few parameterizations for the hygroscopic growth available in the literature (Kulmala et al., 2012).
3 Results and discussion
Below we discuss three quantities that characterize atmo-spheric NPF events: the observed frequency of regional NPF events at individual measurement sites, the average forma-tion rate of 10–25 nm particles (Jnuc) during each event, and
the corresponding GR of 10–25 nm particles. We will in-vestigate both the overall behavior of these three quantities and their seasonal variability. Rather than looking at individ-ual measurement sites, we will concentrate our analysis on five groups of the sites that represent different environmen-tal regimes: polar areas, high-altitude locations, remote ar-eas, rural arar-eas, and urban areas. The individual values of the
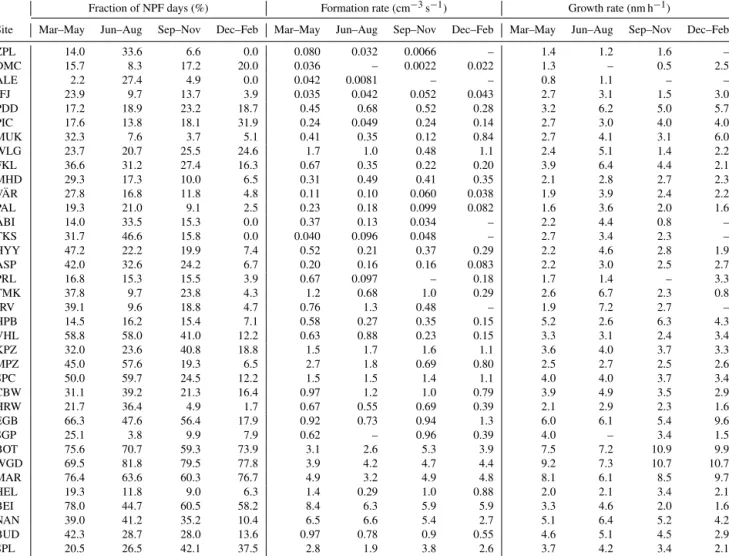
seasonal site-specific medians of the NPF event frequencies and nucleation-mode particle formation and GRs are given in Table 2. Note that the NPF frequency is the fraction of all class I and II NPF days from all the days with aerosol size-distribution data, but the particle formation and GRs are calculated only for the class I NPF events.
3.1 General characteristics of regional NPF and its seasonal cycle
Regional NPF events were observed at all the 36 sites throughout the year (Fig. 3), with events being most frequent at the three sites in southern Africa (MAR, WGD, BOT) and least frequent at the two sites at high northern latitudes (ZPL, ALE). It should be noted that although at all the sites we selected NPF events that exhibited formation and continu-ous growth of nucleation-mode particles during several hours (i.e., fulfilling our criteria of regional NPF), the local condi-tions of each individual measurement site do influence the apparent NPF characteristics. For example, at high-altitude mountainous sites the orographic lifting of air parcels dur-ing the day can affect the conditions favorable to NPF. Such NPF events might show a temporal evolution of the particle number size distribution that is different from NPF events at locations with more homogeneous topography (Venzac et al., 2009; Tröstl et al., 2016). Thus, when comparing the results presented in this study to global modeling results, for exam-ple, the regional representativeness should be kept in mind.
The overall frequency of NPF did not show any consistent differences, or patterns, among the high-altitude, remote, ru-ral, and urban sites. There were, however, large site-to-site differences in this frequency. Seasonally, the NPF frequency was typically the highest during March–May, the median value being equal to 31 % among the seasonal-median val-ues at each site. Since many of the Northern Hemisphere sites had very low NPF event frequencies during the local winter, the median value of this frequency was the lowest (8 %) dur-ing the December–February period. The vast majority of the sites (30 out of 36) clearly showed more NPF events during the local spring and summer compared with the local win-ter, as has also been reported in many previous studies in the literature (see, e.g., Kulmala et al., 2012, and references therein).
The observed formation rates of 10–25 nm particles in-creased, on average, with an increasing degree of anthro-pogenic influence, being 1 to 2 orders of magnitude higher in urban areas compared with most of the sites in remote and polar environments (Fig. 4) This indicates the impor-tance of anthropogenic vapors (such as sulfur dioxide, am-monia, amines) to NPF. Interestingly, the three high-altitude sites (JFJ, PDD, PIC) showed seasonal-median values of Jnuc
that were comparable to those at remote lower-altitude ar-eas. There are a few studies in which NPF has been stud-ied in detail over different parts of the atmospheric column, and several mechanisms favoring or inhibiting NPF at
differ-Table 2. Site-specific seasonal-median values of NPF event frequencies (fraction of class I and II NPF days from all the days with measure-ment data) and nucleation-mode particle formation and growth rates. A value is not given (indicated by –) if there were fewer than three quantifiable NPF events in any given season.
Fraction of NPF days (%) Formation rate (cm−3s−1) Growth rate (nm h−1)
Site Mar–May Jun–Aug Sep–Nov Dec–Feb Mar–May Jun–Aug Sep–Nov Dec–Feb Mar–May Jun–Aug Sep–Nov Dec–Feb ZPL 14.0 33.6 6.6 0.0 0.080 0.032 0.0066 – 1.4 1.2 1.6 – DMC 15.7 8.3 17.2 20.0 0.036 – 0.0022 0.022 1.3 – 0.5 2.5 ALE 2.2 27.4 4.9 0.0 0.042 0.0081 – – 0.8 1.1 – – JFJ 23.9 9.7 13.7 3.9 0.035 0.042 0.052 0.043 2.7 3.1 1.5 3.0 PDD 17.2 18.9 23.2 18.7 0.45 0.68 0.52 0.28 3.2 6.2 5.0 5.7 PIC 17.6 13.8 18.1 31.9 0.24 0.049 0.24 0.14 2.7 3.0 4.0 4.0 MUK 32.3 7.6 3.7 5.1 0.41 0.35 0.12 0.84 2.7 4.1 3.1 6.0 WLG 23.7 20.7 25.5 24.6 1.7 1.0 0.48 1.1 2.4 5.1 1.4 2.2 FKL 36.6 31.2 27.4 16.3 0.67 0.35 0.22 0.20 3.9 6.4 4.4 2.1 MHD 29.3 17.3 10.0 6.5 0.31 0.49 0.41 0.35 2.1 2.8 2.7 2.3 VÄR 27.8 16.8 11.8 4.8 0.11 0.10 0.060 0.038 1.9 3.9 2.4 2.2 PAL 19.3 21.0 9.1 2.5 0.23 0.18 0.099 0.082 1.6 3.6 2.0 1.6 ABI 14.0 33.5 15.3 0.0 0.37 0.13 0.034 – 2.2 4.4 0.8 – TKS 31.7 46.6 15.8 0.0 0.040 0.096 0.048 – 2.7 3.4 2.3 – HYY 47.2 22.2 19.9 7.4 0.52 0.21 0.37 0.29 2.2 4.6 2.8 1.9 ASP 42.0 32.6 24.2 6.7 0.20 0.16 0.16 0.083 2.2 3.0 2.5 2.7 PRL 16.8 15.3 15.5 3.9 0.67 0.097 – 0.18 1.7 1.4 – 3.3 TMK 37.8 9.7 23.8 4.3 1.2 0.68 1.0 0.29 2.6 6.7 2.3 0.8 JRV 39.1 9.6 18.8 4.7 0.76 1.3 0.48 – 1.9 7.2 2.7 – HPB 14.5 16.2 15.4 7.1 0.58 0.27 0.35 0.15 5.2 2.6 6.3 4.3 VHL 58.8 58.0 41.0 12.2 0.63 0.88 0.23 0.15 3.3 3.1 2.4 3.4 KPZ 32.0 23.6 40.8 18.8 1.5 1.7 1.6 1.1 3.6 4.0 3.7 3.3 MPZ 45.0 57.6 19.3 6.5 2.7 1.8 0.69 0.80 2.5 2.7 2.5 2.6 SPC 50.0 59.7 24.5 12.2 1.5 1.5 1.4 1.1 4.0 4.0 3.7 3.4 CBW 31.1 39.2 21.3 16.4 0.97 1.2 1.0 0.79 3.9 4.9 3.5 2.9 HRW 21.7 36.4 4.9 1.7 0.67 0.55 0.69 0.39 2.1 2.9 2.3 1.6 EGB 66.3 47.6 56.4 17.9 0.92 0.73 0.94 1.3 6.0 6.1 5.4 9.6 SGP 25.1 3.8 9.9 7.9 0.62 – 0.96 0.39 4.0 – 3.4 1.5 BOT 75.6 70.7 59.3 73.9 3.1 2.6 5.3 3.9 7.5 7.2 10.9 9.9 WGD 69.5 81.8 79.5 77.8 3.9 4.2 4.7 4.4 9.2 7.3 10.7 10.7 MAR 76.4 63.6 60.3 76.7 4.9 3.2 4.9 4.8 8.1 6.1 8.5 9.7 HEL 19.3 11.8 9.0 6.3 1.4 0.29 1.0 0.88 2.0 2.1 3.4 2.1 BEI 78.0 44.7 60.5 58.2 8.4 6.3 5.9 5.9 3.3 4.6 2.0 1.6 NAN 39.0 41.2 35.2 10.4 6.5 6.6 5.4 2.7 5.1 6.4 5.2 4.2 BUD 42.3 28.7 28.0 13.6 0.97 0.78 0.9 0.55 4.6 5.1 4.5 2.9 SPL 20.5 26.5 42.1 37.5 2.8 1.9 3.8 2.6 3.7 4.2 3.4 2.1
ent altitudes have been discussed without a clear consensus (Crumeyrolle et al., 2010; Boulon et al., 2011; Rose et al., 2015). The seasonal variability in the particle formation rate was quite modest at most of the sites, and especially so when comparing it with the site-to-site differences in this quantity. The median value of Jnucamong the site-specific median
val-ues was between 0.4 and 0.6 cm−3s−1 in all seasons. The seasonal variation of Jnucfollowed that of the NPF event
quency, except for December–February when NPF event fre-quency was lowest but Jnuc values were similar to those in
June–August.
The observed GRs of 10–25 nm particles were the lowest at the two northern high-latitude sites (ZPL, ALE; Fig. 5). Somewhat higher values of GR than the ones observed for the northern sites, and with relatively minor site-to-site differ-ences, were generally observed at remote and high-altitude sites. An exception to this pattern was PDD, which had clearly higher values of GR than any other high-altitude site
and most of the remote sites. This has been observed to be caused by orographic vertical transport of particles nu-cleated in the boundary layer (Boulon et al., 2011). The particle GRs tended to be the highest in rural and urban areas, even though large site-to-site differences were ev-ident. The observed season-median values of GR varied from slightly below 1 nm h−1 (DMC, spring) up to about 10 nm h−1at several sites (e.g., EGB, BOT, WGD). Two ru-ral stations, Botsalano (BOT) and Welgegund (WGD), and the urban station Marikana (MAR) located in South Africa showed similar seasonal variability in median GR, proba-bly due to emissions of gaseous pollutants from various an-thropogenically impacted source regions nearby. For most of the sites (33 out of 36), the season-median values of GR were the highest during the local summer and the lowest dur-ing the local winter. As a result, the overall median parti-cle GR was parti-clearly higher during the June–August period (4.0 nm h−1) compared with the December–February period
2 3 4 5 6 7 8 Annual-median GRnuc (nm h-1) (a) (b) Mar–May median = 2.7 nm h-1 ZPLALEDMCJFJPDDPICMUKFKLMHDVÄRPALABITKSWLGHYYASPPRLTMKHPBVHLKPZMPZSPCHRWEGBBOTSGPWGDJRVCBWHELBEINANBUDMARSPL 0 2 4 6 8 10 GR nuc (nm h -1) (c) Jun–Aug median = 4.0 nm h-1 ZPLALEDMCJFJPDDPICMUKFKLMHDVÄRPALABITKSWLGHYYASPPRLTMKHPBVHLKPZMPZSPCHRWEGBBOTSGPWGDJRVCBWHELBEINANBUDMARSPL 0 2 4 6 8 10 GR nuc (nm h -1) (d) Sep–Nov median = 3.0 nm h-1 ZPLALEDMCJFJPDDPICMUKFKLMHDVÄRPALABITKSWLGHYYASPPRLTMKHPBVHLKPZMPZSPCHRWEGBBOTSGPWGDJRVCBWHELBEINANBUDMARSPL 0 2 4 6 8 10 GR nuc (nm h -1) (e) Dec–Feb median = 2.9 nm h-1 ZPLALEDMCJFJPDDPICMUKFKLMHDVÄRPALABITKSWLGHYYASPPRLTMKHPBVHLKPZMPZSPCHRWEGBBOTSGPWGDJRVCBWHELBEINANBUDMARSPL 0 2 4 6 8 10 GR nuc (nm h -1)
Figure 5. Annual-median (a) and seasonal-median (b–e) particle growth rates at the different measurement sites. The dashed lines in panels (b–e) show the median seasonal values, and the color scheme represents the classification of the sites into polar, high-altitude, remote, rural, and urban environments.
(2.9 nm h−1). Exceptions are the three South African stations (BOT, WGD, MAR), which showed considerably higher me-dian GR through the year (from September to May), except for the period June–August, when the median GR values were comparable with other stations and closer to the overall median GR. Also, the Egbert site (EGB) in Canada showed high median GR values (about 10 nm h−1) during the
pe-riod December–February, possibly due to increased anthro-pogenic impact during wintertime.
When looking at the seasonal variability in the three quan-tities discussed above, the observed behavior of the particle GR is the easiest one to explain. Earlier studies based on measurements in rural or remote locations have typically ob-served the highest values of GR during the summer and as-cribed this feature to the higher emissions of biogenic aerosol
precursor compounds at higher ambient temperatures during the summer compared with other seasons (Dal Maso et al., 2007; Nieminen et al., 2014; Pryor et al., 2010; Liao et al., 2014; Asmi et al., 2016). The situation is more complicated in environments affected strongly by anthropogenic activi-ties, e.g., in practically all urban areas, where a large fraction of the compounds contributing to GR may originate from an-thropogenic precursors (e.g., Vakkari et al., 2015). Emissions of anthropogenic aerosol precursor compounds may peak during any time of year, depending on human habits and re-quirements influenced by weather and climate (e.g., heat and energy production), yet their atmospheric oxidation to con-densable vapors is expected to be strongest during summer in most of the environments. It is likely that the strong at-mospheric photochemistry, coupled with high biogenic emis-sions of aerosol precursor vapors, largely explains the almost universal summer maximum in GR at the sites considered here. Recently, Dall’Osto et al. (2018) analyzed the chemical composition of 30–60 nm particles during NPF events at 24 sites across Europe and showed that the growth of the parti-cles was dominated by secondary organic aerosol formation. The NPF frequency had a clear summer-to-winter contrast similar to GR but, contrary to GR, it peaked in March–May rather than in June–August at many of the sites. A regional modeling study (Pietikäinen et al., 2014) indicated that the monthly average boundary layer burden of freshly nucleated 3 nm particles (a quantity that depends on both the NPF event frequency and particle formation rates) peaks in May–July in Europe. We find that the seasonal cycle of the particle formation rate Jnuc was rather weak for most of the sites,
yet it appeared to follow the seasonal cycle of the NPF fre-quency slightly better than that of GR. Several factors might contribute to these differences. The most apparent of them are that, compared with GR, the occurrence and strength of atmospheric NPF are expected to be more sensitive to the gas-phase sulfuric acid concentration and preexisting aerosol loading and less sensitive to low-volatility oxidation prod-uct concentrations of biogenic vapors (e.g., Westervelt et al., 2014; Dunne et al., 2016). Furthermore, the value of Jnuc is
affected not only by the strength of NPF but also by the GR of particles starting from the nanometer size as well as the preexisting aerosol load affecting the coagulation sink (e.g., Lehtinen et al., 2007). This is because during the growth of the initial nucleated particles these particles are continuously scavenged by coagulation with the preexisting aerosol. 3.2 Relationships between the relevant quantities and
implications
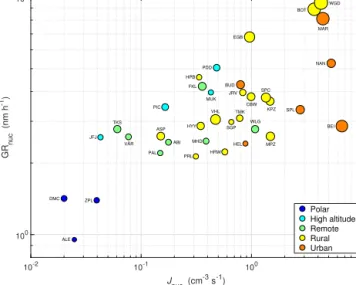
The annual-median particle formation rate and GR were pos-itively correlated with each other when considering all the 36 measurement sites together (Pearson correlation coefficient for the logarithmic values is r = 0.72, p < 0.01), as well as for the subsets of high-altitude and rural sites (Fig. 6). The other environments did not show such a relation since in
10-2 10-1 100 101 Jnuc (cm-3 s-1) 100 101 GR nuc (nm h -1) ZPL ALE DMC JFJ PDD PIC MUK FKL MHD VÄR PAL ABI TKS WLG HYY ASP PRL TMK HPB VHL KPZ MPZ SPC HRW EGB BOT SGP WGD JRV CBW HEL BEI NAN BUD MAR SPL Polar High altitude Remote Rural Urban
Figure 6. Annual-median, site-specific particle formation rate as a function of the corresponding growth rate. The marker size is pro-portional to the annual-median NPF frequency and the marker col-ors show the environment types of the sites.
these environments either the site-specific particle GRs (at rural sites) or formation rates (at polar, high-altitude, and ur-ban sites) had weak variability and were concentrated in a relatively narrow range of annual-median values. The pos-itive relation between Jnuc and GR was identifiable among
the rural sites in all the seasons (results not shown here) and even among the remote sites during the spring and autumn.
On an annual basis, the particle formation and GRs had a tendency to increase with increasing NPF event frequency among the different measurement sites (Fig. 6). A positive, yet moderate, correlation between Jnuc and NPF event
fre-quency was also observed when analyzing different seasons individually (results not shown here), as well as within the ru-ral and remote subsets of the sites. The relation between GR and NPF event frequency was rather weak and remained so during the different seasons (results not shown here). None of the environments alone showed any sign of a relation be-tween GR and NPF event frequency on an annual basis, but during summer a positive relationship was identifiable for the rural subset of the sites.
Intuitively, one would expect a certain degree of corre-lation among Jnuc, GR, and NPF event frequency because
higher values of all these quantities are favored by higher gas-phase production rates of low-volatility vapors and by lower preexisting aerosol loadings (e.g., Kulmala and Kermi-nen, 2008; Westervelt et al., 2014). However, there are many other factors and processes that may cause a scatter in these relations. These factors and processes include the environ-mental and seasonal variability in
i. the dominant NPF mechanism (Kulmala et al., 2014; Dunne et al., 2016);
ii. the availability of agents (ions, ammonia, amines, etc.) that are needed to stabilize molecular clusters contain-ing sulfuric acid (Kirkby et al., 2011; Almeida et al., 2013; Schobesberger et al., 2015);
iii. the mixture of compounds responsible for the main growth of newly formed particles (see Vakkari et al., 2015, and references therein); and
iv. meteorological conditions, which can indirectly influ-ence the various processes and factors mentioned in (i), (ii), and (iii).
In our data set there was a considerable amount of scatter in each of the relationships among Jnuc, GR, and NPF event
frequency, which suggests that the values of these three quan-tities are affected by multiple factors with different degrees of importance among the individual locations.
In spite of the above discrepancies, the analysis of ob-served values of Jnuc, GR, and NPF event frequency allowed
us to make certain general statements on the importance of regional NPF. We need to keep in mind that regional NPF events considered in this study typically last at least for a few hours and, as discussed earlier, that particles in the size range 10–25 nm in diameter are not very susceptible to coag-ulation and other loss processes. First, increases in the num-ber concentration of particles larger than 10 nm due to a sin-gle NPF event are expected to be in the range from a few hundred to a few thousand particles per cubic centimeter per event at remote locations and in the range from a few thou-sand up to more than 105particles per cubic centimeter per event in rural and urban locations. If these numbers are bined with the observed NPF event frequencies, and com-pared with total particle number concentrations measured in different types of environments (see, e.g., Asmi et al., 2013), it becomes clear that regional NPF is capable of explaining a dominant fraction of the total particle number concentration in both remote and polluted continental locations. This dom-inance may persist throughout the year in some of the loca-tions, while being restricted to one to three seasons in some other locations. In different urban environments, there has been shown to be considerable variation in the contribution of NPF to the total particle number (Reche et al., 2011; Bed-dows et al., 2015). Second, depending on the location and season, we may estimate that it typically takes from a few hours to a couple of days for the newly formed particles to reach sizes larger than 50–100 nm in diameter, at which size they may act as cloud condensation nuclei (CCN) (see, e.g., Kerminen et al., 2012). Our data suggest that in remote and rural locations, atmospheric CCN production associated with NPF tends to be most effective during summer and least ef-fective during winter. Urban locations do not show any con-sistent seasonal pattern in this respect. Third, although re-gional NPF and the subsequent particle growth appear to be rather weak in polar areas during most of the year, the over-all importance of atmospheric NPF for aerosol
concentra-tions in polar areas is difficult to estimate based on our data. This is partly due to the limited number of continuous mea-surements available from polar sites and partly because of the challenges in capturing atmospheric NPF that either have very low particle formation and growth rates or have overall characteristics that considerably differ from those in lower-latitude continental locations. Furthermore, polar and remote locations typically have lower concentrations of CCN-sized particles than anthropogenically influenced urban areas; thus the climatic importance of NPF cannot be evaluated based only on NPF frequency and particle formation and growth rates. In a recent modeling study, NPF influenced by ammo-nia emissions from a seabird colony was shown to signifi-cantly contribute to cooling in the Arctic area (Croft et al., 2016).
4 Summary and conclusions
By collecting a database on continuous particle number size distribution measurements at 36 continental sites worldwide, we investigated the overall and seasonal behavior of re-gional new particle formation in five different environmental regimes ranging from polar areas and remote sites to heavily polluted megacities.
We found regional NPF events to take place at all the measurement sites throughout the year, with the exception of December–February at the sites at high latitudes (ZPL, ALE, ABI, and TKS). NPF was most common (site median of seasonal-median NPF frequencies of about 30 %) during the Northern Hemisphere spring and least common (less than 10 %) during winter. No clear spatial pattern in the frequency of NPF according to environment type was observed, except that NPF events seemed to be most rare in polar areas dur-ing most seasons. We found that the formation rates of 10– 25 nm particles (Jnuc) during the NPF events have a tendency
to increase with an increasing degree of anthropogenic influ-ence, being 1 to 2 orders of magnitude higher in urban areas compared with most of the remote and polar sites. The sea-sonal variability in Jnucwas quite modest at most of the sites.
We did not find any systematic environmental pattern for the growth rate (GR) of 10–25 nm particles during the NPF events, except that the GR was overall lowest in the polar re-gions. For the vast majority of the sites, the seasonal-median values of GR were the highest during the local summer and the lowest during the local winter. The observed values of Jnuc, GR, and NPF indicate that regional NPF can explain a
dominant fraction of the total particle number concentration and give an important contribution to the CCN population, at both remote and heavily polluted continental locations.
We found that the connection among Jnuc, GR, and NPF
event frequency was at best moderate among the different measurement sites, as well as among the sites belonging to a certain environmental regime. The apparent lack of a strong relation among these three quantities is understandable due
to the environmental and seasonal variability in the domi-nant NPF mechanisms, in the abundances of compounds con-tributing to the initial steps of NPF and subsequent particle growth, and in the prevailing meteorological conditions. For future studies, it would be very valuable to make detailed in-vestigations on the interdependencies among Jnuc, GR, and
NPF event frequency, at both single measurement sites and among sites of seemingly similar environmental characteris-tics.
The data derived here will be helpful in evaluating, and possibly also in constraining, regional and large-scale atmo-spheric models that simulate aerosol formation and dynam-ics. However, it is also clear that more data similar to those presented in this study will be needed to better understand atmospheric NPF and its regional importance. Of specific importance in this respect are different urban areas practi-cally all over the world, additional remote and rural locations in North America, Asia, and most of the Southern Hemi-sphere, and locations in polar areas. Furthermore, expanding the continental observations presented in this study to at least a few locations over the oceans covering 71 % of the Earth’s surface is needed for a comprehensive understanding of the global aerosol system and its effects on the global climate. For purely modeling purposes, or for the complementary use of models and in situ field and satellite measurements, it is probably sufficient to have particle number size distribution data down to a few nanometers (maximum 10 nm) in particle diameter. For a better understanding of NPF in different envi-ronments and comparison to corresponding laboratory data, such data should preferably be extended down to 1.5–3 nm in particle diameter and ideally be complemented by measure-ments of the chemical composition of the growing clusters.
Data availability. The data sets analyzed in this study (NPF event
frequencies and formation and growth rates) are available from the corresponding author upon request ([email protected]).
Author contributions. MK, TN, VMK, and TP designed the study,
and TN performed the data analysis. TN, MK, VMK, and TP inter-preted the results and wrote the manuscript. All the other co-authors provided measurement data and contributed to writing and com-menting on the paper.
Competing interests. The authors declare that they have no conflict
of interest.
Acknowledgements. This work was supported by the Academy of
Finland Centres of Excellence program (project numbers 272041, 1118615, 307331), ACTRIS-2 under the European Union research infrastructure action in the frame of the H2020 program for “In-tegrating and opening existing national and regional research in-frastructures of European interest” (grant agreement 654109),
EU-SAAR (R113-CT-2006-026140), and EUCAARI (0136 833-2). MeteoSwiss is acknowledged for their long-term financial support since 1995 within the Swiss component of the Global Atmosphere Watch program of the World Meteorological Organization to the op-erations at the Jungfraujoch site. The research at the Zeppelin, Pico Espejo, and Aspvreten stations has been carried out with the help of funding from the Swedish Research Council (Vetenskaprådet), Swedish Environmental Protection Agency (Naturvårdsverket), and Swedish International Development Cooperation Agency (SIDA). The measurements at the Vavihill station are part of the Swedish MERGE strategic research area. Continuous aerosol measurements at the Melpitz site were supported by the German Federal Min-istry for the Environment (BMU) grants F&E 370343200 (“Er-fassung der Zahl feiner und ultrafeiner Partikel in der Außen-luft”) and F&E 371143232 (“Trendanalysen gesundheitsgefährden-der Fein- und Ultrafeinstaubfraktionen unter Nutzung gesundheitsgefährden-der im Ger-man Ultrafine Aerosol Network (GUAN) ermittelten Immissions-daten durch Fortführung und Interpretation der Messreihen”). For the Tiksi and Pallas sites, we acknowledge the funding from the Academy of Finland projects “Greenhouse gas, aerosol and albedo variations in the changing Arctic”(project number 269095) and “Novel Assessment of Black Carbon in the Eurasian Arctic: From Historical Concentrations and Sources to Future Climate Impacts” (NABCEA, project number 296302), and the funding from the Eu-ropean Union’s Horizon 2020 programs under grant agreement no. 727890 (INTAROS). Environment and Climate Change Canada is acknowledged for operating the Alert and Egbert sites. For the Bu-dapest site, the financial support by the National Research, Devel-opment and Innovation Office, Hungary (contracts K116788 and PD124283), is acknowledged. The measurements at the Botsalano, Welgegund, and Marikana sites received funding from Academy of Finland projects “Air pollution in Southern Africa” (project num-ber 117505) and “Atmospheric monitoring capacity building in Southern Africa” (project number 132640), from North-West Uni-versity, and from the Vilho, Yrjö and Kalle Väisälä Foundation. Measurements at Tomsk were carried out under support of the De-partment of Earth Sciences RAS. Measurements at Mukteshwar were performed with financial support by the Ministry of Foreign Affairs of Finland, Academy of Finland (264242, 268004, 284536), TEKES Finland, and DBT India (2634/31/2015). The Harwell mea-surement station was supported by the UK Department for Environ-ment, Food and Rural Affairs. Institutional research funding IUT20-11 and IUT20-52 of the Estonian Ministry of Education and Re-search is acknowledged for the Järvselja site.
We acknowledge the following researchers for providing data from several stations: Nicolas Bukowiecki, Ernest Weingartner, and Martine Collaud Coen (Jungfraujoch site); Thomas Tuch and Wolfram Birmili (Melpitz); Moa Sporre (Vavihill and Aspvreten), David Picard, Paolo Villani, Hervé Venzac, and Paolo Laj (Puy de Dome); Giorgos Kouvarakis and Nikos Kalivitis (Finokalia); Dan Veber (Alert); and Sander Mirme (Järvselja).
Edited by: Fangqun Yu
References
Almeida, J., Schobesberger, S., Kürten, A., Ortega, I. K., Kupiainen-Määttä, O., Praplan, A., Adamov, A., Amorim, A., Bianchi, F., Breitenlechner, M., David, A., Dommen, J., Don-ahue, N. M., Downard, A., Dunne, E., Duplissy, J., Ehrhart, S., Flagan, R. C., Franchin, A., Guida, R., Hakala, J., Hansel, A., Heinritzi, M., Henschel, H., Jokinen, T., Junninen, H., Kajos, M., Kangasluoma, J., Keskinen, H., Kupc, A., Kurtén, T., Kvashin, A. N., Laaksonen, A., Lehtipalo, K., Leiminger, M., Leppä, J., Loukonen, V., Makhmutov, V., Mathot, S., McGrath, M. J., Nieminen, T., Olenius, T., Onnela, A., Petäjä, T., Riccobono, F., Riipinen, I., Rissanen, M., Rondo, L., Ruuskanen, T., Santos, F. D., Sarnela, N., Schallhart, S., Schnitzhofer, R., Seinfeld, J. H., Simon, M., Sipilä, M., Stozhkov, Y., Stratmann, F., Tomé, A., Tröstl, J., Tsagkogeorgas, G., Vaattovaara, P., Viisanen, Y., Vir-tanen, A., Vrtala, A., Wagner, P. E., Weingartner, E., Wex, H., Williamson, C., Wimmer, D., Ye, P., Yli-Juuti, T., Carslaw, K. S., Kulmala, M., Curtius, J., Baltensperger, U., Worsnop, D. R., Vehkamäki, H., and Kirkby, J.: Molecular understanding of sul-phuric acid–amine particle nucleation in the atmosphere, Nature, 502, 359–363, 2013.
Apte, J. S., Marshall, J. D., Cohen, A. J., and Brauer, M.:
Address-ing global mortality from ambient PM2.5, Environ. Sci. Technol.,
49, 8057–8066, 2015.
Asmi, A., Collaud Coen, M., Ogren, J. A., Andrews, E., Sheridan, P., Jefferson, A., Weingartner, E., Baltensperger, U., Bukowiecki, N., Lihavainen, H., Kivekäs, N., Asmi, E., Aalto, P. P., Kulmala, M., Wiedensohler, A., Birmili, W., Hamed, A., O’Dowd, C., Jen-nings, S. G., Weller, R., Flentje, H., Fjaeraa, A. M., Fiebig, M., Myhre, C. L., Hallar, A. G., Swietlicki, E., Kristensson, A., and Laj, P.: Aerosol decadal trends – Part 2: In-situ aerosol particle number concentrations at GAW and ACTRIS stations, Atmos. Chem. Phys., 13, 895–916, https://doi.org/10.5194/acp-13-895-2013, 2013.
Asmi, E., Kivekäs, N., Kerminen, V.-M., Komppula, M., Hyvärinen, A.-P., Hatakka, J., Viisanen, Y., and Lihavainen, H.: Secondary new particle formation in Northern Finland Pallas site between the years 2000 and 2010, Atmos. Chem. Phys., 11, 12959–12972, https://doi.org/10.5194/acp-11-12959-2011, 2011.
Asmi, E., Kondratyev, V., Brus, D., Laurila, T., Lihavainen, H., Backman, J., Vakkari, V., Aurela, M., Hatakka, J., Viisanen, Y., Uttal, T., Ivakhov, V., and Makshtas, A.: Aerosol size distribution seasonal characteristics measured in Tiksi, Russian Arctic, At-mos. Chem. Phys., 16, 1271–1287, https://doi.org/10.5194/acp-16-1271-2016, 2016.
Backman, J., Rizzo, L. V., Hakala, J., Nieminen, T., Manni-nen, H. E., Morais, F., Aalto, P. P., Siivola, E., Carbone, S., Hillamo, R., Artaxo, P., Virkkula, A., Petäjä, T., and Kul-mala, M.: On the diurnal cycle of urban aerosols, black carbon and the occurrence of new particle formation events in spring-time São Paulo, Brazil, Atmos. Chem. Phys., 12, 11733–11751, https://doi.org/10.5194/acp-12-11733-2012, 2012.
Beddows, D. C. S., Harrison, R. M., Green, D. C., and Fuller, G. W.: Receptor modelling of both particle composition and size distri-bution from a background site in London, UK, Atmos. Chem. Phys., 15, 10107–10125, https://doi.org/10.5194/acp-15-10107-2015, 2015.
Berland, K., Rose, C., Pey, J., Culot, A., Freney, E., Kalivitis, N., Kouvarakis, G., Cerro, J. C., Mallet, M., Sartelet, K., Beckmann,
M., Bourriane, T., Roberts, G., Marchand, N., Mihalopoulos, N., and Sellegri, K.: Spatial extent of new particle formation events over the Mediterranean Basin from multiple ground-based and airborne measurements, Atmos. Chem. Phys., 17, 9567–9583, https://doi.org/10.5194/acp-17-9567-2017, 2017.
Bianchi, F., Tröstl, J., Junninen, H., Frege, C., Henne, S., Hoyle, C. R., Molteni, U., Herrmann, E., Adamov, A., Bukowiecki, N., Chen, X., Duplissy, J., Gysel, M., Hutterli, M., Kangasluoma, J., Kontkanen, J., Kürten, A., Manninen, H. E., Münch, S., Peräkylä, O., Petäjä, T., Rondo, L., Williamson, C., Weingartner, E., Cur-tius, J., Worsnop, D. R., Kulmala, M., Dommen, J., and Bal-tensperger, U.: New particle formation in the free troposphere: A question of chemistry and timing, Science, 352, 1109–1112, https://doi.org/10.1126/science.aad5456, 2016.
Birmili, W., Berresheim, H., Plass-Dülmer, C., Elste, T., Gilge, S., Wiedensohler, A., and Uhrner, U.: The Hohenpeissenberg aerosol formation experiment (HAFEX): a long-term study
including size-resolved aerosol, H2SO4, OH, and
monoter-penes measurements, Atmos. Chem. Phys., 3, 361–376, https://doi.org/10.5194/acp-3-361-2003, 2003.
Boulon, J., Sellegri, K., Venzac, H., Picard, D., Weingartner, E., Wehrle, G., Collaud Coen, M., Bütikofer, R., Flückiger, E., Baltensperger, U., and Laj, P.: New particle formation and ultrafine charged aerosol climatology at a high altitude site in the Alps (Jungfraujoch, 3580 m a.s.l., Switzerland), Atmos. Chem. Phys., 10, 9333–9349, https://doi.org/10.5194/acp-10-9333-2010, 2010.
Boulon, J., Sellegri, K., Hervo, M., Picard, D., Pichon, J.-M., Fréville, P., and Laj, P.: Investigation of nucleation events ver-tical extent: a long term study at two different altitude sites, At-mos. Chem. Phys., 11, 5625–5639, https://doi.org/10.5194/acp-11-5625-2011, 2011.
Brauer, M., Freedman, G., Frostad, J., van Donkelaar, A., Martin, R. V., Dentener, F., Dingenen, R. van, Estep, K., Amini, H., Apte, J. S., Balakrishnan, K., Barregard, L., Broday, D., Feigin, V., Ghosh, S., Hopke, P. K., Knibbs, L. D., Kokubo, Y., Liu, Y., Ma, S., Morawska, L., Sangrador, J. L. T., Shaddick, G., An-derson, H. R., Vos, T., Forouzanfar, M. H., Burnett, R. T., and Cohen, A.: Ambient Air Pollution Exposure Estimation for the Global Burden of Disease 2013, Environ. Sci. Technol., 50, 79– 88, https://doi.org/10.1021/acs.est.5b03709, 2016.
Bukowiecki, N., Weingartner, E., Gysel, M., Coen, M. C., Zieger, P., Herrmann, E., Steinbacher, M., Gäggeler, H. W., and Bal-tensperger, U.: A review of more than 20 years of aerosol obser-vation at the high altitude research station Jungfraujoch, Switzer-land (3580 m asl), Aerosol Air Qual. Res., 16, 764–788, 2016. Carpenter, L. J., Archer, S. D., and Beale, R.: Ocean-atmosphere
trace gas exchange. Chem. Soc. Rev. 41,6473–6506, 2012. Charron, A., Birmili, W., and Harrison, R. M.: Factors
in-fluencing new particle formation at the rural site, Har-well, United Kingdom, J. Geophys. Res., 112, D14210, https://doi.org/10.1029/2007JD008425, 2007.
Croft, B., Wentworth, G. R., Martin, R. V., Leaitch, W. R., Mur-phy, J. G., MurMur-phy, B. N., Kodros, J. K., Abbatt, J. P., and Pierce, J. R.: Contribution of Arctic seabird-colony ammonia to atmo-spheric particles and cloud-albedo radiative effect, Nat. Com-mun., 7, 13444, https://doi.org/10.1038/ncomms13444, 2016. Crumeyrolle, S., Manninen, H. E., Sellegri, K., Roberts, G.,