HAL Id: hal-00994197
https://hal-paris1.archives-ouvertes.fr/hal-00994197
Submitted on 21 May 2014
HAL is a multi-disciplinary open access
archive for the deposit and dissemination of
sci-entific research documents, whether they are
pub-lished or not. The documents may come from
teaching and research institutions in France or
abroad, or from public or private research centers.
L’archive ouverte pluridisciplinaire HAL, est
destinée au dépôt et à la diffusion de documents
scientifiques de niveau recherche, publiés ou non,
émanant des établissements d’enseignement et de
recherche français ou étrangers, des laboratoires
publics ou privés.
Unsupervised discovery of intentional process models
from event logs
Ghazaleh Khodabandelou, Charlotte Hug, Rebecca Deneckere, Camille
Salinesi
To cite this version:
Ghazaleh Khodabandelou, Charlotte Hug, Rebecca Deneckere, Camille Salinesi. Unsupervised
dis-covery of intentional process models from event logs. 11th Working Conference on Mining Software
Repositories, May 2014, Hyderabad, India. pp.282-291, �10.1145/2597073.2597101�. �hal-00994197�
Unsupervised Discovery of Intentional Process Models
from Event Logs
Ghazaleh Khodabandelou, Charlotte Hug, Rébecca Deneckère, Camille Salinesi
Sorbonne University, Centre de Recherche en InformatiqueParis, 75013, France
[email protected],
charlotte.hug, rebecca.deneckere, [email protected]
ABSTRACT
Research on guidance and method engineering has high-lighted that many method engineering issues, such as lack of flexibility or adaptation, are solved more effectively when in-tentions are explicitly specified. However, software engineer-ing process models are most often described in terms of se-quences of activities. This paper presents a novel approach, so-called Map Miner Method (MMM), designed to automate the construction of intentional process models from process logs. To do so, MMM uses Hidden Markov Models to model users’ activities logs in terms of users’ strategies. MMM also infers users’ intentions and constructs fine-grained and coarse-grained intentional process models with respect to the Map metamodel syntax (i.e., metamodel that specifies intentions and strategies of process actors). These models are obtained by optimizing a new precision-fitness metric. The result is a software engineering method process speci-fication aligned with state of the art of method engineering approaches. As a case study, the MMM is used to mine the intentional process associated to the Eclipse platform usage. Observations show that the obtained intentional pro-cess model offers a new understanding of software propro-cesses, and could readily be used for recommender systems.
Keywords
Software Development Process, Intentional Process Model-ing, Event logs Mining
1.
INTRODUCTION
Fueled by the growing presence of events logs in soft-ware and softsoft-ware engineering platforms, process mining has emerged a few years ago as a key approach to design soft-ware processes [29, 32, 33]. Mining softsoft-ware engineering pro-cesses from logs can be useful for understanding how people really work, analyzing how actual software engineering pro-cesses differ from the prescribed ones, and thereby improve software engineering methods and products. Whereas most
Permission to make digital or hard copies of all or part of this work for personal or classroom use is granted without fee provided that copies are not made or distributed for profit or commercial advantage and that copies bear this notice and the full citation on the first page. To copy otherwise, to republish, to post on servers or to redistribute to lists, requires prior specific permission and/or a fee.
Copyright 20XX ACM X-XXXXX-XX-X/XX/XX ...$15.00.
process mining approaches specify behaviors in terms of se-quences of tasks and branching, we believe that the funda-mental nature of processes is mostly intentional. Intention-oriented software process specification has been promoted since long ago. In the 80s, intentional models were proposed in the IS community as a potential theoretical foundation to determine users’ behavior [9] or in a former work to model humans behavioral intention, particularly for computer us-age behavior [1]. Later on, in the early 90s, intention analy-sis and modeling have been promoted as a driving paradigm to study strategic alignment, to define actors and roles [35], to guide requirements elicitation [26], to handle traceabil-ity [16], to study users behavior to identify and name use cases, etc. Representing processes by intentions and strate-gies has proved a powerful tool to better understand the deep nature of processes, to see how processes interweave and combine, to abstract processes and visualize them un-der man-manageable form, even when they are extremely complex [28].
This paper presents a method, so-called Map Miner Method (MMM) that aims at discovering users’ intentions and strategies to construct intentional process models from event logs. MMM generates intentional models specified with the Map notation [27, 28]. This notation is chosen rather than other intentional process models such as KAOS or I* [35, 8] because (a) it has already proved effective for specifying software engineering processes [26], (b) it sup-ports process variability and multi-process specification [27], and (c) its way of combining intentions and strategies at mul-tiple levels of abstraction scales well to large and complex processes [28]. In MMM framework, an intention is defined as a goal, an objective or a motivation to achieve a goal with a clear-cut criteria of satisfaction, which can be fulfilled by the enactment of a process [30]. The intentions are explic-itly represented and are of high-level of abstraction (e.g., organizational goals).
In software engineering context, MMM can be useful at different stages of the process model life-cycle, for instance: (i) at the requirements level, to understand users intentions from software usage activity logs; (ii) at the project man-agement level, to check alignment between prescribed pro-cess models and what stakeholders actually do; or (iii) at the application level, to monitor users and provide run-time recommendations.
The contribution made in this paper is triple: (i) First, modeling the users’ activities logs in terms of strategies (using Hidden Markov Models (HMMs) [25]); unsupervised learning is used to estimate the parameters of HMM, (ii)
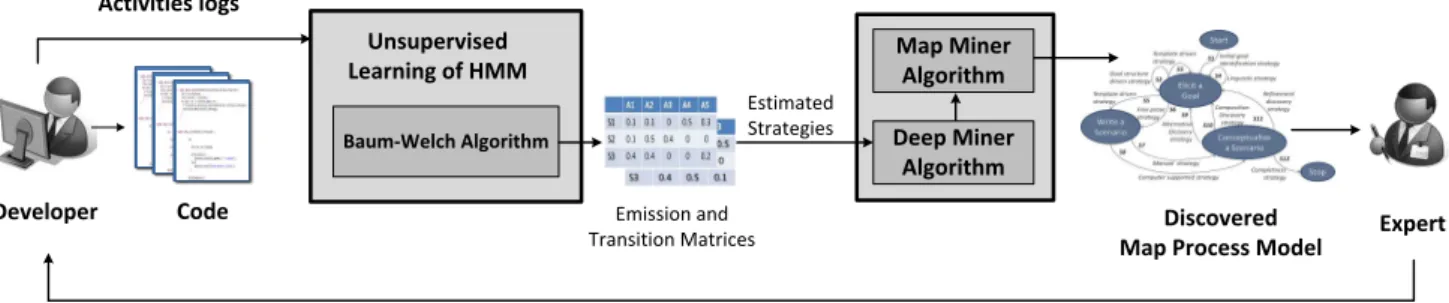
Code Baum-Welch Algorithm Unsupervised Learning of HMM Developer Activities logs Emission and
Transition Matrices Expert
Discovered Map Process Model
Check Model Conformity/Recommendations/ Process Improvement Map Miner Algorithm Deep Miner Algorithm Estimated Strategies
Figure 1: An overview of the Map Miner Method
Second, using estimated strategies and Map formalism, we develop Deep Miner and Map Miner algorithms to generate respectively, fine-grained and coarse-grained Map process model, (iii) Finally, the entire proposed approach is applied on two practical datasets; first in a laboratory context, sec-ond in a large-scale case study by mining the Eclipse UDC (Usage Data Collector) developers’ logs [10]. The resulting Maps provided a precious understanding of the processes followed by the students and the developers, and some feed-back on the effectiveness and scalability of MMM.
The remainder of this paper is organized as follows. Sec-tion 2 introduces MMM, which consists in modeling users’ activities in terms of strategies (using HMMs). This sec-tion also describes Deep Miner and Map Miner algorithms. Section 3 describes the application of MMM on a dataset re-sulting from the event logs of Entity/Relationship diagrams creation. Section 4 represents the large-scale case study with event logs from Eclipse UDC to find out how developers use the Eclipse technology. Related works are discussed in sec-tion 5 and threats to validity in secsec-tion 6. Finally, secsec-tion 7 concludes this work and presents its perspectives.
2.
MAP MINER METHOD
The key idea of MMM is modeling the users’ behaviors in terms of their underlying intentions and strategies, from event logs. The strategies are the alternative ways to fulfill the intentions. MMM uses the Map metamodel to model ac-tual process followed by users. According to the Map meta model, intentions express what users intend to perform during the enactment of a process [27]. In other words, the enactment of a process is the execution of a sequence of ac-tivities that are caused by users’ intention. According to the fuzzy mechanism of a cognitive process, several inten-tions cause the performance of several activities at the same time. However, the intentions are not directly related to the activities; the intentions can be fulfilled by combining different activities, which are different ways of achieving an intention, i.e., strategies. Indeed, in the Map metamodel, strategies are used to move from one intention to another and are made of one or several activities. This relationship between the intentions, the strategies and the activities, rep-resents the top-down structure of reasoning and acting in cognitive processes of human brain. Nevertheless, only the low-level part of this structure, i.e., users’ activities, is ob-servable. The middle and high-level part (strategies and intentions) are abstract notions and therefore unobservable
directly. MMM proposes to trace back this structure to achieve the sources, which are users’ intentions. It is im-portant to define some notions used in this paper. The no-tion of intenno-tion is defined in the introducno-tion. However, there are also sub-intentions, which are the low-level inten-tions. They are the finest intentional objects of the Map metamodel. Each sub-intention is associated to a parent in-tention, and one intention is fulfilled if at least one of its children sub-intention is fulfilled. The sub-intentions allow obtaining the fine-grained Map and the intentions allow ob-taining the coarse-grained Map.
MMM uses the observable users’ activities traces (a set of event logs), generated while interacting with Information Systems. MMM consists of three phases: (i) First phase: estimating the users’ strategies from observed activities us-ing HMMs. The topology of HMM permits modelus-ing ob-served process (users’ activities) in terms of hidden states (underlying users’ strategies), (ii) Second phase: generat-ing fine-grained Map process model usgenerat-ing estimated strate-gies along with Map formalism (Deep Miner algorithm), (iii) Final phase: generating coarse-grained Map process model from fine-grained one (Map Miner algorithm). Constructing the Map process model thereby allows rebuilding the actual process model, i.e., the model followed by users. Figure 1 depicts an overview of MMM.
Before addressing the problem of discovering a Map, the associated framework is briefly explained in the following section.
2.1
Map Metamodel
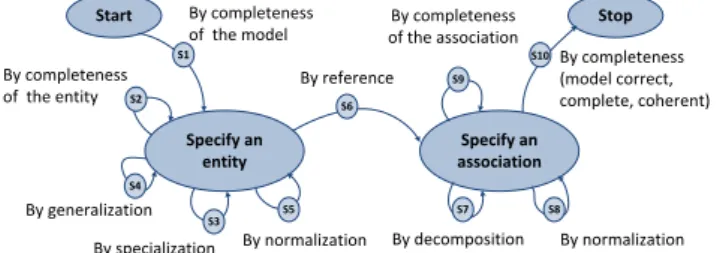
Map is an intentional process metamodel. Map process model (an instance of Map metamodel) allows representing process models in terms of users’ intentions and strategies. Figure 2 illustrates a Map process model where the nodes represent the intentions and the edges represent the strate-gies. A set of <Source Intention, Strategy, Target
Inten-tion> represents a section in the Map. Map allows
repre-senting flexible process models, enacted in a dynamic way since the sections of a Map can be executed non-sequentially and as long as intentions are not completely fulfilled. For example, on figure 2, one way to fulfill the intention
Spec-ify an entity is to select the strategy S4: By generalization
which is composed of two activities: create an entity and create generalization link (see Table 1). Thus, confronted to a specific situation and a particular intention, the Map reveals the alternative strategies to fulfill the intention. The
corresponding section of this example is <Specify an entity,
By generalization, Specify an entity>.
Specify an entity Specify an association Start Stop S1 S2 S3 S4 S5 S6 S7 S8 S9 S10 By completeness of the model By completeness of the entity By generalization By specialization By normalization By reference By completeness of the association By completeness (model correct, complete, coherent) By normalization By decomposition
Figure 2: Map process model for the construction of E/R diagrams.
2.2
Estimating Strategies from Activities
HMMs allow modeling the structure of complex tempo-ral dependencies between two complementary Markov pro-cesses: hidden and observed processes, given that the ob-served process is generated depending on the state of the hidden process. Generally, the states of hidden process are not visible but the probability of a given state can be inferred by computing the Maximum Likelihood of the observed pro-cess. The two complementary processes are defined next.
2.2.1
Hidden Process: Users’ Strategies
Let s“ ps1, . . . , sLq P SLbe a temporal sequence of users’
strategies of length L. The topology M1is chosen for hidden
process, which means that the strategy sl at step l only
depends on the strategy at step ℓ´ 1. This choice is justified by the fact that strategies are performed in a logical order by users. A homogeneous Markov chain, which parameters are denoted by T and π, models the hidden process (strategies) with:
Tpu, vq “ Pr psℓ“ v|sℓ´1“ uq @u, v P S, ℓ P r2, Ls,
πpuq “ Pr ps1“ uq @u P S.
(1) The vector π contains the probabilities of strategy at the initial state and the matrix T contains the transition proba-bilities for the following strategies, i.e., the transition prob-abilities from any strategy at step ℓ´1 to any other strategy at step ℓ (including itself).
2.2.2
Observed Process: Users’ Activities
Let a “ pa1, . . . , aLq P AL be a temporal sequence of
users’ activities of length L. We choose the model M0 for
observed process, meaning that the emission of aℓ, at a given
step ℓ, does not depend on any previous observation. It only depends on the hidden strategy at the same time step. The
emission probability of an observation a P A for a given
strategy uP S is given by:
Epa, uq “ Pr pa|uq . (2)
The matrix E contains the emission probabilities of any activity for any strategy. Assuming that S, A and π are known, the HMM model parameters is fully described by
H “ tE, Tu, which represents the core information about
the HMM behavior. The MMM highly relies on the emis-sion matrix E and the transition matrix T to respectively characterize the users’ strategies and the structure of the Map. For these reasons, it is extremely important that these
two matrices precisely match the process under study. To do so, the coefficients of the two matrices are learned based on logs produced by the enactment of the process. This pa-per focuses on unsupa-pervised learning to estimate E and T since it has been proven to be efficient and offers a higher performance than supervised learning of HMM [25]. Un-supervised learning estimates these parameters based only on traces of activities (without prior knowledge about the strategies set S). The Baum-Welch Algorithm (BWA) [4] is most commonly used to learn the parameters of a HMM. The BWA estimates the HMM parameters that locally maximize the probability of having these sequences generated by the HMM. More precisely, the BWA maximizes the likelihood of H: H˚“ arg max H N ź n“1 Prpan|Hq , (3)
where N is number of observed sequences in a dataset
con-taining activities a1, . . . ,aN.
It is important to highlight the BWA requires the
cardi-nals of N “ |S| and M “ |A| to run. Regarding the set of
activities A can simply be obtained by identifying the differ-ent activities in the dataset. However, the information about number of strategies does not exist in the dataset. There-fore, a heuristic method is used in this paper, which consists in generating several HMMs models with different numbers of strategies and observing the associated emission matrices E. It occurs that as the number of possible strategies in-creases, the number of different strategies obtained in the emission matrices reaches a threshold. It means that when the number of possible strategies is too high, the BWA pro-duces an emission matrix with several identical strategies. Consequently, this observed threshold sets the right number of strategies.
2.3
Deep Miner Algorithm
Once model parameters T and E are estimated by the BWA, the problem is how to extract a Map process model which fits actual process model. As a first step into this direction, we propose a metric which has the interesting property of taking into account both fitness and precision to optimize the Map process model, whereas classical met-rics in process modeling address either fitness or precision (see [29] for an overview of the existing metrics).
2.3.1
Extracting a Fine-grained Map
We recall that the matrices generated by the BWA are an emission matrix E, giving the probabilities of generating any activity while performing a strategy and a transition matrix T, giving the probabilities of transition between any couple
of strategiesps, s1q P S2
.
Clearly, there is a strong link between the transition ma-trix and the topology of the Map process model we want to extract. To extract a Map from a transition matrix, the two following constraints must be verified: (i) any transition between possible strategies in the transition matrix should be possible on the Map; (ii) any transition between possible strategies in the Map should be possible in the transition matrix.
The first constraint can be seen as a criterion for fitness since it ensures that all the transitions learned from the dataset are present in the Map. The second constraint cor-responds to a criterion of precision since it aims at avoiding
introducing extra-transitions in the Map that are not learned from the dataset. Our goal is to find the Map that best sat-isfies both of them. In the next part, we define a metric which is a trade-off between fitness and precision and also captures the relative importance of transitions.
2.3.2
Proposed Metric of Fitness and Precision
The topology of a Map m can be defined by the set of its sections, each comprising a source sub-intention, a strategy and a target sub-intention. We formally write
m“ pmkqkPt1,...,Ku, (4)
where k denotes the index of a section and K is the total
number of sections of the Map. For each k P t1, . . . , Ku,
mk“ pi, s, jq P IˆSˆI. The component mkp1q is the source
sub-intention of section k, mkp2q is the strategy of section
k, and mkp3q is the target sub-intention. On the Map m,
a transition from strategy s to strategy s1is possible if and
only if there existpk, k1q P t1, . . . , Ku2
such that mkp2q “ s,
mk1p2q “ s1, and mkp3q “ mk1p1q. In the following, we use
the symbol α to denote if a transition is possible or not in the Map: αs,s1 “ $ & % 1 ifDpk, k1q P t1, . . . , Ku2 such that mkp2q “ s mk1p2q “ s1, and mkp3q “ mk1p1q, 0 otherwise. (5) In the transition matrix T, we only consider as valid tran-sitions with a probability above a given threshold ε. The value of ε has to be chosen heuristically, to counter the ef-fects of noise and artifacts in the dataset. We define:
ωs,s1“
"
1 if Tps, s1q ě ε,
0 if Tps, s1q ă ε. (6)
Classically, the criteria of fitness and precision between T and m can be expressed by the expressions known as recall and precision. In our context, we define these two expressions as RecpT, mq “ ř s,s1ωs,s1αs,s1 ř s,s1ωs,s1 , (7) PrepT, mq “ ř s,s1ωs,s1αs,s1 ř s,s1αs,s1 . (8)
The numerator of both expressions is the number of signifi-cant transitions in T that are present on the map m, while the denominators are the number of significant transitions in T and the number of transitions on m, respectively.
Since our goal is to find a map that fits best the transition matrix with respect to both recall and precision, we can use the classical F-measure which expression is:
F1pT, mq “ 2
PrepT, mqRecpT, mq
PrepT, mq ` RecpT, mq. (9)
2.3.3
Optimization Problem
Now that the proper metric has been defined, we need to find the Map that maximizes it. The solution of this problem belongs to the set
M“ arg max
m
F1pT, mq. (10)
Since we want to obtain a Map with the simplest structure, we choose the solution with the lowest number of sections.
In other words, the solution is
m˚“ argmPMmin|m|, (11)
where|m| stands for the number of sections in m. However,
finding m˚ is a difficult task since m generally belongs to
a high-dimension space. Indeed, it can be shown that there
are 2|S|2 possible Maps for|S| different strategies.
Conse-quently, computing all the possible Maps with a brute force method then comparing their F-measures is not an option. Instead, we developed an algorithm that solves (11) with a
complexity bounded by |S| ˚ p|S| ´ 1q. This algorithm is
detailed below.
Data: strategy set S, transition matrix T, threshold ε
Result: map m˚
for each strategy sP S do
associate to s a target sub-intention is;
end
for each strategy sP S do
for each strategy s1P S, s1‰ s do
if Tps, s1q ě ε then
create a section from is to is1 with strategy
s1;
end end end
Algorithm 1: How to obtain a Map from S, T, and ε. The first part of algorithm 1 associates a target sub-intention to each strategy of S. In the second part, if a
transition probability from strategy s to strategy s1is above
the threshold ε, a section is added to the Map from the
tar-get sub-intention of s to the tartar-get sub-intention of s1. This
section ensures that the transition given by T is also present in the Map. With this algorithm, recall and precision, de-fined in (7) and (8), have the advantage of being equal to 1. Indeed, ε defines the accuracy level of the Map. When ε is close to 0, almost all the transitions from the unsupervised model are present in the obtained Map. Consequently, the likelihood of the obtained Map is high but the Map is hardly understandable by humans since it has too many sections. However when ε increases, the number of sections, as well as the likelihood of the obtained Map, decrease. The Map gets more easily understandable by humans but it is not as accurate in terms of transition.
2.4
Map Miner Algorithm
Deep Miner algorithm generates the low-level intentions or
sub-intentions shown byta, b, c, ¨ ¨ ¨ u (figure 3). To extract high-level intentions from low-level intentions, Map Miner algorithm has been developed to automatically perform this task. To do so, Map Miner algorithm uses a clustering al-gorithm, K-means [14] to group the sub-intentions into the intentions. Indeed, this multi-level topology is due to the deep architecture of the brain. The extensive studies on the visual cortex show cognitive processes have a deep structure and humans organize their ideas and concepts hierarchically. First, they learn simpler concepts and then compose them to represent more abstract ones [5]. Note that the num-ber of intentions is a parameter that has to be chosen. The choice of these parameters allows researchers to obtain Maps with different level of precision. Due to lack of space, this algorithm will be detailed in a future work.
3.
A PROOF OF CONCEPT
To evaluate MMM, we conducted a tailored experiment with the Master students in computer science of Sorbonne University. According to the experiment, 66 students cre-ated Entity/Relationship (E/R) diagrams using the pre-scribed Map process model (figure 2). Indeed, for this par-ticular experiment, the students were asked to follow the prescribed Map while creating their E/R diagrams. Our goal is to compare the actual Map process model discovered by MMM to the prescribed Map. Regarding this prescribed Map, students can select ten strategies to fulfill four inten-tions, i.e., Start, Specify an entity, Specify an associ-ation and Stop. From Start, it is possible to progress in the process by selecting strategies leading to intentions but once the intention of Stop is achieved, the enactment of the process finishes. Table 1 represents the activities and re-lated strategies that the students perform to fulfill the four intentions. The event logs comprising students’ activities are recorded by a web-based tool. Once the event logs were available, MMM has been applied on them to trace back this procedure and rebuild the Map process model that was actu-ally followed. Finactu-ally, the conformity between the prescribed Map and the discovered Map is checked (see section 3.1). This knowledge can be useful to (i) improve the software used by the students to make the prescribed model easier to follow, (ii) modify the prescribed model by accounting to the process the students actually followed.
Table 1: Strategies and related activities
Labels Name of strategies Related activities (activities labels) S1 By completeness (model) Create entity (a1) S2 By completeness (entity)
Link attribute to entity (a2)
S3 By
normaliza-tion
Delete Link attribute to entity (a6),
Delete entity (a5), Define primary
key (a7)
S4 By
generaliza-tion
Create entity (a1), Create
generaliza-tion link (a3)
S5 By
specializa-tion
Create entity (a1), Create
specializa-tion link (a4)
S6 By reference {Delete link attribute to entity,
Cre-ate entity, CreCre-ate association, Link association to entity} (a8), {Create
association, Link association to en-tity} (a9)
S7 By
decomposi-tion
{Create association, Link association to entity} (a9)
S8 By
normaliza-tion
{Delete association, Delete Link attribute to association}(a10)
S9 By completeness
(assoc.)
Link attribute to association (a11)
S10 By completeness
(final)
Check the model (a12)
3.1
Applying MMM on Dataset
Once the students’ traces are recorded, MMM is applied to obtain the fine-grained and coarse-grained Map process models. As a first step, the number of strategies must be fixed by the heuristic method described in section 2.2. As a result, we obtain 10 as number of strategies. Then BWA estimates the parameters of the transition matrix and the algorithm described in 2.3.3 is then applied to obtain the
structure of a fine-grained Map, i.e., what is the source sub-intention and the target sub-intention of each strategy (the sections). As described earlier, the value of ε has to be set to obtain a trade-off between the accuracy of the Map and its understanding. Figure 3 depicts the fine-grained
Map (small nodes) for ε “ 0.07 and coarse-grained Map
(large nodes) obtained by Deep miner and Map Miner algorithms, respectively. What we learn from the obtained Map is:
‚ Deep Miner algorithm found 9 sub-intentions as well as intentions Start and Stop. Map Miner algorithm groups the sub-intentions into the high-level intentions to obtain coarse-grained Map. The high-level intention are shown by
I21 and I31 (large circle on figure 3). The discovered strategies
for each high-level intention allow identifying the intentions
I21 to Specify an entity and I31to Specify an association.
‚ There is a number of matches between the new groups of strategies in the obtained Map and the groups of strategies
in the prescribed Map. For instance, S1 and S11, S2 and
S11, S10 and S101 are made of similar activities. The few
mismatches between prescribed and obtained strategies indicate that some prescribed strategies were not followed as intended by the students. This shows how the students preferred to behave. For instance, in the prescribed Map,
activity a2 is only present in strategy S2 for intention
I2 whereas in the obtained Map, it is present in many
strategies: S11, S61, S71, and S91 for intentions I21, and I31. The
same phenomenon is true for activity a1. It means that
these particular activities are used by students during the entire process and not only for a single intention.
It is important to highlight that the likelihood (3) of the
HMM model is´2.36e3
(logarithmic scale), which is higher
than the likelihood of the obtained Map (´2.54e3
). This is normal since the Map formalism restricts some transitions (e.g., from the Stop to the Start) that are generated by the HMM model. Start Stop a i g d h c b f e S’1 S’1 S’1 S’1 S’2 S’3 S’2 S’4 S’4 S’4 S’5 S’6 S’6 S’7 S’7 S’7 S’8 S’8 S’8 S’9 S’9 S’10 S’10 S’10
Specify an Entity (I’2) Specify an Association (I’3) Sub-intentions
Figure 3: Map obtained by MMM for E/R diagrams experiment.
4.
CASE STUDY: ECLIPSE UDC
The goal of this case study is to reconstruct the Map process model of developers who committed their code to
Eclipse UDC server hosted by Eclipse Foundation [10]. The Eclipse Foundation provides UDC dataset to help commit-ters and organizations to better understand how the commu-nity makes use of Eclipse platform [11]. In this perspective, our contribution is to model the UDC developers’ behav-iors in terms of intentions and strategies while using Eclipse platform. The obtained Map can help to better understand developers’ behaviors.
The dataset contains 1, 048, 576 event logs from developers who agreed to send their data back to the Eclipse Founda-tion. These data aggregate activities from over 10, 000 Java developers between September 2009 and January 2010. The activities are recorded by timestamps for each developer, which allows knowing when and by whom activities were committed.
4.1
Applying MMM on Dataset
In order to apply MMM, it is important to prepare the dataset. The number of unique developers’ activities per month exceeds 500 activities. This number contains both the recurring activities and the non-recurring activities, i.e., activities which are not frequently performed by developers. These activities are not representative of the developers’ be-havior characteristics because they have not been repeated enough to be a behavioral-pattern. For this reason, and also for readability, we limit this study to the 150 most fre-quent activities performed by developers. Table 2 contains the list of these activities. Some of these activities are the commands performed directly by developers; some of them are the frameworks, plug-ins or built-in features of Eclipse used by developers during their development process. For readability reasons, the prefix org.eclipse of the activities is removed. The plug-ins and frameworks are shown in bold letters and the related activities are inside brackets.
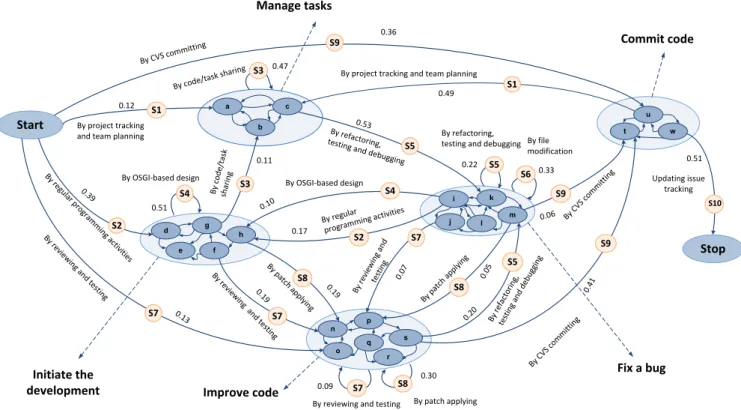
Once the dataset is ready, BWA estimates the transition matrix (developers’ strategies). Note that, once again the number of strategies obtained by the heuristic method for this case study is 10. The strategies are represented in ta-ble 2 with their corresponding groups of activities. Finally, the Map obtained by Deep Miner and Map Miner algorithms is shown on figure 5.
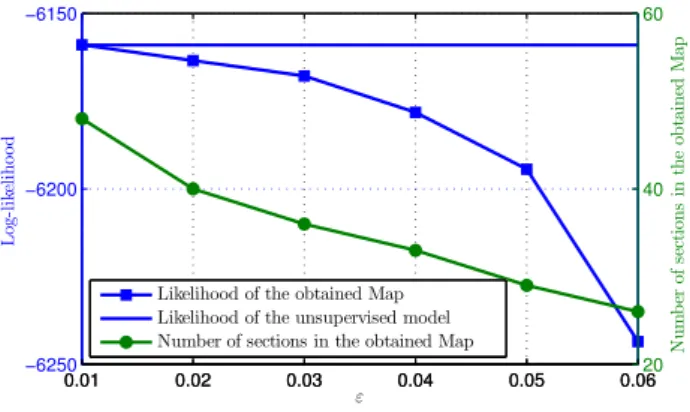
Figure 4 depicts the effect of the choice of ε on the likeli-hood and the number of sections of the obtained Map. As mentioned earlier, ε expresses the level of abstraction for a Map. An expert can choose the value of ε regarding the ex-pected level of abstraction. In this case study, the value of ε is set to 0.06 to have a good trade-off between having a like-lihood with a relative high value and a reasonable number of sections.
Regarding the obtained Map, 22 sub-intentions are grouped by Map Miner algorithm into 7 groups of high-level intentions. Note that MMM can discover accurately the be-ginning and the end of a process; thus the intentions Start and Stop are clearly determined on the obtained Map. The transition probabilities from one intention to a strategy are annotated on the arrows. These values correspond to the probabilities that the developers selected a strategy from a given intention. The values on the loops indicate the prob-abilities that the developers continued to perform the activ-ities related to the looped strategies.
4.1.1
Naming Strategies and Intentions
As found in E/R diagrams experiment and this case study,
0.01 0.02 0.03 0.04 0.05 0.06 −6250 −6200 −6150 L o g -l ik el ih o od ε 0.01 0.02 0.03 0.04 0.05 0.06 20 40 60 Nu m b er o f se ct io n s in th e o b ta in ed M a p
Likelihood of the obtained Map Likelihood of the unsupervised model Number of sections in the obtained Map
Figure 4: The effect of the choice of ε on the like-lihood and the number of sections of the obtained Map for the Eclipse traces.
MMM discovers the strategies (the arrows) and where they lead, i.e., intentions (the nodes). In other words, MMM re-constructs the topology of the Map process model from event logs; the names of strategies and intentions are not fully au-tomatically generated. Nevertheless, it is possible to infer the names of strategies and intentions from the emission ma-trix E. Indeed, E specifies the activities associated to each strategy discovered by the MMM (see table 2). Therefore, based on the names of activities grouped into a strategy and through a semantic analysis of their properties and interre-lationships, it is then possible to manually infer the names of the strategies. In the same way, since the strategies lead to intentions, the names of intentions can be inferred by analyz-ing the strategies leadanalyz-ing to each intention. For instance, the
main activities grouped into the strategy S5 are
’refactor-ing.commands’, ’jdt.junit’, ’debug.ui.commands’, etc. From these activities one can infer the developers wanted to debug, to refactor and to test a code; thus, the name inferred for this strategy is by refactoring, testing and debugging.
Fur-ther, the main activities for strategy S6 are ’delete’, ’paste’,
’copy’, ’undo’, etc. This means the developers wanted to modify a code or a file; the name inferred for this strategy is by file modification. Since both strategies lead to an
in-tention, we infer that the developers who performed S5 and
S6intended to Fix a bug. By applying this procedure, the
names of all strategies (denoted on the arrows) and inten-tions are semi-automatically inferred. The inferred names of intentions are Start, Initiate the development, Man-age tasks, Fix a bug, Improve the code, Commit the code. This naming protocol remains to be fully automated by building an sophisticated ontology.
4.2
Developers’ Behavior Analysis
Discovering the Map for Eclipse UDC developers allows understanding the developers’ behaviors during the devel-opment process. As shown on figure 5, they have selected different sequences of strategies with different probabilities,
to fulfill their intentions. An expert can analyze these
behaviors in order to understand how/why developers make use of different components or plug-ins of Eclipse: where they follow the best practice of software development projects and where they deviate from these rules, which components or plug-ins are more involved than the others,
0.39 0 .13
By reviewing and testing
By re view ing an d te sti ng By OSGI-based design By OSGI-based design By cod e/tas k shar ing By refac toring, testing and de bugging By r efac tori ng, testi ng an d d ebu ggin g By r evie win g an d test ing By p atch ap plyi ng By patc h ap plyin g By regular programm ing activiti es By regu lar p ro gram m ing ac tiviti es By patch applying By CV S co mm itting By C VS c omm itting By code/tas k sharing By file modification By refactoring,
testing and debugging S1 S3 S2 S3 S7 S7 S7 S8 S8 S8 S9 S9 S9 S5 S5 S5 S2 S4 S4 S6 By project tracking
and team planning
By re view in g an d te sti ng S7 Stop Updating issue tracking By CVS co mmitting Start
By project tracking and team planning 0.47 0.11 0.36 0.51 0.10 0.19 0.17 0.19 0. 07 0.05 0.09 0.30 0.41 0.20 0.53 0.22 0.33 0.49 0.06 0.51 S10 S1 0.12 Initiate the
development Improve code
Fix a bug Manage tasks Commit code a c b d h f g e i k l m j o s p n q r t w u
Figure 5: The obtained Map for Eclipse UDC.
Table 2: Strategies labels and related activities for Eclipse UDC
Strategies labels Activities names
S1 mylyn.tasks.ui.commands.[OpenTask, AddTaskRepository, ActivateTask, SearchForTask],
mylyn.context.ui.commands.[Open.context.dialog, AttachContext, interest.Increment, interest.Decrement], mylyn.monitor.ui, mylyn.team.ui
S2 core.[jobs, net, filesystem, resource, runtime, variables, contenttype, databinding.observable],
equinox.p2.ui.sdk.install
S3 mylyn.context.ui.commands.[Open.context.dialog, AttachContext, interest.Increment,
interest.Decrement],team.cvs.ui.[branch, replace, GenerateDiff, ShowHistory, Add, Tag,merg, compareWithTag], jsch.core, mylyn.[monitor.ui, team.ui, commons.ui, bugzilla.ui]
S4 pde.ui.EquinoxLaunchShortcut.run, equinox.p2.ui.sdk.update, equinox.[ds,
simplecon-figurator.manipulator, frameworkadmin, app, common, directorywatcher, engine, core, meta-data.repository, garbagecollector, ui.sdk.scheduler, repository, preferences, exemplarysetup, registry, updatechecker]
S5 core.[databinding.observable, core.net, core.filesystem, core.resource, core.runtime,
core.variables, core.contenttype], debug.ui.commands.[RunLast, Debuglast, eof, StepOver, TerminateAndRelaunch, execute, AddBreakPoint, TogglebreakPoint], jdt.debug.ui. [commands.Execute, commands.Inspect], jdt.junit.[junitShortcut.rerunLast, gotoTest, junitShortcut.debug], ltk.ui.refactoring.commands.[deleteResources, renameresources, moveResources], compare.selectPreviousChange
S6 ui.edit.[delete, paste, copy, undo, text.goto.lineEnd, text.contentAssist.proposals,
text.goto.wordNext], ui.file.save
S7 cdt.ui.editor, jdt.junit.[junitShortcut.rerunLast, gotoTest, junitShortcut.debug],
team.cvs.ui.[CompareWithRevision, CompareWithLatestRevisionCommand,
CompareWithWorkingCopyCommand],ui.edit.[delete, paste, copy undo, text.goto.lineEnd, text.contentAssist.proposals, text.goto.wordNext]
S8 team.ui.[synchronizeLast, teamSynchronizingPerspective, synchronizeAll, applyPatch],
ltk.core.refactoring.refactor.[create.refactoring.script, show.refactoring.history]
S9 mylyn.monitor.ui, mylyn.context.ui, mylyn.commons.ui, team.cvs.ui.[commitAll,
Commit, CompareWithRemote, Sync]
S10 mylyn.monitor.ui, mylyn.bugzilla.core, mylyn.bugzilla.ui, team.cvs.ui.[commitAll,
which strategies are more/less taken or where are system bottlenecks, etc. The obtained Map can also be used to provide recommendations to developers in order to choose the best path (strategies) to fulfill his/her intentions. In this case study, there is no prior model to compare with the obtained Map. However, MMM has proven to be effective with the controlled experiment (see 3) and the likelihood of the obtained Map is higher than the prescribed one. Hereafter, several observations, from the obtained Map, are detailed to attest the aforementioned claims in practice.
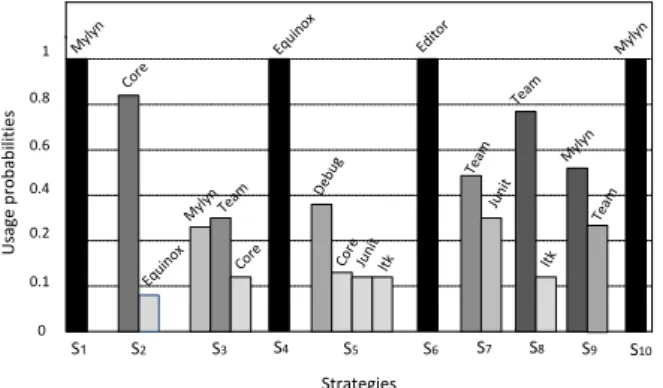
Observation 1. The developers’ activities involve
the usage of frameworks and plug-ins such as Mylyn, Equinox, team/CVS, Junit, built-in features of Eclipse such as Eclipse Core, Debug and API such as ltk (Lan-guage Toolkit). Figure 6 depicts the usage probabilities of these frameworks in each strategy. We can also observe the usage frequency of each framework/plugin/tools among the strategies. For instance, the usage frequency of Mylyn framework is 4 times among 10 strategies and its usage
probabilities for strategy S1 is 1 whereas for strategy S5 it
is 0. These values help detecting if any of these frameworks or tools is underused. For instance, we observe that the refactoring tool ltk is underused since it has a low usage probability (see also observation 4).
S1 S2 S3 S4 S5 S6 S7 S8 S9 S10 0 0.1 0.4 0.8 0.2 My lyn Team 1 0.6 Core Core My lyn Equi nox U sag e p ro b ab il iti e s Strategies Equi nox CoreJun it ltk Jun it Team Edito r Deb ug Myly n Team Myly n ltk Team
Figure 6: Usage probabilities of different Eclipse el-ements for each discovered strategy.
Observation 2. The developers who start a development
process choose one of the 4 first strategies, i.e., S1, S2, S7,
S9. If they already have an ongoing program at hand, they
tend to adopt either the strategy S7: by reviewing and
testing to Improve the code or the strategy S9: by CVS
committing to Commit the code. On the other side, the developers who start a new development choose either
the S2 strategy: by regular programming activities to
Initiate the development or choose the strategy S1: by
project tracking and team planning to Manage tasks with probability 0.39 and 0.12 respectively. This observation suggests that the developers of this case study tend to start programming by building first the baselines for software architecture through dividing the programs into different
modules/packages using OSGI-based design. After
decomposing the software into sub-modules, the developers
utilize the strategy S3 : by code/task sharing which
involves mainly Mylyn framework (described in scenario 3) which can be integrated with the Bugzilla bugtracker
system and issue system. Therefore, tasks and the content of these tasks can be shared among developers. The high transition probability of this strategy means the developers tend to share code/task in order to fulfill Manage tasks. Observation 3. The developers who have the intention
to Manage tasks choose the strategies S1and S3.
Regard-ing Table 2, the activities related to these strategies involve Mylyn framework which is the task and application lifecycle management (ALM) framework for Eclipse. It helps the developers to work efficiently with many different tasks such as bugs, problem reports or new features. It monitors users’ activities and preserve the context of the task-at-hand to focus the Eclipse UI on the related information. For instance, while working on a current task, if the developers have to work on another task, e.g., an occurred bug,
Mylyn preserves the context of the current task. Thus,
the developers can work on another task without losing the context of previous task. This procedure is discovered
in the obtained Map of Eclipse. The activities of the
developers while they Manage tasks are interrupted (e.g.,
for an urgent bug) and they choose the strategy S5 to Fix
a bug. To switch to the previous task, they first commit and report the bug then they continue managing tasks. We can deduce the Mylyn framework has reliable and relevant functionalities for developers and it is not underused since they work with it 47% (transition probability of 0.47) of their time and they use it frequently (Figure 6).
Observation 4. When the activities of the
develop-ers during Manage tasks are interrupted, they choose
strategy S5 to Fix a bug. The procedure of fixing a bug
may involve refactoring existing code, writing unit tests, editing and modifying involved code and finally fixing the
affected code. The strategy S5 : by refactoring, testing
and debugging represents this procedure. This strategy is defined as a best practice to fix a bug, which means the developers who adopt this strategy respect the guidelines of software development. However, they perform this strategy with probability 0.22 whereas they prefer to Fix a bug by file modification with a higher transition probability (0.33). Moreover, Figure 6 shows a low usage frequency and usage probability for ltk (Language Toolkit) which is an API for automated refactoring in Eclipse-based IDEs. This means the developer prefer refactoring manually instead of using the refactoring and debugging tools of Eclipse provided for this purpose. This confirms some results of empirical research [22, 31, 13, 34] that refactoring tools are seldom used and that they are not developers-friendly enough.
Observation 5. Bug fixing includes debugging and
refactoring of different software modules. Once developers
have fixed a set of bugs, they choose either strategy S8: by
patch applying with probability 0.05 or strategy S7: by
reviewing and testing with probability 0.07 to fulfill the intention of Improve the code. This observation means when debugging and refactoring have an impact on different parts of the program, the developers improve their code by patch applying. If debugging and refactoring change the program locally, they manually changes the code and send it for reviewing and testing. The probabilities describe that the developers tend to modify the codes manually.
Observation 6. The Map can be used as a behavioral pattern to build recommender system for assisting devel-opers in their daily development tasks. For example, this recommender system can suggest developers to avoid some problematic paths/strategies which might deviate from or-ganizational best practices and to take some more effective paths/strategies. For instance, since the procedure of refac-toring and debugging might affect the code in different parts of the program, it is recommended to check the coherence integrity of the program. To do so, after fixing a bug, the
developers can be recommended to take the strategy S4: by
OSGI-based design to Initiate the development, to check if the refactoring and debugging have been impacted the OSGI-based design (e.g., if the dependencies between the modules are changed, etc).
4.3
Process Improvement
The obtained Map also helps improving the software us-ability in different areas [3]. The Map can help the novice or unfamiliar users learning system features by making the task of learning easier, by using the Map obtained from previ-ous development process as a guideline. For instance, when their intentions are known, they can be recommended which strategies and activities might be useful to fulfill their inten-tions. Since the intentional topology of a Map makes it user-friendly, it can help software designer designing systems that enable users to be more efficient in their operations. This can be done by adapting the system to the users’ needs or by assisting users step by step while the enactment of a pro-cess. Using a Map increases also the users’ confidence and satisfaction in the enactment of a process. All these points contribute to improving the usability of the software prod-ucts.
5.
RELATED WORK
The workflow models approaches propose to discover pro-cess models from event logs generated during propro-cess en-actment. However, they model users’ behaviors in terms of activities [32, 33, 7, 21] and overlook the underlying users’ intentions and strategies. Intention Mining is a new field of research that does not exceed a few works [23, 2]. These works differ from our approach because they look for a sin-gle user’s intention underlying a sinsin-gle event log while our approach proposes to infer common users’ intentions during enactment of a process to achieve the ultimate process goal. HMMs are commonly applied in many fields such as speech recognition [17] and bioinformatics [12]. HMMs are used for model discovery by Cook et al. [7, 15]. This work concludes that the Ktail and Markov methods are more promising than RNet method to be used in practical applications. However, these works do not address the intentional dimension of pro-cesses that cause the activities performance. Application of HMMs in Intention Mining has been proposed and applied for the first time in our previous works [18, 19, 20].
Finite State Machine (FSM) is used in some works to model users’ behaviors [6, 21]. While our approach models hidden states as users’ strategies, FSM is a simple automa-ton and is not appropriate to model cognitive processes.
Several experimental works address the developers’ be-havior in the software engineering field [22, 31, 21]. In [22], improvements for the user interface of automated refactoring are proposed by instructing several participants to apply the
Extract Method refactoring on several open source projects. In [31], the focus is on Eclipse UDC refactoring histories to understand why developers underuse automated refactoring. However, these approaches are based on statistical reports and do not consider underlying users’ intentions during the development.
6.
THREATS TO VALIDITY
There are four main issues that threat the validity of the proposed approach. First, the mined Map may suffer from underfitting problems if the number of activities sequences used to estimate the parameters of the HMM is not high enough. Indeed, these sequences have to capture all the possible behaviors while enacting the process under study to produce an accurate Map. Second, the BWA requires an important number of iterations to converge to a result. For instance, it converges at 9, 986 learning iterations for the E/R diagrams experiment and 20, 237 learning itera-tions for the Eclipse case study. Moreover, it cannot always be guaranteed to converge to the global maximum likeli-hood. Third, although the MMM automatically discovers the topology of the Map process model, the names of strate-gies and intentions are still inferred semi-automatically. The manual part of this naming procedure introduces a human
bias. Fourth, the M1M0 topology chosen for the HMM is
the most sophisticated topology allowing the use of an algo-rithm such as BWA or equivalent algoalgo-rithms. More complex topologies may actually be more appropriate to model some processes. However, there is no known algorithm to estimate
the parameters of these topologies, as BWA does for M1M0.
For this reason, the scope of MMM is limited to the M1M0
topology.
7.
CONCLUSIONS
This paper has presented the Map Miner Method (MMM), a method for automating the construction of an intentional process model from users’ activities logs. Constructing an intentional process model from event logs is a novel approach to model processes. It helps understand the users’ intentions and strategies while using software products. Further, it can help software designers adapting the products functionalities to better meet users’ needs, therefore making products more user-friendly. On the other hand, the intentional model can assist any user (novice or experimented) by providing rec-ommendations to choose the next step of a process.
The main contribution of this work is to build from theory a method which fully constructs the topology of an inten-tional model, only based on users’ activity logs. This makes the method easily applicable to any dataset, as long as it is made of users’ traces of activities. In this paper, MMM was validated by a controlled experiment (creation of E/R diagrams by students) and then by a large-scale case study (developers of Eclipse UDC).
Although the MMM automatically discovers the topology of the intentional model, the names of strategies and in-tentions are still inferred semi-automatically. This could be fully automated by building a more sophisticated ontology. In addition, we are developing an ProM [24] plug-in which will allow modeling processes in intentional manner.
8.
REFERENCES
[1] I. Ajzen and M. Fishbein. Attitude-behavior relations: A theoretical analysis and review of empirical
research. Psychological bulletin, 84(5):888, 1977.
[2] R. Baeza-Yates, L. Calder´on-Benavides, and
C. Gonz´alez-Caro. The intention behind web queries.
In String processing and information retrieval, pages 98–109. Springer, 2006.
[3] L. Bass, P. Clements, and R. Kazman. Software architecture in practice, 2nd edn. sei series in software engineering, 2003.
[4] L. E. Baum, T. Petrie, G. Soules, and N. Weiss. A maximization technique occurring in the statistical analysis of probabilistic functions of markov chains.
The annals of mathematical statistics, 41(1):164–171,
1970.
[5] Y. Bengio. Learning deep architectures for ai.
Foundations and trends R in Machine Learning,
2(1):1–127, 2009.
[6] A. W. Biermann and J. A. Feldman. On the synthesis of finite-state machines from samples of their
behavior. Computers, IEEE Transactions on, 100(6):592–597, 1972.
[7] J. E. Cook and A. L. Wolf. Discovering models of software processes from event-based data. ACM
(TOSEM), 7(3):215–249, 1998.
[8] A. Dardenne, A. Van Lamsweerde, and S. Fickas. Goal-directed requirements acquisition. Science of
computer programming, 20(1):3–50, 1993.
[9] F. D. Davis, R. P. Bagozzi, and P. R. Warshaw. User acceptance of computer technology: a comparison of two theoretical models. Management science, 35(8):982–1003, 1989.
[10] Eclipse. Filtered udc data.
http://archive.eclipse.org/projects/usagedata/, 2013.
[11] Eclipse. Usage data collector.
http://eclipse.org/org/usagedata/, 2013. [12] A. J. Enright, S. Van Dongen, and C. A. Ouzounis.
An efficient algorithm for large-scale detection of protein families. Nucleic acids research,
30(7):1575–1584, 2002.
[13] M. Fowler. Refactoring: improving the design of
existing code. Addison-Wesley Professional, 1999.
[14] J. A. Hartigan and M. A. Wong. Algorithm as 136: A k-means clustering algorithm. Journal of the Royal
Statistical Society. Series C (Applied Statistics),
28(1):100–108, 1979.
[15] J. Herbst and D. Karagiannis. Integrating machine learning and workflow management to support acquisition and adaptation of workflow models. In
Database and Expert Systems Applications, 1998. Proc. 9th Intl WS. on, pages 745–752. IEEE, 1998.
[16] M. Jarke and K. Pohl. Establishing visions in context: towards a model of requirements processes. In ICIS, pages 23–34, 1993.
[17] B. H. Juang and L. R. Rabiner. Hidden markov models for speech recognition. Technometrics, 33(3):251–272, 1991.
[18] G. Khodabandelou. Contextual recommendations using intention mining on process traces. In
Proceedings of 7th Intl. Conf. on RCIS, 2013.
[19] G. Khodabandelou, C. Hug, R. Deneck`ere, and C. Salinesi. Process mining versus intention mining. In
Enterprise, Business-Process and Information Systems Modeling, pages 466–480. Springer, 2013.
[20] G. Khodabandelou, C. Hug, R. Deneckere, C. Salinesi, et al. Supervised intentional process models discovery using hidden markov models. In Proceedings of 7th
Intl. Conf. on RCIS, 2013.
[21] D. Lorenzoli, L. Mariani, and M. Pezz`e. Automatic generation of software behavioral models. In Software
Engineering, 2008. ICSE’08. ACM/IEEE 30th International Conference on, pages 501–510. IEEE,
2008.
[22] E. Murphy-Hill and A. Black. Breaking the barriers to successful refactoring. In Software Engineering, 2008.
ICSE’08. ACM/IEEE 30th International Conference on, pages 421–430. IEEE, 2008.
[23] K. Park, T. Lee, S. Jung, H. Lim, and S. Nam. Extracting search intentions from web search logs. In
ITCS, 2010 2nd Intl. Conf. on, pages 1–6. IEEE, 2010.
[24] ProM. http://processmining.org, 2013.
[25] L. Rabiner and B. Juang. An introduction to hidden markov models. ASSP Magazine, IEEE, 3(1):4–16, 1986.
[26] C. Rolland. Modeling the requirements engineering process. In Information Modelling and Knowledge
Bases V: Principles and Formal Techniques: Results of the 3rd European-Japanese Seminar, Budapest, Hungary, May, pages 85–96, 1993.
[27] C. Rolland, N. Prakash, and A. Benjamen. A multi-model view of process modelling. Requirements
Engineering, 4(4):169–187, 1999.
[28] C. Rolland and C. Salinesi. Modeling goals and reasoning with them. In Engineering and Managing
Software Requirements, pages 189–217. Springer, 2005.
[29] A. Rozinat, A. A. de Medeiros, C. W. G¨unther,
A. Weijters, and van der Aalst. Towards an evaluation
framework for process mining algorithms. 2007.
[30] P. Soffer and C. Rolland. Combining intention-oriented and state-based process modeling. In Conceptual
Modeling–ER 2005, pages 47–62. Springer, 2005.
[31] M. Vakilian, N. Chen, S. Negara, B. A. Rajkumar, B. P. Bailey, and R. E. Johnson. Use, disuse, and misuse of automated refactorings. In Software
Engineering (ICSE), 2012 34th International Conference on, pages 233–243. IEEE, 2012.
[32] W. Van der Aalst, T. Weijters, and L. Maruster. Workflow mining: Discovering process models from event logs. Knowledge and Data Engineering, IEEE
Transactions on, 16(9):1128–1142, 2004.
[33] W. M. Van der Aalst and W. van der Aalst. Process
mining: discovery, conformance and enhancement of business processes. Springer, 2011.
[34] Z. Xing and E. Stroulia. Refactoring practice: How it is and how it should be supported-an eclipse case study. In Software Maintenance, 2006. ICSM’06, pages 458–468. IEEE, 2006.
[35] E. Yu. Modelling strategic relationships for process reengineering. Social Modeling for Requirements