HAL Id: hal-00274619
https://hal.archives-ouvertes.fr/hal-00274619
Submitted on 31 May 2020
HAL is a multi-disciplinary open access archive for the deposit and dissemination of sci-entific research documents, whether they are pub-lished or not. The documents may come from teaching and research institutions in France or abroad, or from public or private research centers.
L’archive ouverte pluridisciplinaire HAL, est destinée au dépôt et à la diffusion de documents scientifiques de niveau recherche, publiés ou non, émanant des établissements d’enseignement et de recherche français ou étrangers, des laboratoires publics ou privés.
The Impact of Regulations on Agricultural Trade:
Evidence from SPS and TBT Agreements
Anne-Célia Disdier, Lionel Fontagné, Mondher Mimouni
To cite this version:
Anne-Célia Disdier, Lionel Fontagné, Mondher Mimouni. The Impact of Regulations on Agricultural Trade: Evidence from SPS and TBT Agreements. American Journal of Agricultural Economics, Oxford University Press (OUP), 2008, 90 (2), pp.336-350. �10.1111/j.1467-8276.2007.01127.x�. �hal-00274619�
Version preprint
The Impact of Regulations on Agricultural Trade: Evidence from the SPS and TBT Agreements
Anne-Célia Disdier, Lionel Fontagné and Mondher Mimouni
According to WTO rules, countries may adopt regulations under the Agreements on Sanitary and Phyto-Sanitary (SPS) and Technical Barriers to Trade (TBT). We an-alyze the structure of these measures in agricultural trade. The inventory approach suggests that European countries have among the lowest coverage ratios of all OECD countries. Using a gravity equation, we also estimate their stringency. Our results sug-gest that they significantly reduce developing countries’ exports to OECD countries, but do not affect trade between OECD members. Furthermore, European imports are more negatively influenced by SPS and TBTs than imports of other OECD countries.
JEL classification: F13, Q17
Key words: Agriculture, Protectionism, Sanitary and phyto-sanitary standards, Tech-nical barriers to trade.
Running Head: The Impact of Regulations on Agricultural Trade
Anne-Célia Disdier is researcher, INRA, UMR Economie Publique INRA-AgroParisTech; Lionel Fontagné is professor, Paris School of Economics, University of Paris I and scientific advisor, CEPII; Mondher Mimouni is analyst, International Trade Center (UNCTAD-WTO). The authors thank the three anonymous referees, Christopher Barrett, Paul Baker, John Beghin, Stephan Marette, Alan Matthews, Luca Salvatici, and participants at seminars at the INRA Paris-Grignon, the Iowa State University, the CEPII, and the OECD (seminar on Non-tariff Measures in Agri-food Trade) for helpful comments on earlier versions of this manuscript. This work was financially supported by the “Agricultural Trade Agreements (TRADEAG)” project, funded by the European Commission (Specific Targeted Research Project, Contract no. 513666). Any remaining errors are the authors’. The definitive version is available at www.blackwell-synergy.com
Version preprint
Sanitary and Phyto-Sanitary measures (SPS) and Technical Barriers to Trade (TBTs) may play an important role in the conduct of international negotiations. In their July 2006 meeting in St Petersburg, Vladimir Putin and George W. Bush clashed over the accession of Russia to the World Trade Organization (WTO), apparently as a result of Putin’s request to impose phyto-sanitary measures on US exports of beef and pork.1 The concern over the proliferation of sanitary or environment-related measures for agricultural and food products is not limited to the United States. Developing countries (DCs) protest regularly against the increasing use of non-tariff barriers (NTBs) by developed countries. During their meeting on July 13, 2004 in Mauritius, the Trade Ministers from the Alliance of the African, Caribbean and Pacific (ACP) Group of States, the African Union (AU) and the Least Developed Countries (LDCs), commonly known as the G-90 asked “WTO members [to] exercise restraint in applying TBT and SPS measures to products of G-90 countries and [to] provide technical and financial assistance for compliance with SPS and TBT requirements for the export of G-90 agricultural commodities”.2
The purpose of this article is to study the importance and the structure of SPS and TBT measures in agricultural trade. Going beyond the simple inventory approach, we investigate two central questions: first, do these measures significantly influence trade flows? Second, is the impact similar for all exporting countries? Trade impacts of SPS and TBTs are ambiguous. In the case of incomplete information on traded products, SPS and TBTs can facilitate trade by signaling that products are safe to the consumer. However, if these measures are used in a protectionist way, they have trade-impeding effects. Thilmany and Barrett (1997) distinguish between informative and uninformative regulatory trade barriers. The former convey information that may allay consumer concerns about product quality or safety; the latter do not. Both pro-vide de facto protection to import-competing firms, whose producer surplus increases
Version preprint
regardless. But while consumer surplus unambiguously decreases with the imposi-tion of uninformative barriers, informative barriers can lead to increased consumer surplus.
Previous works (Otsuki, Wilson, and Sewadeh 2001; Moenius 2004) do not control for tariffs faced by exporters in the importing country. Consequently one cannot distinguish the impact of NTBs on trade from that of tariffs. To avoid this bias, we include a bilateral measure of market access in our estimations. In addition, we consider three different variables to account for SPS and TBT measures: a simple dummy variable equal to one if the importing country notifies at least one barrier at the six-digit level of the Harmonized System of Classification (hereafter HS), a frequency index and an ad-valorem equivalent.
Results of our inventory approach first suggest that of the 690 products included in our sample, only 4 do not face any form of barrier in any importing country. These descriptive statistics also indicate that European Union (EU) countries have the lowest coverage ratios of all OECD countries except South Korea and Turkey. Results of our econometric analysis show that, on the whole, SPS and TBT measures negatively influence OECD imports. Our estimations also suggest that SPS and TBTs do not significantly affect bilateral trade between OECD members but significantly reduce DCs and LDCs exports to OECD countries. Furthermore, EU’s demand for imports seem to be more negatively affected by SPS and TBTs than imports of other OECD countries. Lastly, our sectoral analysis shows that SPS and TBT measures could foster trade in some sectors.
Version preprint
Related empirical literature
Different measures have been suggested in the literature for identifying non-tariff barriers to trade and estimating their impact.3 We provide here a brief review of
them and of their main applications (for a detailed review, see for example Deardorff and Stern 1998; Beghin and Bureau 2001; or Cipollina and Salvatici 2006). These measures can be classified into four groups:
• Frequency and coverage indexes. The frequency index only accounts for the presence or absence of an NTB. This index does not provide any information on the relative value of affected products. This could be acquired through the cover-age index. Ideally, the latter would be computed using the value of imports that would have occurred in the absence of NTBs as weight (Leamer 1990). This value is however unobservable and imports (home or world imports) are therefore usually used as alternative weights. Nevertheless, this approach suffers from an endogeneity problem. If trade barriers are effective in reducing imports, the coverage ratio is downward-biased. Deardorff and Stern (1998) mention two other limits of coverage and frequency indexes. First, they do not indicate the deterrent effects that NTBs may have on exporters’ pricing and quantity decisions. Second, these indexes do not provide information on the possible effects of trade barriers on prices, production and international trade. Last but not least, this approach misses an important issue when applied to SPS and TBTs: in cases where there is incomplete information on traded products, such measures can facilitate trade by signaling that products are safe to the consumer.
Frequency and coverage indexes were used in several studies (Nogués, Olechowski, and Winters 1986; OECD 1995; Fontagné, von Kirchbach, and Mimouni 2005 for example). Nogués, Olechowski, and Winters (1986) analyze the impact of NTBs on
Version preprint
imports of sixteen industrial countries for the years 1981-1983. The authors point out that NTBs affect more than 27% of all imports and more than 34% of imports from developing countries.
• Quantity-impact measures. This method involves estimating models of trade flows (mainly gravity equations) in which information on NTBs is introduced as ex-planatory variables. Comparison between predicted trade flows in the absence of NTBs and actual trade flows then provides some indication of the trade restrictive-ness of these barriers. Evaluations of trade barriers included in these models are usually based on frequency or coverage indexes. One exception is Otsuki, Wilson, and Sewadeh (2001) who introduce the level of NTBs (food safety standards) them-selves. This approach suffers two main drawbacks, however. First, the endogeneity problem between trade barriers and imports is usually not addressed. In addition, predicted trade flows are sensitive to the assumptions made in the models (Beghin and Bureau 2001).
Leamer (1990) and Harrigan (1993) employ this method to determine the trade im-pact of NTBs in 1983. Leamer’s (1990) results show that trade barriers have reduced Latin American exports to 14 major industrialized countries, while Harrigan’s (1993) conclusions suggest that trade-reducing effects of tariffs and transport costs between OECD countries were significantly higher than the one observed for NTBs. Moenius (2004) relies on this approach to investigate the trade impact of bilaterally shared and country-specific standards. His analysis covers 471 industries in 12 countries over the period 1980-1995.4 Estimates display a positive influence of shared stan-dards on trade. For importer-specific stanstan-dards, results differ across sectors. Their influence seems to be negative for agriculture, while it is positive for manufactured goods. Moenius (2006) confirms the negative impact of importer-specific standards on agricultural trade flows. A negative effect is now obtained for shared standards.
Version preprint
Focusing on EU harmonization of technical regulations in the food industry, Henry de Frahan and Vancauteren (2006) suggest that harmonization has contributed to more intra-EU trade. Finally, quantity-impact measures are also used by Fontagné, Mi-mouni, and Pasteels (2005) for estimating the trade’s effect of SPS and TBTs. Their study covers all notifications compiled up to 2001 and controls for tariffs. While their results suggest a predominance of negative impacts of SPS and TBTs on trade of fresh and processed food, they show insignificant or even positive impacts for most of the manufactured products.
• Price-comparison measures. This approach is aimed at detecting the effects of NTBs on domestic prices of imported goods by comparing these prices with some reference prices. It therefore provides ad-valorem equivalents (AVEs) of NTBs which are directly comparable with a tariff. Since the price that would prevail in the absence of barriers is unobservable, the price effect or “price wedge” is commonly computed by simply comparing domestic and world prices in the presence of NTBs. The main drawback of such estimation strategy, however, is that it abstracts from possible quality differences between domestic and imported goods.
Among papers implementing price wedge measures, three have made important contributions. Bradford (2003) computes AVEs using import prices corrected for transport, taxes and other distribution costs. Dean et al.’s (2006) paper is the first to retain a large group of countries and products. Furthermore, the authors estimate AVEs directly, using an equation derived from a differentiated products model of retail prices. Finally, Yue, Beghin, and Jensen (2006) extend the price wedge method in order to account for the heterogeneity between domestic and imported goods.
• Price effect measures using import demand elasticities. This new method -which also provides AVEs of NTBs - has been developed by Kee, Nicita, and Olar-reaga (2006). Using Leamer’s (1990) comparative advantage approach, the authors
Version preprint
estimate the quantity impact of two broad types of NTBs (core NTBs and agricul-tural domestic support) on imports at the HS six-digit tariff line. Leamer’s (1990) approach consists of predicting imports using factor endowments. In the presence of NTBs, real imports are different from the predicted ones. This difference represents the impact of NTBs on trade flows. This quantity impact is then converted into an AVE using import demand elasticities. This indirect calculation is the main weakness of this approach. However, the unavailability of detailed price data for all countries and products prevents the use of the price-comparison method described above in studies aiming to be exhaustive.
In our empirical application, we use the AVEs calculated by Kee, Nicita, and Olarreaga (2006) along with a simple dummy and a frequency index to measure the trade impact of SPS and TBTs. Kee, Nicita, and Olarreaga’s (2006) results suggest that poor countries face high barriers on their export bundles and that NTBs contribute for a large share of trade restrictiveness across countries. Our own research produces similar conclusions.
Data
WTO members must notify their non-tariff measures. These notifications are col-lected, complemented by information based on national sources and analyzed by the United Nations Conference on Trade and Development (UNCTAD).5 Our empirical
sources focuses on measures notified under the SPS and TBT agreements. We limit our investigation to agricultural and food industry products.6 Countries can adduce
six different motives to impose measures on agricultural trade flows: (i) protection of the environment, (ii) protection of wildlife, (iii) protection of plant health, (iv) protection of animal health, (v) protection of human health, (vi) protection of human
Version preprint
safety. The database on notifications is described in the appendix. Each notification provides information on the notifying country (the importer), the affected product (at the HS six-digit level), and the classification code of the barrier.
Using these data, we estimate econometrically the trade impact of SPS and TBTs (next section). Before doing this, we provide some descriptive statistics. We examine which countries make most intensive use of SPS or TBT measures and which products and exporters are the most affected. We also investigate whether SPS and TBTs are used in accordance with their original objective or instead used in a protectionist way. The inventory approach is an efficient way of addressing the first issue, but less reliable as regards the second. Broad coverage of agricultural imports by SPS does not necessarily inform on the stringency of such measures. Still, comparison of the enforcement of such barriers for individual products makes sense. If a sizeable share of international trade is affected by these barriers, then this would suggest the presence of a wider consensus among importers on the negative impact of the product on the environment or on health. One can however imagine cases where an importer will notify a measure not in order to protect health or environment but for protectionist purposes. These cases cannot be identified in our analysis. On the other hand, if only a single or very few countries notify a measure, they can be suspected of protectionism. The boundary between both cases will be of course a matter of arbitrary chosen thresholds.
We first merge at the HS6 level information on notifications with trade data of the BACI (Base pour l’Analyse du Commerce International) database developed by the Centre d’Etudes Prospectives et d’Informations Internationales (CEPII) (See Gaulier et al. Forthcoming).7 Data on trade are for the year 2004. Notifications are compiled
up to 2004, but not all countries are updated each year in the source database. Our sample includes 154 importing countries, 183 exporting countries and 690 products.
Version preprint
Our database is available at http://team.univ-paris1.fr/teamperso/fontagne/ data.htm. EU countries are considered individually. We exclude intra-EU trade flows from our sample. EU member states apply the principle of mutual recognition on SPS and TBT regulations. The principle of mutual recognition states that, as far as health and safety are concerned, “it is for the national authorities to demonstrate in each case that their rules are necessary to give effective protection to the interests referred to in Article 36 (now Article 30) of the Treaty” (European Commission 2002). Even the recognition is not automatically granted, there is no need to comply with a regulation of the destination market but only to prove that the regulation in the origin country is equivalent. This makes a profound difference with trade with non-member states.
Among the importing countries, only 92 notify measures under the SPS and TBT agreements. Data on notifications do not have a bilateral dimension. With rare exceptions, measures are enforced unilaterally by importing countries and applicable to all exporting countries. However, exporters are differently affected by SPS and TBT measures depending on the structure of their exports in terms of products and markets. In our analysis, the value of world imports at the HS six-digit level that groups tariff lines on which measures have been notified is denominated “potentially affected imports.” Exporters are only potentially affected, since they can bypass measures by exporting to other markets. “Affected imports” correspond to the value of world imports (in the affected products) by countries notifying these measures. The term “coverage ratio” refers to the ratio of affected imports over potentially affected imports. For example, if we consider HS6: 010210 - Pure-bred breeding animals, the value of potentially affected imports is 271.6 million USD. However, only 45 countries notify a measure on this product. Thus, affected imports are equal to 92.3 million USD and the coverage ratio is 92.3/271.6 = 34%.
Version preprint
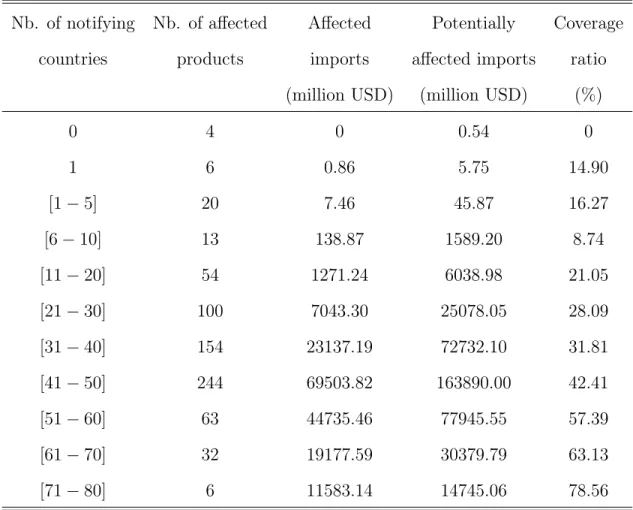
measures are present. These measures represent 5,247 notifications.8 If we rank these groups using the number of affected products, “technical barriers”, which define specific characteristics for products, is the most frequent measure. We then obtain “authorization” and “technical measure related to testing, inspection or quarantine requirements”. Protection of human health is the most frequent concern adduced by countries in our sample. In decreasing order of number of notifications, the other concerns are for animal health, plant health, human safety, wildlife and environment. Table 1 reports results on the distribution of measures by number of notifying countries. Of the 690 agricultural and food industry products, only 4 do not face any barrier in any importing country (HS6: 150510 Wool grease, crude; HS6: 151560 -Jojoba oil or fractions not chemically modified; HS6: 430140 - Raw beaver furskins, whole; HS6: 430150 - Raw musk-rat furskins, whole). For the remaining 686 products, measures are notified by at least one importer. For 20 products, one can suspect a protectionist use of barriers, identified as cases where only five or less countries enforce a measure on a product. In the case where only one country notifies a measure, the number of affected products is then six.
Insert table 1 here
We now investigate which products are the most affected by these measures. We rank products according to the following three criteria: (i) number of notifying coun-tries, (ii) coverage ratio and (iii) imports in notifying countries. We list below the three most affected products in each case.9 Criterion value is reported in brackets. These criteria strongly influence the ranking of products. Products are indeed mostly different in each ranking.
Version preprint
animals (78), HS6: 060310 - Cut flowers and flower buds for bouquets (73), HS6: 020230 - Bovine cuts boneless, frozen (73).
(ii) Coverage ratio (%): HS6: 020312 - Swine hams, shoulders & cuts bone in, fresh or chilled (98.21), HS6: 020630 - Swine edible offal, fresh or chilled (97.76), HS6: 020319 - Swine cuts, fresh or chilled, nes. (97.11).
(iii) Imports in notifying countries (million USD): HS6: 100190 - Wheat except durum wheat, and meslin (9235.90), HS6: 120100 - Soya beans (8921.85), HS6: 210690 - Food preparations, nes. (5078.15)
The next step is to analyze the use of SPS and TBTs by importing countries: this could shed light on the possible obstacle raised against LDCs’ exports. Table 2 presents a comparison of measures notified by OECD countries (excluding Lux-embourg). These importers are the ones we consider in our econometric application. One result of interest is the variance observed between OECD countries. Five of them (Australia, Mexico, New Zealand, Norway, and the United States) have a coverage ratio above 50%. By comparison, the coverage ratio is only 23.52% for Japan. The coverage ratio for EU is 11.75%. Note that the inclusion of intra- EU trade in the calculation would reduce EU coverage ratio. Intra-EU flows should in principle not be affected by SPS and TBTs (mutual recognition). Thus, the numerator of the ra-tio would indeed be unchanged, while the denominator would increase. Variara-tions in terms of coverage ratio and numbers of affected products between EU members result from differences in countries’ import structures.
Insert table 2 here
The inventory approach can also be used to analyze which exporting countries are the most affected by SPS and TBT notifications. Export flows are here calculated
Version preprint
using mirror flows. Results are described in table 3. The top ten affected exporting countries are defined using two different rankings. The first one uses the coverage ratio and the second one refers to the number of affected products. One interesting finding is that the most affected exporters in terms of coverage ratio are developing countries. On the other hand, seven of the ten most affected exporting countries regarding the number of affected products are developed countries. This last result could be easily explained by the fact that these countries are big. They therefore export more products and face more SPS and TBT measures.
Insert table 3 here
Empirical application
Econometric specification
In this section, we tackle the actual impact of SPS and TBTs on bilateral trade. The gravity equation provides an appropriate framework for this analysis. Our theoretical foundation for trade patterns is the standard new trade monopolistic competition-constant elasticity of substitution (CES) demand-Iceberg costs model introduced by Krugman (1980). Following Redding and Venables (2004), the total value of exports from country i to country j can be written as follows: xij = nip1−σi (Tij)1−σEjGσ−1j ,
with ni and pi the number of varieties and prices in country i, Ej and Gj being the
expenditure and price index of country j. Tij represents the iceberg transport costs.
Trade data are available at the six-digit level. Thus, a key issue here is to choose an aggregation level detailed enough in order to keep variance among groups of products, but aggregated enough in order to avoid the endogeneity bias that could arise if SPS and TBTs are used for protectionist purposes. At the most detailed level of the trade
Version preprint
classification, estimating the impact of SPS and TBTs may simply reveal that these measures are imposed where imports have to be kept under control in the absence of sizeable tariffs. We therefore decided to aggregate products and chose to work at the four-digit level of the HS classification.10
Two empirical specifications could be used to estimate this equation. First, ex-porting country’s supply capacities and imex-porting country’s absorption capacity could be proxied by the gross domestic products (GDPs) of both countries. However, the robustness of this specification has been recently questioned in the trade literature (see Feenstra 2004). A more theoretically consistent approach consists in using fixed effects for each exporting and importing country. These fixed effects indeed include the size effects, but also the price and number of varieties of the exporting country for each sector and the size of demand and the price index of the importing partner. Since we use sector-level trade data, we interact HS two-digit sector- and country fixed effects to fully capture the unobserved price indexes at the sector-level. Trans-port costs are measured using the bilateral distance between both partners. These distances are extracted from the CEPII database.11 In addition, we include a dummy variable “Common border” (cbord) that equals one if both countries share a border. Bilateral trade can also be fostered by countries’ cultural proximity. We therefore control for this proximity by introducing two dummies, respectively equal to one if a language is spoken by at least nine percent of the population in both countries (clang) or if both partners have had a colonial relationship (col). Data come from the previously mentioned CEPII database.
The next step is to introduce tariff barriers in the gravity equation. Previous works (see for example Otsuki, Wilson, and Sewadeh 2001; Moenius, 2004 - one exception is Fontagné, Mimouni, and Pasteels 2005) do not include the tariffs faced by country i’s exporters in j in the estimations. Consequently one cannot distinguish
Version preprint
the impact of NTBs on trade from that of tariffs. To avoid this bias, we include a bilateral measure of market access.12 Data are extracted from the Market Access
Map (MAcMap) database (http://www.cepii.fr/anglaisgraph/bdd/macmap.htm) jointly developed by the International Trade Centre (UNCTAD-WTO) and the CEPII (see Bouët et al. forthcoming). It incorporates not only the applied tariff but also specific duties, tariff quotas and anti-dumping duties. All these barriers are converted into an ad-valorem equivalent and summarized in one measure. This measure is computed initially at the HS six-digit level. Since we conduct our analysis at the HS four-digit level we need to average tariff data. Since the traditional import-weighted average is flawed by the problem of endogeneity between trade flows and tariffs, we rely on the Reference Group method used in MAcMap.13
Our focus in this article is on the trade impact of measures notified by importing countries under the SPS and TBT agreements. The last step is therefore to specify these barriers. We consider three different variables: (i) a dummy variable equal to one if the importing country notifies at least one barrier at the six-digit level of the HS classification, (ii) a frequency index and (iii) an ad-valorem equivalent. The frequency index is defined as the proportion of HS6 product items notified by the importing country within a HS4 product category. Values belong to the [0;1] interval.14 Data
on ad-valorem equivalents come from Kee, Nicita, and Olarreaga (2006). The authors construct price effect measures using import demand elasticities.15
By merging their database and our information on notifications under SPS and TBT agreements, we can isolate AVEs of SPS and TBT measures.16 For example, in Kee, Nicita, and Olarreaga’s (2006) sample, the US impose a NTB on the HS6 code 020120, and its AVE is 0.826. The UNCTAD database also indicates the presence of a notification by the US on this HS6 code. We therefore pick up the AVE calculated by Kee, Nicita, and Olarreaga (2006) for this observation. However, Kee, Nicita, and
Version preprint
Olarreaga (2006) consider various NTBs. Therefore, if a NTB is included in their sample but not in the UNCTAD one, we assume that this NTB is not a SPS or TBT measure and do not use the AVE they compute.
For our estimations, we calculate average AVEs at the HS four-digit level using the reference group method. If we focus on OECD countries, the average AVE is 0.313, with a standard error of 0.397. For EU importers (without Luxembourg), the mean is 0.347 and the standard error is 0.397. By comparison, for other OECD importers which are not EU members, the average AVE is 0.261 (standard error: 0.387). A table presenting the AVEs at the HS two-digit level separately for these three groups of importers and for OECD exporters and DCs and LDCs ones is available in Disdier, Fontagné, and Mimouni (2008). After taking logs, our preferred estimated equation is:
ln xshs4
ij = µif esihs2 + λjf esjhs2+ δ1ln dij+ δ2cbordij + δ3clangij+ δ4colij
+δ5tarsijhs4 + δ6SP ST BTijshs4 + u shs4
ij . (1)
For our dependent variable, we choose bilateral import data of country j from country i. The source is the BACI database, already used in the inventory approach. Notifications are compiled up to 2004 in our sample (we take the latest year available for every reporter), and tariff data are for 2004. We therefore use cross-section data for 2004. We are however confronted with the problem of clustering of errors. The error term is likely to exhibit correlation patterns for a given country-pair. To deal with this problem, we cluster the robust standard errors at the country-pair level.
Version preprint
We now present our estimation results. The database is hardly satisfactory with regards to the notifications made by non-OECD countries. Some sets of notifications have not been updated for years; others have been updated - or recorded by UNCTAD - without checking their consistency (e.g., countries imposing SPS and TBTs on all products). Tariffs applied by non-OECD countries also present some inconsistencies. Faced with poor quality data from developing countries, we decided to restrict our sample of importers to OECD countries.
Table 4 presents an overview of the results. The first two columns report results with a simple gravity estimation. Fixed effects estimation results are presented in columns (3) to (7). Technical and degree of freedom constraints forced us to limit the number of fixed effect variables in our estimations. We therefore include only HS two-digit sector-specific exporter fixed effects and do not interact importer fixed effects with sector dummies.17 Column (1) uses the import-weighted average methodology
to aggregate the bilateral tariffs from the tariff line to the HS4 level. In the other columns, the reference group approach is applied. Furthermore, to allow comparisons, we re-estimate the model (3) restricting the sample to observations for which we have the AVE of SPS and TBTs: results are shown in column (4). We also impose this constraint in columns (5) and (6). The overall fit of regressions is consistent with what is found in the literature.
The comparison between columns (1) and (2) shows that the magnitude of the coefficient estimate on the tariff variable is not significantly affected by the choice of the aggregation procedure. Regarding traditional covariates, distance negatively influences bilateral imports. As expected, trade flows are fostered by sharing a border. We can also see that imports are higher if both countries share a language or have had a colonial relationship in the past. This last variable is however significant only at the ten percent level. Comparing results from simple gravity and fixed effects estimations
Version preprint
(columns 2, 3 and 4), we see that the value of coefficient estimates varies but the sign of the influence is unchanged. Before we discuss the results obtained for NTBs notified under SPS and TBT agreements, we should mention that the influence of all the other explanatory variables is stable in the fixed effects specifications (columns 4 to 7).
Concerning SPS and TBTs, columns (5), (6) and (7) include respectively a simple dummy variable equal to one if the importing country notifies at least one barrier at the HS6 level, a frequency index and finally an ad-valorem equivalent based on Kee, Nicita, and Olarreaga (2006). The coefficient estimate on SPS and TBTs is always negative and significant. The introduction of a simple dummy variable (column 5) provides a coefficient estimate equal to -0.15 while the use of a frequency index (column 6) gives a coefficient estimate equal to -0.21. Both estimates are significant at the one percent level. When an AVE is introduced (column 7), the coefficient estimate is -0.06 (p < 0.05).
Insert table 4 here
Table 5 goes further in the analysis and presents the influence of tariffs and NTBs for different sub-samples of importers. In this table, SPS and TBTs are measured in terms of ad-valorem equivalents. In the first two columns, all OECD countries are included in our sample of importers. Note that column (1) replicates column (6) of table 4 for convenience. The last two columns now focus only on EU member states (excluding Luxembourg). The overall quality of the fit remains high and is comparable to that obtained in the previous table. A second objective in this table is to study potential differences in the influence of tariffs and SPS and TBTs between exporting countries. The distinction we make is between OECD exporters on one hand, and DCs & LDCs on the other hand. Consequently, in columns (2) and (4), we interact tariffs and AVEs with two indicator variables respectively equal to one if
Version preprint
exporters are OECD countries and DCs or LDCs. For comparison, columns (1) and (3) do not include any distinction between exporting countries. We first analyze the results for all OECD importers and then compare them with those for EU countries. Results on interaction variables are particularly interesting (column 2). First, our results suggest that OECD exporters are more affected than DCs and LDCs exporters by tariffs (−0.14a vs. −0.04b): this result is easy to interpret if one keeps in mind that we are considering agricultural and agro-food products, where tariffs are sizeable. Also, developing exporters are specialized in tropical products that are less protected by tariffs or benefit from tariff preferences. More interestingly, SPS and TBTs have an insignificant impact on OECD exports (0.08) but a negative one on DCs and LDCs exports (−0.14a).
We are confronted here with the dual effect of SPS and TBTs in agriculture: they can have no impact on trade or even facilitate it as they carry information and confidence on the imported products, assuming that exporters can cope with the associated technical requirements and paperwork; but they can also be trade-impeding when countries are unable to meet the standard. Regarding the sub-sample restricted to EU imports (columns 3 and 4), the magnitude of coefficient estimates on tariffs is higher than the one observed for all OECD imports, a conclusion in line with the concerns of exporters with market access in the EU for agricultural products. Furthermore, SPS and TBTs now influence negatively (p < 0.10) exports of other OECD countries (column 4). Table 5 seems therefore to suggest that tariffs as well as SPS and TBT measures applied by EU countries make it harder for foreign countries to export their agricultural goods to the European market than to other OECD countries’ markets. This result is similar to the one obtained by Moenius (2006).
Version preprint
significantly the results. The main difference is on the magnitude of the coefficient estimates on SPS and TBTs. This magnitude is higher when we use the frequency index. This result was expected since the coefficient estimate on the frequency index was already higher than the one on the AVE in table 4. However, in estimations using the frequency index, SPS and NTBs still have an insignificant influence on OECD bilateral trade flows but a negative and significant one on DCs and LDCs exports. When the sample is restricted to EU imports, the effect of SPS and TBTs on OECD exports becomes negative and significant at the one percent level.
Insert table 5 here
Now, we would like to know in which agricultural sub-sectors the trade-impeding impact of SPS and TBTs is the most stringent. Table 6 reports the coefficient estimate on the NTB variable for each sub-sector at the HS2 level. We run two different estimations. First, we interacted the NTB variable with sectoral dummies. Results are presented in column (1). The second strategy we adopted consisted in estimating equation 1 for each sector separately (column 2). One advantage is to allow coefficient estimates on all other explanatory variables to differ across sectors. Column (1) includes importer and sector-specific exporter fixed effects while column (2) includes importer and exporter fixed effects. Due to the small number of observations, we do not report results for the three following sectors: HS29 “Organic chemicals”, HS38 “Miscellaneous chemical products”, and HS50 “Silk”.
Results in both columns are relatively similar. Some coefficient estimates are significant in only one estimation but none of them have a positive and significant influence in one estimation and a negative and significant impact in the other. For eight sectors, coefficient estimates are negative and significant in both columns. The impact is particularly strong in sectors HS06 “Live trees, plants, bulbs, roots, cut
Version preprint
flowers ”, HS13 “Lac, gums, resins, vegetable saps & extracts nes ”, HS22 “Beverages, spirits & vinegar”, and HS24 “Tobacco & manufactured tobacco substitutes”. On the other hand, coefficient estimates are not significant in both specifications for ten sectors and positive and significant in both specifications for seven sectors. The largest effects are observed in sectors HS10 “Cereals” and HS51 “Wool, animal hair, horsehair yarn & fabric thereof”. This reinforces the conclusion that not all SPS and TBTs in agriculture are trade-impeding.
Our results largely confirm the findings of previous studies. Moenius (2004) finds that country-specific product and process standards of importers reduce imports in the agricultural sector. Fontagné, Mimouni, and Pasteels (2005) focus on SPS and TBT measures. Like us, they show that those measures negatively influence bilateral trade of cut flowers and of processed food like beverages (HS22).
We also run sectoral estimations using frequency indexes. Results are quite differ-ent from the ones obtained with the AVEs. Coefficidiffer-ent estimates in both columns are now negative and significant for eight sectors, positive and significant for one sector and not significant for four sectors. Main differences are on the concerned sectors. Trade flows of sugars are now positively affected by SPS and TBTs. Cereals and wool & animal hair are no more positively influenced by SPS and TBTs. Furthermore, co-efficient estimates for tobacco and beverages are now insignificant. Only trade flows of lac, gums and resins and live trees and cut flowers remain negatively and signif-icantly affected by SPS and TBTs. This sensitivity of sectoral results could come from differences in the definitions of SPS and TBT proxy. Our focus in this paper is on technical and environmental regulations. Accordingly, we do not take into ac-count tariff-rate quotas (TRQs), which are considered by Kee, Nicita, and Olarreaga (2006). Thus, TRQs are included in Kee, Nicita, and Olarreaga’s (2006) ad-valorem equivalents but are not included in the definition of our frequency index. We checked
Version preprint
the sensitivity of our results to the presence of TRQs in the AVEs calculated by Kee, Nicita, and Olarreaga (2006). Our results suggest the presence of reverse causality between AVEs and the value of imports. Thus the presence of a TRQ could bias our results on AVEs of SPS and TBTs. However, this potential bias would only affect the observations for which we simultaneously have a TRQ and a SPS/TBT (13% of our sample). All these results and their variations suggest that sectoral trade effects of SPS and TBTs represent a promising area of research.
Insert table 6 here
We now provide some robustness checks for the results obtained so far.18 A
pos-sible bias in our results could stem from the presence of zero trade flows. Such flows are not reported in the trade database BACI and are treated as missing observations. However, for some products and importers, we have notifications under SPS and TBT agreements but no observations on the imports of these products by these countries. One can assume that the degree of stringency of some SPS and TBT measures is very high and prevents imports. We therefore proceed as follows: if, in the case of a product (at the HS six-digit level) and an exporter, we observe on one hand some exports different from zero to non-notifying countries and, on the other hand, a miss-ing export flow to a country that notifies a SPS or a TBT measure, then we replace the missing value by zero. After these replacements, about 4.3% of bilateral imports of OECD countries included in our sample are equal to zero. If we focus on imports of EU countries, this percentage is only about 2.1%. Then in our regressions, we use ln(1 + xshs4
ij ) as the dependent variable. Previous main conclusions remain unchanged
and our results do not show strong differences in terms of magnitude and ranking between exporters. The sectoral analysis also confirms previous results.
Version preprint
TBTs by zero for intra-EU trade flows and in including these trade flows in our es-timations. Previous conclusions are still valid. The sectoral analysis suggests that our results are less robust for some sectors. For sector HS18 “Cocoa & cocoa prepa-rations”, coefficient estimates are significant in both specifications but take different signs. For HS11 “Milling products, malt, starches, inulin, wheat gluten”, both coeffi-cient estimates become insignificant. However, a strong negative impact of SPS and TBTs is still present in sectors HS06 “Live trees, plants, bulbs, roots, cut flowers”, HS13 “Lac, gums, resins, vegetable saps & extracts nes”, HS17 “Sugars & sugar con-fectionery”, HS22 “Beverages, spirits & vinegar”, and HS24 “Tobacco & manufactured tobacco substitutes” and a positive one in sectors HS10 “Cereals” and HS51 “Wool, animal hair, horsehair yarn & fabric thereof”.
Conclusion
This article analyzes the impact of measures notified by importing countries under the SPS and TBT agreements on bilateral trade flows. Our econometric application focuses on OECD imports. Our results first suggest that SPS and TBT measures have on the whole a negative impact on trade in agricultural products. We also show that OECD exporters are not significantly affected by these measures in their exports to other OECD members. On the other hand, exports of developing and least developed countries to OECD countries are significantly reduced by these regulations. In addi-tion, the negative impact of SPS and TBTs is higher if we focus only on exports to the EU market. This last result is particularly interesting. While EU countries notify less SPS and TBTs than other OECD countries (except South Korea and Turkey), econo-metrics shows that these measures are more trade-impeding than the ones adopted by other OECD countries. Our results are robust to different specifications.
Version preprint
SPS and TBT measures offer de facto protection to import-competing firms. This finding is in line with Thilmany and Barrett’s (1997) result. Should we therefore conclude that SPS and TBTs are bad? Theoretically not necessarily if exporting countries can easily reach the level of safety imposed by the SPS or TBT. However, our empirical analysis suggests that much remains to be done to improve the position of developing and least developed countries in the international agricultural trade. As stressed by Josling, Roberts, and Orden (2004), technical and financial assistance to these countries to help them match the requirements imposed by SPS and TBT measures and increase their participation in the international standards organizations should be a priority within the global food system.
Version preprint
Notes
1http://www.usembassy.it/pdf/other/RL31979.pdf
2http://www.gov.mu/portal/sites/ncb/acp/english/doc4.htm
3The discussion is limited to the impact on trade of measures notified under the SPS and TBT
agreements. We do not consider their impact on welfare. Furthermore, we focus on measures used to control imports. Production and export measures are not be studied.
4The measure of standards used is the number of documents that specify the details of standards
for a particular industry, country and year.
5We thank Aki Kuwahara for providing us with detailed information and useful explanations on
the data collection.
6These products are the ones listed in Annex 1 to the Agreement on Agriculture, available at
http://www.wto.org/english/docs_e/legal_e/14-ag.pdf
7http://www.cepii.fr/anglaisgraph/bdd/baci.htm. This database uses original procedures to
har-monise COMTRADE (Commodity Trade Statistics Database) data: evaluation of the quality of country declarations to average mirror flows, evaluation of Cost, Insurance and Freight (CIF) rates to reconcile import and export declarations, etc.
8An HS6 position can be affected by several notifications. This explains why the number of
notifications is higher than the number of “products”.
9The list of the top ten affected products is available in Disdier, Fontagné, and Mimouni (2008). 10To test for this potential endogeneity bias, we estimated the effect of SPS and TBTs on trade
using HS 6-digit trade data. Results showed that the coefficient estimate on a dummy equal to one if a SPS or a TBT is notified at the 6-digit level is equal to -0.06 (p < 0.05). If we use an AVE instead of a dummy to measure the impact of the SPS & TBTs, the coefficient estimate on this AVE is non significant.
11http://www.cepii.fr/anglaisgraph/bdd/distances.htm. These distances are calculated as the sum
of the distances between the biggest cities of both countries, weighted by the share of the population living in each city.
12We controlled for the interaction of SPS/TBT and tariffs by regressing tariffs on AVEs. A
positive coefficient is obtained for the whole sample (0.02, p < 0.05). If we restrict our sample to EU countries’ imports, the coefficient estimate is equal to 0.07 (p < 0.01). If we focus on imports of other
Version preprint
OECD countries, the coefficient estimate is negative and significant (-0.05, p < 0.01). Thus, EU countries use SPS and TBTs as a protectionist complement to tariffs, while other OECD countries use them as a protectionist substitute. Therefore, SPS and TBTs would have more impact in the presence of a tariff in estimations focusing only on EU imports.
13This methodology uses a weighting scheme based on reference groups of countries. We thank
David Laborde and Maria Priscila Ramos for extracting the data from the MAcMap database.
14For example, the product category “0102 - Live bovine animals” includes two product items:
“010210 - Pure-bred breeding animals” and “010290 - Other”. If an importing country imposes a barrier on the first product item, then its frequency index is 0.5 (1/2).
15The use of generated regressors could have some econometric implications. Most works use
two-step OLS procedure for estimating such models. However, Pagan (1984) shows that it yields inefficient estimates. One solution consists in using the full-information-maximum-likelihood (FIML) method, where all the equations of the structural model are estimated simultaneously by maximizing the likelihood function subject to restrictions on all the parameters in the model. However, we just have the AVEs calculated by Kee, Nicita, and Olarreaga (2006) and not their whole database. Therefore, we cannot use this FIML approach.
16Different types of NTBs (price control measures, quantity restrictions, monopolistic measures,
and technical regulations) are covered by Kee, Nicita, and Olarreaga (2006). If more than one type of NTBs is imposed by the importing country at the tariff line level, the dummy variable included in the regression captures the quantitative impact of all these NTBs and its effect is higher. Thus, the estimated price equivalent is biased. However, with the exception of quantity restrictions, most non-tariff barriers taken into account by the authors are environment-related measures notified under the SPS and TBT agreements. Thus the potential bias in our estimations is relatively minor. A second weakness of Kee, Nicita, and Olarreaga’s (2006) AVEs is that they are for the late 1990s. Our trade data are for the year 2004. This temporal gap could bias our results. However, we test the robustness of our findings using a frequency index of SPS and TBTs instead of an AVE. This frequency index is not subject to this temporal bias.
17Our estimations therefore include 6039 sector-specific exporter fixed effects (183 exporter fixed
effects × 33 sector fixed effects) and 29 importer fixed effects.
18Due to space constraints, results are not reported here but are available in Disdier, Fontagné,
Version preprint
References
Beghin, J.C., and J-C. Bureau. 2001. “Quantitative Policy Analysis of Sanitary, Phytosanitary and Technical Barriers to Trade.” Economie Internationale 87:107– 130.
Bouët, A., Y. Decreux, L. Fontagné, S. Jean, and D. Laborde. Forthcoming. “Assess-ing applied protection across the world.” Review of International Economics.
Bradford, S. 2003. “Paying the price: final goods protection in OECD countries.” Review of Economics and Statistics 85(1):24–37.
Cipollina, M., and L. Salvatici. 2006. “Measuring protection: mission impossible?” Working Paper No.2006–07, TradeAG Agricultural Trade Agreements, Brussels.
Dean, J.M., R. Feinberg, J.E. Signoret, M. Ferrantino, and R. Ludema. 2006. “Esti-mating the Price Effects of Non-Tariff Measures.” Working paper No.2006-06-A, Office of Economics, U.S. International Trade Commission, Washington, DC.
Deardorff, A.V., and R.M. Stern. 1998. Measurement of Nontariff Barriers. Ann Arbor, MI: University of Michigan Press.
Disdier, A-C., L. Fontagné, and M. Mimouni. 2008. “AJAE Appendix: The Im-pact of Regulations on Agricultural Trade: Evidence from the SPS and TBT Agreements.” Unpublished manuscript. Available at: http://agecon.lib. umn.edu/.
European Commission. 2002. Report from the Commission to the Council, The European Parliament and the Economic and Social Committee. Second biennial Report on the Application of the Principle of Mutual Recognition in the Single Market. COM(2002) 419 Commission of the European Communities, Brussels.
Version preprint
Feenstra, R. 2004. Advanced International Trade: Theory and Evidence. Princeton, NJ: Princeton University Press.
Fontagné, L., F. von Kirchbach, and M. Mimouni. 2005. “An Assessment of Environmentally-Related Non-Tariff Measures.” World Economy 28:1417–1439.
Fontagné, L., M. Mimouni, and J-M. Pasteels. 2005. “Estimating the Impact of Environmental SPS and TBT on International Trade.” Integration and Trade Journal 22:7–37.
Gaulier, G., S. Zignago, D. Sondjo, A. Sissoko, and R. Paillacar. Forthcoming. “BACI: A World Database of International Trade Analysis at the Product-level. 1989-2005 Version.” Working Paper, Centre d’Etudes Prospectives et d’Informations Internationales, Paris. Available at: http://www.cepii.fr/ anglaisgraph/bdd/baci/baciwp.pdf
Harrigan, J. 1993. “OECD imports and trade barriers in 1983.” Journal of Interna-tional Economics 35(1-2):91–111.
Henry de Frahan, B., and M. Vancauteren. 2006. “Harmonization of food regulations and trade in the Single Market: evidence from disaggregated data.” European Review of Agricultural Economics 33(3):337–360.
Josling T., D. Roberts, and D. Orden. 2004. Food Regulation and Trade: Toward a Safe and Open Global System. Washington, DC: Institute for International Economics.
Kee, H.L., A. Nicita, and M. Olarreaga. 2006. “Estimating Trade Restrictiveness Indices.” Policy Research Working Paper No.3840, World Bank, Washington, DC.
Version preprint
Krugman, P.R. 1980. “Scale economies, product differentiation and the pattern of trade.” American Economic Review 70(5):950–959.
Leamer, E.E. 1990. “Latin America as a Target of Trade Barriers Erected by the Major Developed Countries in 1983.” Journal of Development Economics 32(2):337–368.
Moenius, J. 2004. “Information versus Product Adaptation: The Role of Standards in Trade”, Working Paper, International Business & Markets Research Center , Northwestern University, Evanston, IL.
—–, J. 2006. “The Good, the Bad and the Ambiguous: Standards and Trade in Agricultural Products.” Paper presented at IATRC Summer symposium “Food Regulation and Trade: Institutional Framework, Concepts of Analysis and Em-pirical Evidence”, Bonn, Germany, 28-30 May.
Nogués, J., A. Olechowski, and L.A. Winters. 1986. “Extend of non-tariff barriers to industrial countries’ imports.” World Bank Economic Review 1(1):181–199.
Organisation for Economic Co-operation and Development. 1995. “Patterns and Pervasiveness of Tariff and Non-Tariff Barriers to Trade in OECD Member Countries.” Working Party No.1 of the Economic Policy Committee Ad Hoc Group of Experts on Indicators of Government Assistance, ECO/CPE/WP1/GE(96)3.
Otsuki, T., J.S. Wilson, and M. Sewadeh. 2001. “What Price Precaution? Euro-pean Harmonisation of Aflatoxin Regulations and African Groundnut Exports.” European Review of Agricultural Economics 28(3):263–283.
Pagan, A. 1984. “Econometric Issues in the Analysis of Regressions with Generated Regressors,” International Economic Review 25: 221–247.
Version preprint
Redding, S., and A.J. Venables. 2004. “Economic geography and international inequality.” Journal of International Economics 62(1):53–82.
Thilmany, D.D., and C.B. Barrett. 1997. “Regulatory Barriers in an Integrating World Food Market.” Review of Agricultural Economics 19(1): 91–107.
Yue, C., J.C. Beghin, and H.H. Jensen. 2006. “Tariff Equivalent of Technical Barriers to Trade with Imperfect Substitution and Trade Costs.” American Journal of Agricultural Economics 88(4):947–960.
Version preprint
Appendix
Source data
Information on non-tariff measures is taken from the source files of TRAINS (Trade Analysis Information System), which can be accessed through WITS (World Bank Integrated Trade Solution). For each HS6 position, measures applied are recorded by importing country, according to a classification developed by the UNCTAD. This clas-sification is firstly presented on the UNCTAD web site (http://www.unctad.org/ Templates/Page.asp?intItemID=2188\&lang=1) and comprises the following cate-gories, besides Tariff measures which are not interesting for us: Para-tariff measures, Price control measures, Finance measures, Automatic licensing measures, Quality Control Measures, Monopolistic measures, Technical measures. For each category of measure, a short general description is provided, followed by the two-digit headings of such measures. In the database, the nomenclature of measures goes up to four digit. This is the level used in this article.
TRAINS is currently disseminated online through WITS. The database comprises 119 countries. The UNCTAD-WITS web site reproduces the explanations available on the UNCTAD site, and provides the three-digit headings at the following ad-dress (http://r0.unctad.org/trains_new/tcm_link.shtm). The two-digit head-ing “Quality control measures” is however correctly renamed “Quantity control mea-sures”. In addition to this three-digit information, additional information is provided regarding the four-digit decomposition used for “sensitive product categories” and for “technical regulations”. The four-digit level permits one to identify the following justi-fications of applied measures: to protect human health; to protect animal health and life; to protect plant health; to protect environment; to protect wildlife; to control drug abuse; to ensure human safety; to ensure national security; and for purposes
Version preprint
not elsewhere specified (n.e.s.). This level of detail authorize us to identify measures justified on environmental purposes.
We have recollected a nomenclature which identifies 115 potential environmental measures (tmic1) out of 210 headings, of which 42 measures (tmic2) are actually enforced by importers in our sample, according to the UNCTAD. This information can be matched with COMTRADE (here BACI) trade data at the HS six-digit level.
How data are collected by the UNCTAD
UNCTAD is using notifications to the WTO, completed by individual countries trade policies surveys by the WTO, as well as a series of national sources, ranging from Custom authorities to specialized publications. The source file lists sources such as “WTO TBT/Notif.93.481, 23.12.93” (notification to the WTO), or “Acuerdo de 29/X/91. Secretaría de Desarrollo Urbano y Ecología” (national source), or “MOCI 1370, 31st December 1998” (specialized publication).
Our source data has been collected by the UNCTAD. The UNCTAD has com-piled various official sources such as notifications to the WTO, individual countries trade policies surveys released by the WTO, and information provided by national Custom authorities. Lastly, specialized publications have been scanned in order to identify measures of interest. How each individual data has been collected is docu-mented in an unpublished file we have had access to. This file lists sources such as “WTO TBT/Notif.93.481, 23.12.93” (corresponding to a notification to the WTO), or “Acuerdo de 29/X/91. Secretaría de Desarrollo Urbano y Ecología” (correspond-ing to a national source), or “MOCI 1370, 31st December 1998” (correspond(correspond-ing to a specialized publication).
Version preprint
Table 1. Distribution of SPS and TBT Measures by Number of Notifying Countries, 2004
Nb. of notifying Nb. of affected Affected Potentially Coverage countries products imports affected imports ratio
(million USD) (million USD) (%)
0 4 0 0.54 0 1 6 0.86 5.75 14.90 [1 − 5] 20 7.46 45.87 16.27 [6 − 10] 13 138.87 1589.20 8.74 [11 − 20] 54 1271.24 6038.98 21.05 [21 − 30] 100 7043.30 25078.05 28.09 [31 − 40] 154 23137.19 72732.10 31.81 [41 − 50] 244 69503.82 163890.00 42.41 [51 − 60] 63 44735.46 77945.55 57.39 [61 − 70] 32 19177.59 30379.79 63.13 [71 − 80] 6 11583.14 14745.06 78.56
Version preprint
Table 2. Comparison between OECD Importers, 2004
Country Coverage Nb. of Country Coverage Nb. of ratio (%) affected ratio (%) affected
products products
EU members Other OECD countries Denmark 18.34 99 Australia 97.07 568
Greece 14.45 94 Mexico 96.27 594
Italy 13.85 111 New Zealand 82.24 526
Sweden 12.66 79 Norway 81.16 486
Poland 12.39 87 United States 58.27 410 Great Britain 12.32 108 Switzerland 48.18 346
Germany 12.02 112 Canada 42.53 380
Netherlands 11.94 104 Iceland 27.42 143
France 11.62 109 Japan 23.52 87
Finland 10.51 79 South Korea 0 0
Ireland 9.91 75 Turkey 0 0 Belgium 9.86 94 Austria 9.44 90 Czech Republic 9.19 77 Portugal 9.18 73 Spain 8.42 102 Slovakia 8.07 67 Hungary 6.57 70 All EU members 11.75 118
Version preprint
Table 3. Most Affected Exporting Countries, 2004
Country Coverage Nb. of affected Country Coverage Nb. of affected
ratio products ratio products
By coverage ratio By nb. of affected products Guinea-Bissau 98.71 3 United States 46.91 663
Bhutan 98.41 21 France 38.43 641
New Caledonia 96.75 60 Germany 48.92 633
Nepal 88.93 130 Netherlands 45.49 612
Belarus 88.54 337 Australia 38.89 610
Afghanistan 86.67 85 China 33.86 607
Bolivia 86.18 173 India 43.19 601
Myanmar 84.53 137 Italy 35.63 590
Cambodia 84.23 78 South Africa 24.55 583
Armenia 79.04 92 Spain 54.05 574
Version preprint
Table 4. Influence of NTBs - General Overview, 2004
Model : (1) (2) (3) (4) (5) (6) (7)
Importers: OECD Countries
ln GDP exporter 0.15a 0.15a (0.01) (0.01) ln GDP importer 0.11a 0.11a (0.01) (0.01) ln distance -0.29a -0.29a -0.68a -0.77a -0.77a -0.77a -0.78a (0.04) (0.04) (0.03) (0.04) (0.04) (0.04) (0.04) common border 0.72b 0.72b 0.94a 0.92a 0.92a 0.92a 0.92a (0.32) (0.32) (0.16) (0.17) (0.17) (0.17) (0.17) common language 0.34a 0.34a 0.13b 0.22a 0.22a 0.22a 0.22a (0.09) (0.09) (0.05) (0.06) (0.06) (0.06) (0.06) colonial links 0.19c 0.19c 0.20a 0.28a 0.27a 0.27a 0.28a (0.10) (0.10) (0.07) (0.08) (0.08) (0.08) (0.08) bil. tariff(imp.-weight.) -0.05b
(0.02)
bil. tariff (ref. gr.) -0.06a -0.06a -0.08a -0.08a -0.08a -0.08a (0.02) (0.01) (0.02) (0.02) (0.02) (0.02)
= 1 if at least 1 SPS -0.15a
or TBT at the HS6 level (0.03)
freq. index of SPS & TBTs -0.21a
(0.03)
AVE of SPS & TBTs -0.06b
(0.03)
Nb. Obs. 90783 90783 90783 68956 68956 68956 68956
Adjusted Goodness of Fit Index 0.699 0.699 0.768 0.785 0.785 0.785 0.785
Note: Dependent variable: ln(imports). Exporters: all countries. Standard errors (importing country-exporting country clustered) in parentheses with a, b and c denoting significance at the
Version preprint
Table 5. Influence of NTBs - Various Samples, 2004
Model : (1) (2) (3) (4)
Importers: OECD Countries EU Countries ln distance -0.78a -0.78a -0.96a -0.96a (0.04) (0.04) (0.12) (0.12) common border 0.92a 0.92a 0.43b 0.43b (0.17) (0.17) (0.17) (0.17) common language 0.22a 0.22a 0.19b 0.19b (0.06) (0.06) (0.09) (0.09) colonial links 0.28a 0.27a 0.35a 0.35a (0.08) (0.08) (0.10) (0.10) bil. tariff -0.08a -0.28a (0.02) (0.06)
bil. tariff × OECD countries -0.14a -0.74a (0.03) (0.09) bil. tariff × DCs & LDCs -0.04b -0.08
(0.02) (0.07) AVE of SPS &TBTs -0.06b -0.26a
(0.03) (0.04)
AVE of SPS &TBTs × OECD countries 0.08 -0.13c
(0.05) (0.07) AVE of SPS &TBTs × DCs & LDCs -0.14a -0.31a (0.03) (0.05)
Nb. Obs. 68956 68956 35980 35980
Adjusted Goodness of Fit Index 0.785 0.785 0.772 0.772
Note: Dependent variable: ln(imports). Exporters: all countries. Standard errors (im-porting country-ex(im-porting country clustered) in parentheses with a,b andc denoting
sig-Version preprint T a b le 6. NTB Co efficien t s fo r Eac h Sector HS2, 20 04 Mo del : (1) (2) (1) (2) HS 01 Liv e ani mal s -0. 02 (0.50 ) 0.3 2 (0. 53) HS1 7 S ugars -0.6 7 a (0.15 ) -0.8 8 a (0.19 ) HS 02 M ea t -0. 40 (0.25 ) -0.76 a (0.27 ) H S18 Co coa -0 .75 a (0.15 ) 0. 52 (0. 44) HS 04 Dairy p ro d ucts, eggs 0 .61 a (0.18 ) 0. 99 a (0.26 ) H S19 Cereal preparation s -0 .46 a (0.09 ) -0.4 9 a (0.12 ) HS 05 Pdu ct s. an ima l o ri gin 0 .82 a (0.30 ) 0. 97 a (0.37 ) H S20 V eget. preparation s -0 .72 a (0.08 ) -1.2 0 a (0.11 ) HS 06 Liv e tr ees , cu t flo w ers -2. 03 a (0.30 ) -1.7 2 a (0.33 ) H S21 Ed ibl e p rep arations 0.51 a (0.07 ) 0. 77 a (0.08 ) HS 07 Edi ble v eget., ro ots 0 .11 (0.08 ) 0.1 1 (0. 08) HS2 2 Bev erag es, spi ri ts -1.1 3 a (0.12 ) -1.2 8 a (0.13 ) HS 08 Edi ble fruit, n uts -0. 12 c (0.06 ) -0.1 9 a (0.07 ) H S23 R es idu es 0.37 (0.2 5) 0. 20 (0 .29) HS 09 Coffee, tea & sp ices 0 .35 a (0.07 ) 0. 44 a (0.08 ) H S24 T ob acco -2 .07 a (0.35 ) -3.1 9 a (0.41 ) HS 10 Cer eal s 1 .80 a (0.27 ) 2. 91 a (0.31 ) H S33 Es sen ti al oil s -0.87 b (0.40 ) -1.5 4 (1. 14) HS 11 M ill ing pro du ct s 0 .24 c (0.14 ) 0. 35 b (0.16 ) H S35 Al bum ino ids 1.7 2 b (0.68 ) 0. 57 (0. 68) HS 12 Oil seed -0. 11 (0.13 ) 0.0 3 (0. 13) HS4 1 Ra w hi des & skins 0. 28 (0 .61) 1.4 6 b (0.69 ) HS 13 Lac, gum s, resin s -1. 90 a (0.19 ) -2.2 9 a (0.20 ) H S43 F urskin s -0 .61 (1. 46) 1. 63 (1 .91) HS 14 V egetabl e p ro d ucts -0. 15 (0.10 ) -0.17 (0. 12) HS5 1 W o ol, an imal h air 1. 26 b (0.57 ) 3. 15 a (0.75 ) HS 15 Ani mal , v eget . fats 0.00 1 (0.13 ) -0.05 (0. 17) HS5 2 Cotton 0. 27 (0 .26) 0.61 (0.7 2) HS 16 M ea t, fish p rep arations 0 .52 (0.36 ) -0.42 (0. 83) HS5 3 V eget. text ile fi b res 0. 02 (0 .58) 0.17 (0.6 6) Not e : S ta n dard erro rs (imp or ting c o u n try -exp or ting cou n try c lu stered) in p ar en the ses wi th a, b and c resp e cti v e ly de noti n g significan ce at the 1%, 5% an d 10% le v els. Sp ec ifi catio n (1) inc lu des imp ort e r a n d sec tor-sp ecific exp ort e r fixed effe cts. Sp e cification (2) in clude s imp or ter an d exp ort e r fixed effec ts.