HAL Id: hal-02384314
https://hal.sorbonne-universite.fr/hal-02384314
Submitted on 28 Nov 2019HAL is a multi-disciplinary open access
archive for the deposit and dissemination of sci-entific research documents, whether they are pub-lished or not. The documents may come from teaching and research institutions in France or abroad, or from public or private research centers.
L’archive ouverte pluridisciplinaire HAL, est destinée au dépôt et à la diffusion de documents scientifiques de niveau recherche, publiés ou non, émanant des établissements d’enseignement et de recherche français ou étrangers, des laboratoires publics ou privés.
31P MAS NMR and DFT study of crystalline phosphate
matrices
Laura Martel, Attila Kovacs, Karin Popa, Damien Bregiroux, Thibault
Charpentier
To cite this version:
Laura Martel, Attila Kovacs, Karin Popa, Damien Bregiroux, Thibault Charpentier. 31P MAS NMR and DFT study of crystalline phosphate matrices. Solid State Nuclear Magnetic Resonance, Elsevier, 2020, 105, pp.101638, 1-9. �10.1016/j.ssnmr.2019.101638�. �hal-02384314�
1
31
P MAS NMR and DFT study of crystalline phosphate matrices
1 2
Laura Martel1*, Attila Kovács1, Karin Popa1, Damien Bregiroux2 and Thibault Charpentier3 3
4
1
European Commission, Joint Research Centre (JRC), Postfach 2340, D-76125 Karlsruhe, Germany.
5
2Sorbonne Université, CNRS, Chimie de la Matière Condensée de Paris, LCMCP, F-75005 Paris, France.
6
3NIMBE, CEA, CNRS, Université Paris-Saclay, CEA Saclay 91191 Gif-sur-Yvette, France.
7 8 *[email protected] 9 10 Abstract 11
We present the study of the phosphorus local environment by using 31P MAS NMR in a 12
series of seven double monophosphates MIIMIV(PO4)2 (MII and MIV being divalent and 13
tetravalent cations, respectively) of yavapaiite and low-yavapaiite type crystal structures. 14
Solid-state and cluster DFT calculations were found to be efficient for predicting the 31P 15
isotropic chemical shift and chemical shift anisotropy. To achieve this performance, however, 16
a proper computational optimisation of the experimental structural data was required. From 17
the three optimisation methods tested, the full optimisation provided the best reference 18
structure for the calculation of the NMR parameters of the studied phosphates. Also, a better 19
prediction of the chemical shifts was possible by using a correction to the GIPAW calculated 20
shielding. 21
22
Keywords: Yavapaiite; phosphates; 31P NMR; DFT calculations; cluster model. 23 24 Graphical abstract 25 26 27
2
1. Introduction
28 29
Crystalline phosphates have aroused a lot of interest in the research community due to 30
their numerous useful properties as ionic conductors1, catalysts and ion exchangers2 or 31
luminescent materials and UV-emitting X-ray phosphors3,4,5,6,7. Most importantly, thanks to 32
their structural and chemical stability, crystalline phosphates such as monazite, apatite or 33
double monophosphates have been considered as matrices for immobilization of nuclear 34
waste.8,9,10,11,12,13,14,15,16,17,18,19,20,21,22 Even though the chemistry of double monophosphates 35
has been studied in detail,23,24 to our knowledge, the phosphorous local environment using 31P 36
solid-state NMR has not yet been probed. The efficiency of NMR in characterising the local 37
environment of various nuclei has been demonstrated previously25,26,27 and can therefore be 38
extended to the titled systems. Our present aim is to analyse the local structure around the P 39
atom in such diamagnetic phosphates via density functional theory (DFT) calculations. This 40
knowledge can serve as basis for the understanding of the more complex NMR shifts of 41
phosphates containing actinide or rare-earth cations. Indeed, as the NMR signals,28,29 are 42
influenced by the paramagnetic interactions,30,31,32 the use of the cluster model can 43
successfully help in the prediction of the paramagnetic shifts as shown in our recent study33 44
on the LaxEu1-xPO4 series in which an LaPO4 cluster was make. This approach was also 45
applied by other authors in lithium batteries and is very promising.34 46
Here, we present the 31P NMR spectra of selected crystalline structures of the type 47
yavapaiite (C2/m)35,36 (BaHf(PO4)2, BaSn(PO4)2, BaGe(PO4)2, BaZr(PO4)2, BaTi(PO4)2 and 48
-SrGe(PO4)2) and low-yapavaiite (C2/c) (CaGe(PO4)237). The computational work was 49
extended to other monophosphates for which experimental data are available in the literature: 50
LaPO4,38,39 AlPO440,41,42, Si5O(PO4)643 and Ge5O(PO4)644. We probe several structure models 51
used as basis for the NMR calculations. Beyond the experimental structure three 52
computationally relaxed solid-state structures and two (molecular) cluster models were 53
tested. We show the optimisation effects on the experimental crystalline structures and how 54
the NMR parameters can be predicted by means of solid-state and molecular quantum 55
chemical codes utilizing density functional theory (DFT). 56 57 58 2. Methods 59 2.1. Synthesis 60
3 The investigated MIIMIV(PO4)2 compounds were obtained by solid-state reactions by 61
mixing stoichiometric amounts of MII- oxides or carbonates (Prolabo, Aldrich or Johnson 62
Mattey) with MIVO2 and NH4H2PO4/(NH4)2HPO4. The powders were grounded and fired 63
slowly. More details about the process are presented in Refs. 18, 23, 37, 45, 46, 47. All these 64
crystalline phases23 were checked by powder XRD and determined to be single-phased except 65
for CaGe(PO4)2 in which the presence of CaGe4(PO4)6 and Ca2P2O7 were revealed by X-ray 66
diffraction as small impurities (~4%). 67
68
2.2. NMR measurements
69
All 31P NMR spectra (MAS and static) were collected at a Larmor frequency of 162.06 70
MHz (magnetic field 9.4 T) on a Bruker Avance III WB spectrometer using a Bruker 4mm 71
MAS probe. Powder samples were spun at slow spinning rates of 2, 3 and 5 kHz in order to 72
obtain the spinning sidebands pattern to extract the chemical shift anisotropy (CSA) 73
parameters. Spectra were acquired using a 90° pulse of 7.8 s in length (radiofrequency field 74
of 32 kHz). The recycle delays used to have the full recovery of the magnetization were: 200 75
s for BaHf(PO4)2 and BaSn(PO4)2, 1000 s for BaZr(PO4)2, 1500 s for BaTi(PO4)2, 2200 s 76
CaGe(PO4)2, 3000 s for BaGe(PO4)2 and -SrGe(PO4)2. The spectra were referenced with 77
respect to an external sample of liquid H3PO4 (0 ppm). The data were fitted using the DMfit 78
software48 and the CSA parameters were extracted using the "CSA MAS model". 79
80
2.3. Solid-state DFT calculations
81
Solid-state first-principles calculations of the NMR parameters were performed using the 82
Quantum Espresso (QE)49 package which relies on a pseudopotential plane-wave expansion 83
formalism of DFT. The 31P NMR parameters were computed using the gauge including 84
projector augmented wave approach (GIPAW)50,51 formalisms and the generalized gradient 85
approximation (GGA) PBE functional52. Core electrons were described by norm-conserving 86
Trouiller−Martins pseudopotentials53 available in the QE library (Al, Ba, Ge, Hf, La, O, P, Si, 87
Sn, Sr, Zr)54, or downloaded from Davide Ceresoli's website55(Ca) or generated with the 88
atomic code56 (Hf, Ti, Zr) (Table S1). For all calculations with QE, an optimized kinetic 89
energy cutoff of 100 Ry and optimized Monkhorst–Pack grids given in Table S2 were 90
selected. The data for BaSn(PO4)2 are given as an example in Table S3. 91
The calculated magnetic shielding parameters and iso are defined by the Haeberlen
92
convention57,58,59 |𝜎33− 𝜎𝑖𝑠𝑜| > |𝜎11− 𝜎𝑖𝑠𝑜| > |𝜎22− 𝜎𝑖𝑠𝑜| with 𝜎𝑖𝑠𝑜 = 1
3(𝜎11+ 𝜎22+ 𝜎33). 93
4 The axiality of the CSA tensor is defined by Δ𝐶𝑆𝐴 = 𝜎33− 𝜎𝑖𝑠𝑜 and its asymmetry by 94
𝜂𝐶𝑆𝐴 =𝜎𝜎22−𝜎11
33−𝜎𝑖𝑠𝑜. The same convention was followed to extract the ii parameters (i.e.
95 Δ𝐶𝑆𝐴 = 𝛿33− 𝛿𝑖𝑠𝑜 and 𝜂𝐶𝑆𝐴 = 𝛿𝛿22−𝛿11 33−𝛿𝑖𝑠𝑜.). 96 97 2.4. Cluster DFT calculations 98
The 31P magnetic shieldings of the target compounds were calculated by means of the 99
cluster approach using the Gaussian 09 (G09) software60. The model structures (to be 100
discussed later) were subjected to partial geometry optimisations in which the hydrogen 101
atoms were relaxed while the heavy-atom core of the clusters was kept fix. We note that a full 102
optimisation (governed by the hydrogen bonding interactions between close lying OH 103
groups) would destroy the crystal character of the model. For these partial geometry 104
optimisations valence double-zeta basis sets were used: the standard 6-31G** for the light P, 105
O, H, Al, Ca, Si, Ge, Ti atoms, and the relativistic effective core potentials of Hay and Wadt 106
(LANL2DZ): Sr, Ba, Sn,61 and La, Zr, Hf62for the heavier metals. 107
All calculations were performed using the B3LYP63,64 exchange-correlation functional 108
and the PBE functional52. Dunning's correlation-consistent cc-pVTZ basis sets were utilised 109
for the light atoms O, H;65 Al, Si, P;66 Ca;67 Ge;68 Ti69. For the heavier metals, the following 110
small-core quasi-relativistic pseudopotentials and contracted valence basis sets of the 111
Stuttgart group were used:70,71 Sr, ECP28MWB with 6s6p5d/4s4p2d;72 Ba, ECP46MWB 112
with 6s6p5d1f/4s4p2d;70 Sn, ECP28MDF with 12s11p9d1f/5s4p3d1f;73,74 Zr, ECP28MDF 113
with 41s37s25d2f1g/5s5p4d2f1g;75 Hf, ECP60MDF with 41s37s25d2f1g/5s5p4d2f1g76 114
contraction schemes and La, ECP28MWB (the number meaning the core electrons replaced 115
by the potential) with a 14s13p10d8f6g/10s8p5d4f3g contraction scheme. NMR calculations 116
on the cluster structures were carried out using in conjunction with the pseudopotentials and 117
basis sets applied in the B3LYP cluster calculations. The magnetic shieldings were calculated 118
with the Gauge-Independent Atomic Orbital (GIAO) formalism.77 119
120
3. Results and discussions
121
3.1. Crystalline structures of the MIIMIV(PO4)2 phases
122 123
5 124
Figure 1: Crystalline structure of a) the yavapaiites and b) the low-yavapaiites. The MIV 125
cations have an octahedral coordination for the two structures. 126
In Figure 1 the two crystalline structures of the MIIMIV(PO4)2 are presented. The 127
yavapaiite crystalline structures the MIV cations have an octahedral coordination and are 128
corner-linked to six separate phosphate tetrahedra through the oxygen atoms, forming two 129
different sheets. In between these sheets, a layer of 10-coordinated MII cations is located, 130
being also linked to the PO4 units.78 The low-yavapaiite structure can be described as a 131
distorted yavapaiite with a double lattice along the a-axis. Compared to the yavapaiite, the 132
tetravalent cations remain in an octahedral environment, whereas the 10-coordination of the 133
divalent cations decreases to eight (capped with 2 additional oxygen atoms).23 134
135
3.2. 31P NMR spectra
136 137
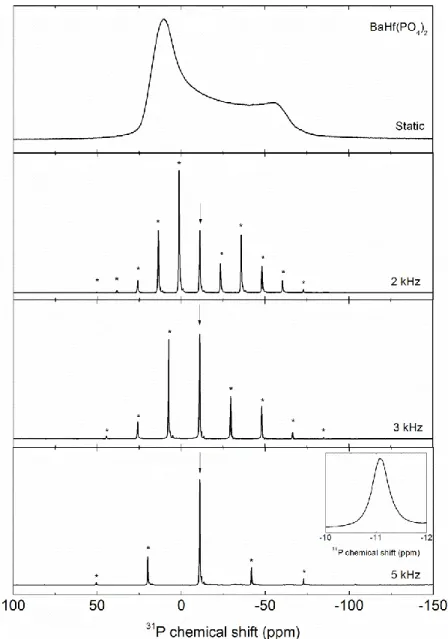
6 138
Figure 2: 31P spectra of BaHf(PO4)2 acquired in static conditions and at different spinning 139
rates. The arrow indicates the isotropic band while the stars stand for the spinning sidebands. 140
The insert presents the central peak. 141
142
For all samples, the 31P MAS NMR spectra were acquired in static conditions and at 143
three spinning rates (2, 3 and 5 kHz). As similar data were obtained for all samples, only the 144
BaHf(PO4)2 spectra are given in Figure 2 as example to show the spinning rate effects. 145
Additionally, in Figure S1, the spectra of all the other MIIMIV(PO4)2 compounds are depicted 146
at the spinning rates of 5 and 2 kHz. 147
The static spectrum presents a typical CSA dominated powder pattern, and combined 148
with slow MAS rates it has been possible to identify the isotropic bands and extract the CSA 149
parameters. The observation of a single isotropic band for each compound is in agreement 150
with the single P site expected from these crystalline structures. All the NMR parameters 151
7 (iso, ii) extracted from the spectra are gathered in Table 1. Small differences were found
152
between static and MAS values of the CSA most probably due to 31P-31P coupling. These 153
differences were accounted in the uncertainties. 154
155
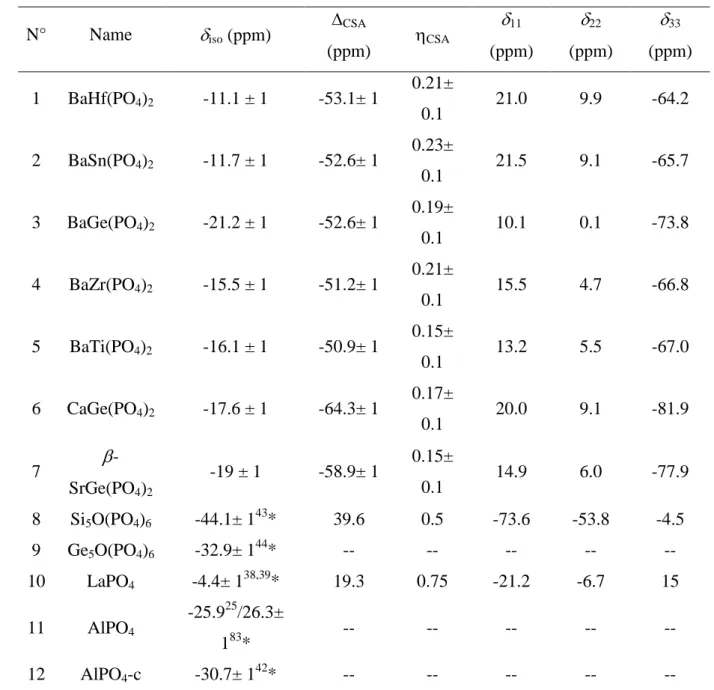
Table 1: The experimental 31P isotropic chemical shifts, iso, and the anisotropic parameters
156
(11, 22, 33, CSA, CSA) of the crystalline phosphates. Each compound was attributed a 157
random number (N°) with which it will be labelled with. Data for compounds 1-7 were 158
obtained in the present study while for compounds 8-12 they were extracted from the 159
literature indicated by the references. 160 N° Name iso (ppm) CSA (ppm) CSA 11 (ppm) 22 (ppm) 33 (ppm) 1 BaHf(PO4)2 -11.1 ± 1 -53.1± 1 0.21± 0.1 21.0 9.9 -64.2 2 BaSn(PO4)2 -11.7 ± 1 -52.6± 1 0.23± 0.1 21.5 9.1 -65.7 3 BaGe(PO4)2 -21.2 ± 1 -52.6± 1 0.19± 0.1 10.1 0.1 -73.8 4 BaZr(PO4)2 -15.5 ± 1 -51.2± 1 0.21± 0.1 15.5 4.7 -66.8 5 BaTi(PO4)2 -16.1 ± 1 -50.9± 1 0.15± 0.1 13.2 5.5 -67.0 6 CaGe(PO4)2 -17.6 ± 1 -64.3± 1 0.17± 0.1 20.0 9.1 -81.9 7 -SrGe(PO4)2 -19 ± 1 -58.9± 1 0.15± 0.1 14.9 6.0 -77.9 8 Si5O(PO4)6 -44.1± 143* 39.6 0.5 -73.6 -53.8 -4.5 9 Ge5O(PO4)6 -32.9± 144* -- -- -- -- -- 10 LaPO4 -4.4± 138,39* 19.3 0.75 -21.2 -6.7 15 11 AlPO4 -25.9 25 /26.3± 183* -- -- -- -- -- 12 AlPO4-c -30.7± 142* -- -- -- -- --
*the uncertainties are not given in the following papers, but deduced from the spectra. 161
8 163
3.3. Effect of DFT optimisation on the crystalline structures
164
Computed parameters often suffer from experimental errors intrinsically as the 165
experimental crystalline structures are more representative of a thermal average than the true 166
local environment.51,89 To overcome this drawback, the optimisation of the atomic positions 167
and/or the unit cell parameters is often done. To render these effects the different 168
optimisation procedures are discussed in the following paragraph. Additionally, due to the 169
small range of the 31P iso values (~10 ppm) in this phosphate series, we also considered the
170
chemical shifts (Table 1) of previously published crystalline compounds (denoted thereafter 171
as M'PO4 as they possess only one metal cation, M') which, conveniently, have a single 172
crystallographic P site: Ge5O(PO4)644 (R-3 H79), Si5O(PO4)643,80 (R -3 H81), AlPO442 (P 31 2 173
182), AlPO442 (C 2 2 2183) and LaPO438, 39 (P 1 2 1/a 184). This approach is similar to the work 174
done by several other authors85,86 as it gives an overview over a broader range of chemical 175
shifts. 176
In the present study three different optimisation approaches have been used: i) the 177
atomic position optimisation (APO) in which only the atom positions are relaxed, ii) the full 178
optimisation (FO) in which both the atom positions and cell parameters are relaxed and iii) 179
full optimisation followed by scaling of the obtained structure back to the original 180
experimental cell parameters (FOS). This last approach can be particularly advantageous in 181
the case of the PBE GGA functional, which is known to lead to an increase of the cell 182
dimension (by typically few %) and therefore a rescaling sometimes improves the iso.87,88
183
In the assessment of the optimisation effects and how it will later influence the 184
computed shielding, we considered three averaged structural parameters: i) the phosphorus-185
oxygen bond distance (<rP-O>), ii) the metal-oxygen bond distance (<rM-O>, M = M', MII, 186
MIV) and, iii) the metal-oxygen-phosphorus bond angle (<M-O-P>, M = M', MII, MIV). To 187
compare the optimized (Opt) values with those of the experimental structure (ES) we 188
considered the following classical statistics: 189 Δ<𝑟𝑃−𝑂> <𝑟𝑃−𝑂>𝐸𝑆 = <𝑟𝑃−𝑂>𝑂𝑝𝑡−<𝑟𝑃−𝑂>𝐸𝑆 <𝑟𝑃−𝑂>𝐸𝑆 ∗ 100 (1) 190 Δ <rM−O> <rM−O>𝐸𝑆= <rM−O>𝑂𝑝𝑡−<rM−O>𝐸𝑆 <rM−O>𝐸𝑆 ∗ 100 (2) 191 Δ <θM−O−P> <θM−O−P>𝐸𝑆= <θM−O−P>𝑂𝑝𝑡−<θM−O−P>𝐸𝑆 <θM−O−P>𝐸𝑆 ∗ 100 (3) 192
where Opt = APO, FO, FOS and M = M', MII, MIV. 193
9 The results from Equation 1 are presented in Figure S2. The <rP-O> data of 194
BaHf(PO4)2 and Si5O(PO4)6 are mostly influenced by structure optimisation with deviation 195
from the ES values of ~6%. It is interesting to note that the optimisation effects with the FO 196
and APO approaches lead to quite similar <rP-O> values. In Figure S3, the optimisation 197
effects on the average metal-oxygen distances <rMII-O>, <rMIV-O> and <rM'-O> are depicted as 198
obtained using Equation 2. With ~4%, <rMIV-O> for BaGe(PO4)2 and <rM'-O> for Ge5O(PO4)6 199
represent the largest differences compared to the ES values. Finally, Figure S4 shows the 200
optimisation effects on the bond angles (Equation 3). The largest deviations from the ES 201
values are again observed for BaHf(PO4)2 independent from the optimisation approach used. 202
This analysis underlines errors more specifically in the experimental structural data of 203
BaHf(PO4)2. 204
205
3.4. Calculation of chemical shieldings 206
3.4.1. The periodic calculations
207 208
10 Figure 3: Plot of the experimental 31P iso against the calculated 31P iso obtained from
210
periodic calculations. "excl." means excluding extremely deviating iso data (see text). For the 211
compound numbers see Table 1. 212
213
In Figure 3, the experimental iso are plotted against the theoretical iso data. The
214
corresponding values are given in Table S4. As the two parameters are related through the 215
relation51, iso ref aiso (with a being the slope and ref the "reference" shielding from
216
the fittings), the data can be fitted using a linear equation. Among the iso values based on the
217
ES structures a few large deviations can be observed from the regression line fitted to all the 218
data. The largest iso deviations belong to BaHf(PO4)2 and AlPO4-c. Indeed, after removing 219
these values from the fit, an improvement of the linear relationship measured by the adjusted 220
R-squared (Adj-R2) was obtained as it increased from 0.50 to 0.90. The former very poor Adj-221
R2 reflects the deficiencies of the ES parameters as already discussed by other authors.51,89 222
The above situation can be improved by quantum chemical geometry optimisation which can 223
(partly) correct the experimental errors.51 There are a few optimisation procedures for that 224
purpose. In the present study we probed three procedures (APO, FO and FOS), introduced in 225
section 3.3. For the iso data determined using the optimized crystalline structures we
226
obtained a considerable improvement of the correlations between the iso and the iso values
227
(Figure 3), particularly on the basis of the APO and FO structures (Adj-R2 equal to 0.90 and 228
0.94 respectively). BaHf(PO4)2 and AlPO4-c present now isotropic shieldings more in line 229
with the others. These better correlations can indeed be traced back to the improved structural 230
parameters of the APO and FO structures with respect to ES (Figure S2-Figure S4). BaHfPO4 231
is the most demonstrative example, as here large changes occurred in all structural parameters 232
upon optimisation compared to the ES. 233
Contrary to the two above used procedures, the FOS method does not seem to 234
improve significantly the general correlation compared to ES (Adj-R2=0.66 vs Adj-R2=0.50). 235
This is mostly due to the iso values of BaTi(PO4)2 and BaSn(PO4)2 which deviate 236
considerably from the fitted line. Removing their iso values from the plot lead to an increase
237
of Adj-R2 from 0.66 to 0.97. For BaTi(PO4)2, it is the <MIV-OP> parameter which seems to be 238
too underestimated. After FO, the unit-cell parameters of BaTi(PO4)2 decreases from 1115.4 239
to 1056.4 a.u.3 contrary to the other unit cells which are increasing. Therefore, rescaling the 240
optimized cell parameters to the original experimental ones worsened considerably the 241
11 achievements of the FOS. For BaSn(PO4)2, we believe that, the error of FOS might be the 242
result of the optimisation headed towards a different local minimum. 243
It is also noteworthy that both a and ref vary slightly, depending on the type of
244
structure used to calculate iso. This is the consequence of the shielding being sensitive to
245
small changes in structural parameters. In fact, Vasconcelos et al.85 have already reported 246
such behaviour in phosphate based materials underlining the difficulty to choose a uniform 247
ref. Also, while the ideal slope must be -1, nuclear quantum effects, incomplete basis sets,
248
and other systematic errors in the DFT calculations can lead to deviations from this ideal 249
value.90 250
251
3.4.2. Small clusters approach
252
253
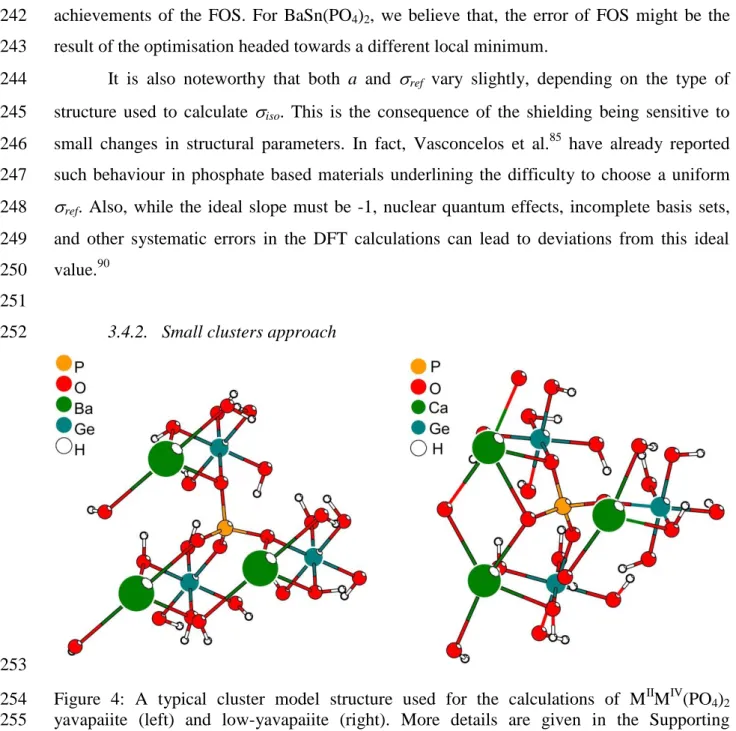
Figure 4: A typical cluster model structure used for the calculations of MIIMIV(PO4)2 254
yavapaiite (left) and low-yavapaiite (right). More details are given in the Supporting 255
Information. 256
As examples for our cluster models for the yavapaiite and low-yavapaiite structures, 257
the clusters for BaGe(PO4)2 and CaGe(PO4)2, respectively, are shown in Figure 4. The cores 258
of the clusters consist of atoms, up to the third coordination shell (PO4, metals, oxygens), 259
taken from the ES and FO structures. The choice for FO from the three solid-state optimized 260
structure types is reasoned by the found best linear correlation between iso and iso. The
261
hydrogen atoms were added to the terminal oxygen atoms in order to compensate for the very 262
large negative charges of the core structures. The final charges of our clusters were -5 e 263
except for Al and La with charges of -3 e. The strain due to the manually added hydrogens 264
was removed by partial geometry optimisations, in which the hydrogen atoms were subjected 265
12 to geometry optimisation while the core of the cluster was kept fixed. Test calculations by 266
varying the hydrogen bonding pattern around the fixed cores revealed only a slight influence 267
(up to 2 ppm) on the calculated 13P shieldings. The present reported cluster sizes were most 268
suitable for the description of the NMR properties of the target compounds as reducing them 269
to the second coordination shell resulted in unreliable chemical shieldings while expanding 270
them led to serious SCF convergence problems. The exact compositions and pictures of the 271
clusters together with the Cartesian coordinates of the final structures are given in the 272
Supplementary Information. 273
274
275
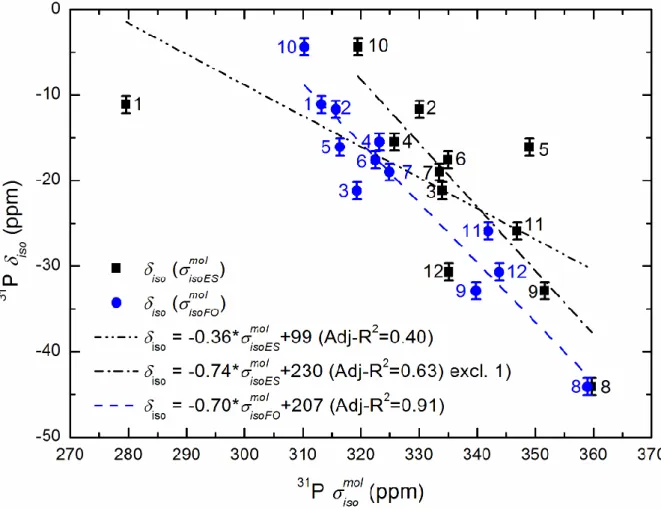
Figure 5: Plot of the experimental 31P iso against the calculated 31P 𝜎𝑖𝑠𝑜𝑚𝑜𝑙 obtained based on 276
the cluster models. For the compound numbers see Table 1. 277
278
In Figure 5 the experimentaliso values are plotted against the theoretical shielding (𝜎𝑖𝑠𝑜𝑚𝑜𝑙) 279
obtained from our cluster models. 280
The corresponding values are given in Table S5. Similarly to the solid-state calculations, 281
the iso vs 𝜎𝑖𝑠𝑜𝐸𝑆𝑚𝑜𝑙 have a poor correlation due mainly to the above shown error in the 282
13 experimental structural data of BaHf(PO4)2. The correlation is thus improved from Adj-R2 = 283
0.40 to 0.63 after omitting its chemical shielding. Using the clusters based on the FO 284
structures, the 𝜎𝑖𝑠𝑜𝐹𝑂𝑚𝑜𝑙 data correlate now well with iso with an Adj.-R2 equal to 0.84. This
285
result reflects the efficiency of using small molecular cluster models to represent the solid-286
state, as already shown by some authors in other phosphate series85,91. 287
To go beyond these two classical approaches (i.e. periodic and cluster) and to capture the 288
full periodic nature of the crystal while also obtaining the higher accuracy associated with 289
computational models, we applied the new method recently suggested by Dračínský et al.92. It 290
consists in correcting the GIPAW calculated shieldings (corr) by considering the difference
291
between the shielding calculated with the B3LYP and the PBE functionals employed in the 292
GIPAW calculation. For our study, we considered the FO structure and applied the following 293 equation: 294 𝜎𝑐𝑜𝑟𝑟= 𝜎𝑐𝑟𝑦𝑠𝑡𝐺𝐼𝑃𝐴𝑊− 𝜎 𝑚𝑜𝑙𝑃𝐵𝐸+ 𝜎𝑚𝑜𝑙𝐵3𝐿𝑌𝑃 (4) 295
with 𝜎𝑐𝑟𝑦𝑠𝑡𝐺𝐼𝑃𝐴𝑊 corresponding to the 𝜎𝑖𝑠𝑜𝐹𝑂 obtained using the GGA-based GIPAW method 296
and; 𝜎𝑚𝑜𝑙𝑃𝐵𝐸 and 𝜎𝑚𝑜𝑙𝐵3𝐿𝑌𝑃 corresponding to the 𝜎𝑖𝑠𝑜𝐹𝑂𝑚𝑜𝑙 obtained based on the clusters using the 297
PBE (same GGA as the GIPAW calculation) and B3LYP (hybrid) functionals. 298
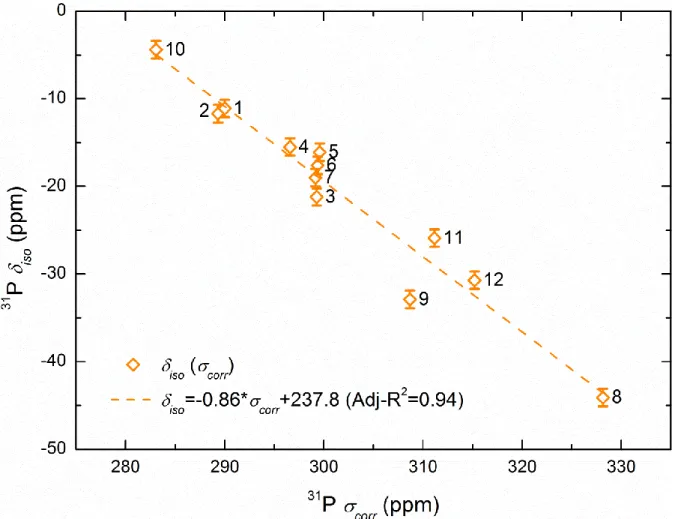
14 300
Figure 6: Plot of the experimental 31P iso against the calculated 31P corr obtained based on
301
equation 4. For the compound numbers see Table 1. 302
In Figure 6, we plotted the experimentaliso values against the corrected shielding.
303
The first observation is an increase of the linear slope from -0.83 to -0.86 which is positively 304
getting closer to the ideal value of -1. In Table 2, we determined the theoretical iso values
305
based on the GIPAW and Dračínský approaches. This allows to easily compare them with the 306
experimental values. The lowest mean absolute error (MAE) is obtained for the corrected 307
shielding values confirming again that this method does lead to data improvements. The 308
maximal absolute error for corr of 6 ppm is obtained for Ge5O(PO4)6. Nonetheless, this value
309
also corresponds to an improvement from the non-corrected shielding (decrease of about 2 310
ppm). It is worth mentioning that this theoretical iso is not well represented independently of
311
the type of calculations approach or optimization considered. This might imply a larger error 312
of the iso value. It is also interesting to notice that the shielding of BaHf(PO4)2 is specifically 313
improved with this correction most probably implying the problems in GGA-PBE in addition 314
to the structural parameter errors previously discussed. 315
Table 2: Theoretical iso in ppm with 𝛿𝑐𝑟𝑦𝑠𝑡𝐺𝐼𝑃𝐴𝑊= −0.83 ∗ 𝜎𝑐𝑟𝑦𝑠𝑡𝐺𝐼𝑃𝐴𝑊+ 229.7 and 𝛿𝑐𝑜𝑟𝑟 = 316
−0.86 ∗ 𝜎𝑐𝑜𝑟𝑟+ 237.8. The MAE and maximal absolute errors (ppm) are also given. 317
15 1 BaHf(PO4)2 -16.8 -10.9 2 BaSn(PO4)2 -11.5 -10.3 3 BaGe(PO4)2 -17.8 -18.9 4 BaZr(PO4)2 -15.0 -16.6 5 BaTi(PO4)2 -17.8 -19.1 6 CaGe(PO4)2 -16.6 -18.9 7 -SrGe(PO4)2 -18.1 -18.8 8 Si5O(PO4)6 -45.0 -43.6 9 Ge5O(PO4)6 -41.0 -26.9 10 LaPO4 -5.2 -5.0 11 AlPO4 -27.6 -29.0 12 AlPO4-c -30.3 -32.5 MAE 2.1 1.8
Max. Abs. Err. 8.1 6.0 318
3.4.3. Chemical shift shieldings
319 320
321
Figure 7: Plot of the experimental ii against the calculated ii values and their corresponding
322
fits (dashed lines). 323
16 The ii values correspond to the eigenvalues of the chemical shielding tensor which is
325
a 3 x 3 matrix in the laboratory frame93,94: 326 𝝈𝑙𝑎𝑏 = ( 𝜎𝑥𝑥 𝜎𝑥𝑦 𝜎𝑥𝑧 𝜎𝑦𝑥 𝜎𝑦𝑦 𝜎𝑦𝑧 𝜎𝑧𝑥 𝜎𝑧𝑦 𝜎𝑧𝑧 )
The chemical shielding tensor and the associated ii values are given as part of the QE
327
output file. We noticed that contrary to the good results on iso vs iso, the ii from the output
328
files gave a poorer linear correlation with the ii as shown in Figure S5. We checked the
329
eigenvalues by recalculating them with the Mathematica software® and the results are shown 330
in Figure 7. One can notice that a much better overall correlation is now obtained with Adj-331
R2 coefficient improved from 0.25 to 0.83 for the ES, 0.92 to 0.99 for the APO, 0.93 to 0.98 332
for the FO and, 0.87 to 0.93 for the FOS. These differences suggest an erroneous 333
determination of the eigenvalues in the QE code. We also show here that both slope and ref
334
are dependent upon the type of optimisation. 335
In the literature, while most review papers51,43 suggest to plot ii vs ii, as done in the
336
present work, some authors prefer the ii vs ii representation as a slope of -1 is most easily
337
obtained. We therefore gave in Table 3 the values of the linear relations ii= iiref +b*ii in
338
order to compare with the published data. Holmes et al.91 found a linear correlation of ii=
-339
1.09*ii+ for a set of 57 compounds and our results are in line with their observations.
340 341
Table 3: Linear fit considering ii= iiref +b*ii.
342 Opt. b iiref R 2 ES -1.1 280.1 0.83 ES excl. 1 -1.0 286.2 0.97 APO -1.03 279.6 0.99 FO -1.03 278.4 0.98 FOS -0.99 288.4 0.93 FOS excl. 5 -0.98 291.5 0.97 343 344 4. Conclusion 345
We studied here the local P environment in a series of crystalline phosphates by combing 346
31
P NMR with periodic and small cluster DFT calculations. All the 31P spectra acquired 347
17 possess a good resolution with a clear identification of a single P signal in agreement with 348
their crystallographic structures. Using the GIPAW approach, optimisations of the crystalline 349
structure parameters using three types approaches (APO, FO and FOS) led to an overall 350
improvement of the calculated NMR parameters, especially for BaHf(PO4)2. Good linear 351
correlations, iso vs iso, were achieved with both APO (Adj-R2=0.90) and FO (Adj-R2=0.94)
352
structures, with a preference on the latest optimisation approach. Using the ES and FO 353
structures, small cluster models were constructed. The isotropic chemical shielding (𝜎𝑖𝑠𝑜𝑚𝑜𝑙) 354
extracted presented a good correlation with the isotropic chemical shifts. This underlines the 355
efficiency of such clusters and its eventual use as substitute to model the infinite crystal 356
especially in the case of paramagnetic systems. Nonetheless, a better improvement of the 357
theoretical isotropic chemical shift was achieved by combining the advantages of both plane-358
wave and molecular computational approaches (MAE decreasing from 2.1 to 1.8). For the 359
CSA parameters, good linear correlations were also obtained between the ii and the ii data 360
determined on the basis of the APO (Adj-R2=0.99) and FO (Adj-R2=0.98) relaxed structures, 361
with this time slightly better results with the first optimisation approach. The present paper 362
show a first step in the NMR study of MIIMIV(PO4)2 compounds using periodic and cluster 363
calculations with an extension to any phosphates. 364
18
References
366
1 E. Morin, G. Wallez, S. Jaulmes, J. C. Couturier, M. Quarton, J. Solid State Chem. 137 (1998) 283–288, https://doi.org/10.1006/jssc.1997.7735.
2 K. Fukuda, A. Moriyama, T. Iwata, J. Solid State Chem. 178 (2005) 2144–2151, https://doi.org/10.1016/j.jssc.2005.04.022.
3 G. Blasse, G. J. Dirksen, Chem. Phys. Lett. 62 (1979) 19-20, https://doi.org/10.1016/0009-2614(79)80403-0.
4 C. R. Miao, C. C. Torardi, J. Solid State Chem. 155 (2000) 229-232, https://doi.org/10.1006/jssc.2000.8938.
5 Z. J. Zhang, J. L. Yuan, X. J. Wang, D. B. Xiong, H. H. Chen, J. T. Zhao, Y. B. Fu, Z. M. Qi, G. B. Zhang, C. S. Shi, J. Phys. D: Appl. Phys. 40 (2007) 1910–1914, https://doi.org/10.1088/0022-3727/40/7/012.
6 B. Yan, J. Gu, X. Xiao, J. Nanopart. Res. 12 (2010) 2145–2152, https://doi.org/10.1007/s11051-009-9776-x.
7 X. Xiao, B. Yan, J. Amer. Ceram. Soc. 93 (2010) 2195–2201, https://doi.org/10.1111/j.1551-2916.2010.03716.x.
8 R. R Parrish, Canadian Journal of Earth Science 27 (1990) 1431–1450, https://doi.org/10.1139/e90-152.
9 J.-M. Montel, S. Foret, M. Veschambre, C. Nicollet, A. Provost, Chemical Geology 131 (1996) 37-53, https://doi.org/10.1016/0009-2541(96)00024-1.
10 V. Brandel, N. Dacheux, E. Pichot, M. Genet, J. Emery, J. Y. Buzare, R. Podor, Chem.
Mater. 10 (1998) 345–350, https://doi.org/10.1021/cm970513d.
11 O. Terra, N. Dacheux, F. Audubert, R. Podor, J. Nuc. Mater. 352 (2006) 224-232, https://doi.org/10.1016/j.jnucmat.2006.02.058.
12 O. Terra, N. Clavier, N. Dacheux, R. Podor, New J. Chem. 27 (2003) 957-967, https://doi.org/10.1039/B212805P.
13 D. M. Bykov, A. I. Orlova, S. V. Tomilin, A. A. Lizin, A. N. Lukinykh, Radiochemistry 48 (2006) 234–239, https://doi.org/10.1134/S1066362206030052.
14 D. Bregiroux, O. Terra, F. Audubert, N. Dacheux, V. Serin, R. Podor, D. Bernache-Assollant, Inorg. Chem. 46 (2007) 10372-10382, https://doi.org/10.1021/ic7012123.
15 P. Sengupta, J. Hazard. Mater. 235-236 (2012) 17-28, https://doi.org/10.1016/j.jhazmat.2012.07.039.
16 I. W. Donald, B. L. Metcalfe, R. N. J. Taylor, J. Mater. Sci. 32 (1997) 5851-5887, https://doi.org/10.1023/A:1018646507438.
17 W. E. Lee, M. I. Ojovan, M. C. Stennett, N. C. Hyatt, Adv. Appl. Ceram. 105 (2006) 3-12, https://doi.org/10.1179/174367606X81669.
18 K. Popa, D. Bregiroux, R. J. M. Konings, A. F. Popa, T. Gouder, T. Geisler, P. E. Raison,
J. Solid State Chem. 180 (2007) 2346–2355, https://doi.org/10.1016/j.jssc.2007.06.006.
19 S. Neumeier, Y. Arinicheva, Y. Ji, J. M. Heuser, P. M. Kowalski, P. Kegler, H. Schlenz, D. Bosbach, G. Deissmann, Radiochim. Acta 105 (2017) 961-984, https://doi.org/10.1515/ract-2017-2819.
20 K. Popa, R. J. M. Konings, T. Wiss, H. Leiste, J. Radioanal. Nucl. Chem. 273 (2007) 563-567, https://doi.org/10.1007/s10967-007-0910-x.
21 K. Popa, T. Shvareva, L. Mazeina, E. Colineau, F. Wastin, R.J.M. Konings, A. Navrotsky, Am. Mineral. 93 (2008) 1356-1362,https://doi.org/10.2138/am.2008.2794
22 Y. Arinicheva, K. Popa, A.C. Scheinost, A. Rossberg, O. Dieste Blanco, P.E. Raison, A. Cambriani, J. Somers, D. Bosbach, S. Neumeier, J. Nucl. Mater., 493 (2017) 404-411, https://doi.org/10.1016/j.jnucmat.2017.06.034.
19 23 D. Bregiroux, K. Popa, G.Wallez, J. Solid State Chem. 230 (2015) 26-33, https://doi.org/10.1016/j.jssc.2015.06.010.
24 D. Bregiroux, G. Wallez, K. Popa, Solid State Sci. 41 (2015) 43-47, http://dx.doi.org/10.1016/j.solidstatesciences.2015.02.004.
25 A. K. Cheetham, N. J. Clayden, C. M. Dobson, R. J. B. Jakeman, J. Chem. Soc., Chem.
Commun., 1986, 195-197, https://doi.org/10.1039/C39860000195.
26 I. D. Brown, R. D Shannon, Acta Cryst. A29 (1973) 266-282, https://doi.org/10.1107/S0567739473000689.
27 A. C. Palke, J. F. Stebbins, Am. Miner. 96 (2011) 343-353, https://doi.org/10.2138/am.2011.3816.
28 A. C. Palke, J. F. Stebbins, L. A. Boatner, Inorg. Chem. 52 (2013) 12605-12615, https://doi.org/10.1021/ic401757z.
29 L. Martel, J.-F. Vigier, D. Prieur, S. Nourry, A. Guiot, K. Dardenne, J. Boshoven, J. Somers, J. Phys. Chem. C 118 (2014) 27640−27647, https://doi.org/10.1021/jp507088t. 30 F. Gendron, K. Sharkas, J. Autschbach, J. Phys. Chem. Lett. 6 (2015) 2183−2188, https://doi.org/10.1021/acs.jpclett.5b00932.
31 F. Gendron, B. Pritchard, H. Bolvin, J. Autschbach, Inorg. Chem. 53 (2014) 8577–8592, https://doi.org/10.1021/ic501168a.
32 D. E. Smiles, G. Wu, P. Hrobárik, T. W. Hayton, J. Am. Chem. Soc. 138 (2016) 814−825, https://doi.org/10.1021/jacs.5b07767.
33 L. Martel , A. Rakhmatullin, J. J. Baldoví, M. Perfetti, K. Popa, M. Deschamps, T. Gouder, E.Colineau, A. Kovács, J.-C. Griveau, Phys. Rev. B 100 (2019) 054412, https://doi.org/10.1103/PhysRevB.100.054412.
34 A. Mondal, M. W. Gaultois, A. J. Pell, M. Iannuzzi, C. P. Grey, J. Hutter, M. Kaupp, J.
Chem. Theory Comput., 14 (2018) 377−394.
35 E. J. Graeber, A. Rosenzweig, Am. Miner. 56 (1971) 1917–1933. 36 J. W. Anthony, W. J. McLean, Am. Miner. 57 (1972) 1546–1549.
37 K. Popa, G. Wallez, D. Bregiroux, P. Loiseau, J. Solid State Chem. 184 (2011) 2629-2634, https://doi.org/10.1016/j.jssc.2011.07.037.
38 D. Bregiroux, F. Audubert, T. Charpentier, D. Sakellariou, D. Bernache-Assollant, Solid
State Sci. 9 (2007) 432-439, https://doi.org/10.1016/j.solidstatesciences.2007.03.019.
39 K. Popa, P. E. Raison, L. Martel, P. M. Martin, D. Prieur, P. L. Solari, D. Bouëxière, R. J. M. Konings, J. Somers, J. Solid State Chem. 230 (2015) 169-174, https://doi.org/10.1016/j.jssc.2015.07.002.
40 D. Müller, E. Jahn, G. Ladwig, U. Haubenreisser, Chem. Phys. Lett., 109 (1984) 332−336, https://doi.org/10.1016/0009-2614(84)85596-7.
41 K. Kanehashi, T. Nemoto, K. Saito, J. Non-Cryst. Solids, 2007, 353, 4227-4231, https://doi.org/10.1016/j.jnoncrysol.2007.05.020.
42 D. M. Dawson, S. E. Ashbrook, J. Phys. Chem. C, 118 (2014) 23285-23296, https://doi.org/10.1021/jp507644z.
43 C. Bonhomme, C. Gervais, C. Coelho, F. Pourpoint, T. Azaïs, L. Bonhomme-Coury, F. Babonneau, G. Jacob, M. Ferrari, D. Canet, J. R. Yates, C. J. Pickard, S.A. Joyce, F. Mauri, D. Massiot, Magn. Reson. Chem. 48 (2010) S86-S102, https://doi.org/10.1002/mrc.2635. 44 E. R. Losilla, A. Cabeza, S. Bruque, M. A. G. Aranda, J. Sanz, J. E. Iglesias, J. A. Alonso,
J. Solid State Chem. 156 (2001) 213-219, https://doi.org/10.1006/jssc.2000.8984.
45 K. Popa, R. J. M. Konings, P. Boulet, D. Bouëxière, A. F. Popa, Thermochim. Acta 436 (2005) 51-55, https://doi.org/10.1016/j.tca.2005.06.035.
46 K. Popa, R.J.M. Konings, O. Beneš, T. Geisler, A.F. Popa, Thermochim. Acta, 451 (2006) 1-4, https://doi.org/10.1016/j.tca.2006.08.011.
20 47 T. Geisler, K. Popa, R. J. M. Konings, A. F. Popa, J. Solid State Chem. 179 (2006) 1490-1495, https://doi.org/10.1016/j.jssc.2006.01.065.
48 D. Massiot, F. Fayon, M. Capron, I. King, S. Le Calvé, B. Alonso, J.-O. Durand, B. Bujoli, Z. Gan, G. Hoatson, Magn. Reson.Chem. 40 (2002) 70-76, https://doi.org/10.1002/mrc.984.
49 P. Giannozzi, S. Baroni, N. Bonini, M. Calandra, R. Car, C. Cavazzoni, D. Ceresoli, G. L Chiarotti, M. Cococcioni, I. Dabo, A. Dal Corso, S. de Gironcoli, S. Fabris, G. Fratesi, R. Gebauer, U. Gerstmann, C. Gougoussis, A. Kokalj, M. Lazzeri, L. Martin-Samos, N. Marzari, F. Mauri, R. Mazzarello, S. Paolini, A. Pasquarello, L. Paulatto, C. Sbraccia, S. Scandolo, G. Sclauzero, A. P Seitsonen, A. Smogunov, P. Umari, R. M Wentzcovitch, J.
Phys.: Condens. Matter 21 (2009) 395502, https://doi.org/10.1088/0953-8984/21/39/395502.
50 C. J. Pickard, F. Mauri, Phys. Rev. B, 63 (2001) 245101, https://doi.org/10.1103/PhysRevB.63.245101.
51 T. Charpentier, Solid State NMR, 40 (2011) 1−20,
https://doi.org/10.1016/j.ssnmr.2011.04.006.
52 J. P. Perdew, K. Burke, M. Ernzerhof, Phys. Rev. Lett. 77 (1996) 3865-3868, https://doi.org/10.1103/PhysRevLett.77.3865.
53 N. Trouiller, J. Martins, Phys. Rev. B, 43 (1991) 1993-2006, https://doi.org/10.1103/PhysRevB.43.1993.
54 http://www.quantum-espresso.org/pseudopotentials/pslibrary/. 55 https://sites.google.com/site/dceresoli/pseudopotentials. 56 http://www.quantum-espresso.org.
57 U. Haeberlen, In Advances in Magnetic Resonance; Suppl. 1; J. S. Waugh, Ed.; Academic Press: New York, 1976.
58 M. Mehring, Principles of High Resolution NMR in Solids, 2nd. ed.; Springer Verlag: Berlin, 1983.
59 H. W. Spiess, In NMR Basic Principles and Progress; P. Diehl, E. Fluck, R. Kosfeld, Eds.; Springer Verlag, Berlin, 1978, Vol. 15.
60 M. J. Frisch, G. W. Trucks, H. B. Schlegel, G. E. Scuseria, M. A. Robb, J. R. Cheeseman, G. Scalmani, V. Barone, B. Mennucci, G. A. Petersson, H. Nakatsuji, M. Caricato, X. Li, H. P. Hratchian, A. F. Izmaylov, J. Bloino, G. Zheng, J. L. Sonnenberg, M. Hada, M. Ehara, K. Toyota, R. Fukuda, J. Hasegawa, M. Ishida, T. Nakajima, Y. Honda, O. Kitao, H. Nakai, T. Vreven, J. A. Montgomery Jr., J. E. Peralta, F. Ogliaro, M. Bearpark, J. J. Heyd, E. Brothers, K. N. Kudin, V. N. Staroverov, T. Keith, R. Kobayashi, J. Normand, K. Raghavachari, A. Rendell, J. C. Burant, S. S. Iyengar, J. Tomasi, M. Cossi, N. Rega, J. M. Millam, M. Klene, J. E. Knox, J. B. Cross, V. Bakken, C. Adamo, J. Jaramillo, R. Gomperts, R. E. Stratmann, O. Yazyev, A. J. Austin, R. Cammi, C. Pomelli, J. W. Ochterski, R. L. Martin, K. Morokuma, V. G. Zakrzewski, G. A. Voth, P. Salvador, J. J. Dannenberg, S. Dapprich, A. D. Daniels, O. Farkas, J. B. Foresman, J. V. Ortiz, J. Cioslowski, D. J. Fox, Gaussian 09, Revision D.01. Gaussian, Inc., Wallingford CT, 2010.
61 W. R. Wadt, P. J. Hay, J. Chem. Phys., 82 (1985) 284, https://doi.org/10.1063/1.448800. 62 W. R. Wadt, P. J. Hay, J. Chem. Phys. 82 (1985) 299, https://doi.org/10.1063/1.448975. 63 A. D. Becke, J. Chem. Phys., 98 (1993) 5648-5652, https://doi.org/10.1063/1.464913. 64 C. Lee, W. Yang, R. G. Parr, Phys. Rev. B, 37 (1988) 785-789, https://doi.org/10.1103/PhysRevB.37.785.
65 T. H. Dunning, Jr., J. Chem. Phys. 90 (1989) 1007, https://doi.org/10.1063/1.456153. 66 D. E. Woon and T. H. Dunning, Jr., J. Chem. Phys. 98 (1993) 1358, https://doi.org/10.1063/1.464303.
21 67 J. Koput and K.A. Peterson, J. Phys. Chem. A 106 (2002) 9595–9599, https://doi.org/10.1021/jp026283u.
68 A. K. Wilson, D. E. Woon, K. A. Peterson, T. H. Dunning, Jr., J. Chem. Phys. 110 (1999) 7667, https://doi.org/10.1063/1.478678.
69 N.B. Balabanov and K.A. Peterson, J. Chem. Phys. 123 (2005) 064107, https://doi.org/10.1063/1.1998907.
70 X. Cao, M. Dolg, J. Chem. Phys. 115, 7348 (2001), https://doi.org/10.1063/1.1406535. 71 X. Cao, M. Dolg, J. Molec. Struct. (Theochem) 581 (2002) 139, https://doi.org/10.1016/S0166-1280(01)00751-5.
72 M. Kaupp, P. v. R. Schleyer, H. Stoll, H. Preuss, J. Chem. Phys. 94 (1991) 1360, https://doi.org/10.1063/1.459993.
73 B. Metz, H. Stoll, M. Dolg, J. Chem. Phys. 113 (2000) 2563, https://doi.org/10.1063/1.1305880.
74 K. A. Peterson, J. Chem. Phys. 119 (2003) 11099, https://doi.org/10.1063/1.1622923. 75 K. A. Peterson, D. Figgen, M. Dolg, H. Stoll, J. Chem. Phys. 126 (2007) 124101, https://doi.org/10.1063/1.2647019.
76 D. Figgen, K.A. Peterson, M. Dolg, H. Stoll, J. Chem. Phys. 130 (2009) 164108, https://doi.org/10.1063/1.3119665.
77 J. R. Cheeseman, G. W. Trucks, T. A. Keith, M. J. Frisch, J. Chem. Phys. 104 (1996) 5497-5509, https://doi.org/10.1063/1.471789.
78 D. Bregiroux, K. Popa, R. Jardin, P. E. Raison, G. Wallez, M. Quarton, M. Brunelli, C. Ferrero, R. Caciuffo, J. Solid State Chem. 182 (2009) 1115-1120, https://doi.org/10.1016/j.jssc.2009.02.012.
79 H. Mayer, H. Völlenkle, Monatsh. Chem. 103 (1972) 1560.
80 C. Coelho, T. Azais, L. Bonhomme-Coury, G. Laurent, C. Bonhomme, Inorg. Chem. 46 (2007) 1379-1387, https://doi.org/10.1021/ic061964f.
81 H. Mayer, Monatshefte Chem. 105 (1974) 46-54, https://doi.org/10.1007/BF00911286. 82 H. N. Ng, C. Calvo, Can. J. Phys. 54 (1976) 638-647, https://doi.org/10.1139/p76-070. 83 B. L. Phillips, J. G. Thompson, Y. Xiao, R. J. Kirkpatrick, Phys. Chem. Miner. 20 (1993) 341-352, https://doi.org/10.1007/BF00215105.
84 S. Jaulmes, Bull. Soc. fr. Minéral. Cristallog. 95 (1972) 42-46.
85 F. Vasconcelos, S. Cristol, J.-F. Paul, L. Montagne, F. Mauri, L. Delevoye, Magn. Reson.
Chem. 48 (2010) S142-S150, https://doi.org/10.1002/mrc.2667.
86 K. Pilar, Z. Deng, M. B. Preefer, J. A. Cooley, R. Clément, R. Seshadri, A. K. Cheetham, Phys. Chem. Chem. Phys. 21 (2019) 10070-10074, https://doi.org/10.1039/c9cp01420a. 87 T. Charpentier, S. Ispas, M. Profeta, F. Mauri, C. J. Pickard, J. Phys. Chem. B 108 (2004) 4147-4161, https://doi.org/10.1021/jp0367225.
88 M. Profeta, F. Mauri, C. J. Pickard, J. Am. Chem. Soc. 125 (2003) 541-548, https://doi.org/10.1021/ja027124r.
89 J. R. Yates, S. E. Dobbins, C. J. Pickard, F. Mauri, P. Y. Ghi, R. K. Harris, Phys. Chem.
Chem. Phys.7 (2005) 1402-1407, https://doi.org/10.1039/B500674K.
90 M. Dračínský, P. Hodgkinson, Chem. Eur. J., 20 (2014) 2201–2207,
https://doi.org/10.1002/chem.201303496.
91 S. T. Holmes, R. J. Iuliucci, K. T. Mueller, C. Dybowski, J. Chem. Theory Comput. 11 (2015) 5229−5241, https://doi.org/10.1021/acs.jctc.5b00752
92 M. Dračínský, P. Unzueta, G. J. O. Beran, Phys. Chem. Chem. Phys., 21 (2019) 14992, https://doi.org/10.1039/c9cp01666j.
93 R. P. Young, C. R. Lewis, C. Yang, L. Wang, J. K. Harper, L. J. Mueller, Magn Reson
22 94 L. J. Mueller, Concept. Magn. Reson. A, 38 (2011) 221–235, https://doi.org/10.1002/cmr.a.20224