HAL Id: hal-02888425
https://hal.archives-ouvertes.fr/hal-02888425
Submitted on 3 Nov 2020
HAL is a multi-disciplinary open access
archive for the deposit and dissemination of
sci-entific research documents, whether they are
pub-lished or not. The documents may come from
teaching and research institutions in France or
abroad, or from public or private research centers.
L’archive ouverte pluridisciplinaire HAL, est
destinée au dépôt et à la diffusion de documents
scientifiques de niveau recherche, publiés ou non,
émanant des établissements d’enseignement et de
recherche français ou étrangers, des laboratoires
publics ou privés.
Regional Changes in Carbon Dioxide Fluxes of Land and
Oceans Since 1980
P. Bousquet, Philippe Peylin, Philippe Ciais, Corinne Le Quéré, Pierre
Friedlingstein, Pieter P. Tans
To cite this version:
P. Bousquet, Philippe Peylin, Philippe Ciais, Corinne Le Quéré, Pierre Friedlingstein, et al.. Regional
Changes in Carbon Dioxide Fluxes of Land and Oceans Since 1980. Science, American Association
for the Advancement of Science, 2001, 290 (5495), pp.1342-1346. �10.1126/science.290.5495.1342�.
�hal-02888425�
Regional Changes in Carbon Dioxide Fluxes of Land and Oceans since 1980
Author(s): Philippe Bousquet, Philippe Peylin, Philippe Ciais, Corinne Le Quéré, Pierre
Friedlingstein, Pieter P. Tans
Source: Science, New Series, Vol. 290, No. 5495 (Nov. 17, 2000), pp. 1342-1346
Published by: American Association for the Advancement of Science
Stable URL:
http://www.jstor.org/stable/3078243
Accessed: 29/01/2009 04:38
Your use of the JSTOR archive indicates your acceptance of JSTOR's Terms and Conditions of Use, available at
http://www.jstor.org/page/info/about/policies/terms.jsp. JSTOR's Terms and Conditions of Use provides, in part, that unless
you have obtained prior permission, you may not download an entire issue of a journal or multiple copies of articles, and you
may use content in the JSTOR archive only for your personal, non-commercial use.
Please contact the publisher regarding any further use of this work. Publisher contact information may be obtained at
http://www.jstor.org/action/showPublisher?publisherCode=aaas.
Each copy of any part of a JSTOR transmission must contain the same copyright notice that appears on the screen or printed
page of such transmission.
JSTOR is a not-for-profit organization founded in 1995 to build trusted digital archives for scholarship. We work with the
scholarly community to preserve their work and the materials they rely upon, and to build a common research platform that
promotes the discovery and use of these resources. For more information about JSTOR, please contact support@jstor.org.
American Association for the Advancement of Science is collaborating with JSTOR to digitize, preserve and
extend access to Science.
REPORTS
sediments and K is a constant factor. Following (29), we let K = 103, and assume a = 10-7 m, which is comparable to the size of typical clay particles. 37. J. X. Mitrovica, A. M. Forte,J. Geophys. Res. 102, 2751
(1997).
38. G. A. de Wijs et al., Nature 392, 805 (1998). 39. A. D. Brandon et al., Science 280, 1570 (1998).
40. Archie's law defines the electrical conductivity of the porous sediments as a = 4n,u: where a,: = 5 X 10⁵
S m-1 is the electrical conductivity of liquid iron and n is a constant that typically lies between 1 and 2. We choose n = 1.5 in our calculations.
41. The P- and S-wave velocities are based on the Hashin-Shtrikman bounds for elastic composites. We plot the upper bounds so that our velocity reductions
represent minimum values. [J. P. Watt, G. F. Davies, R. J. O'Connell, Rev. Geophys. 14, 541 (1976)1. The sediment properties are based on the mantle prop- erties in (26). The P-wave velocity in the liquid is vCP = 8.06 km s-'.
42. P. M. Mathews, B. A. Buffett, T. A. Herring, in preparation.
43. E. J. Garnero, J. E. Vidale, Geophys. Res. Lett. 26, 377 (1 999).
44. J. C. Castle, R. D. van der Hilst, Earth Planet. Sci. Lett. 176, 311 (2000).
45. The rejection of light elements from the inner core provides an important source of buoyancy for con- vection in the core. Light elements at the inner-core boundary r = ric are mixed into the volume of the
Regional Changes in Carbon
Dioxide FLuxes of Land and
Oceans Since 1980
PhiLippe Bousquet,I-2* PhiLippe PeyLin,l PhiLippe Ciais,'
Corinne Le Qu6r6,lt Pierre FriedLingstein,l Pieter P. Tans3
We have applied an inverse model to 20 years of atmospheric carbon dioxide measurements to infer yearly changes in the regional carbon balance of oceans and continents. The model indicates that global terrestrial carbon fluxes were approximately twice as variable as ocean fluxes between 1980 and 1998. Tropical land ecosystems contributed most of the interannual changes in Earth's carbon balance over the 1980s, whereas northern mid- and high-latitude land ecosystems dominated from 1990 to 1995. Strongly enhanced uptake of carbon was found over North America during the 1992-1993 period compared to
1989-1990.
Over the past two decades, on average, about half of the CO2 emissions caused by fossil fuel combustion have remained in the atmosphere,
the rest having been absorbed by the ocean and
by land ecosystems. Year-to-year variations in
the rate of atmospheric CO2 accumulation are of
the same magnitude as the decadal mean annual
accumulation and result primarily from shifts in
the natural carbon fluxes (1). Previous investi-
gations into which reservoir (land or ocean) and
which regions caused such year-to-year changes
have produced conflicting answers. Carbon sta-
ble isotope studies all infer large shifts of both land and ocean fluxes of up to several giga-
tonnes (1IO' g) of carbon per year (GtC year-')
(2, 3). In contrast, ocean carbon models and
measurements of the CO2 partial pressure dif-
ference between the ocean surface and the at- mosphere (Apco2) suggest relatively small changes in the air-sea fluxes (4-6). Global bio-
'Laboratoire des Sciences du Climat et de l'Environ- nement (LSCE), F-91198 Gif-sur-Yvette Cedex, France. 2Universit6 de Versailles Saint Quentin en Yvelines (UVSQ), F-78035 Versailles Cedex, France. 3National Oceanic and Atmospheric Administration (NOAA), Climate Monitoring and Diagnostics Labora- tory, Boulder, CO 80303, USA.
*To whom correspondence should be addressed. E- mail: pbousquet@cea.fr
tPresent address: Max-Planck-Institut for Biogeoche- mie, D-07701 Jena, Germany.
geochemical models of the land biosphere gen-
erally produce large interannual shifts in terres-
trial fluxes, but they differ in where or how they attribute these shifts to underlying processes
(photosynthesis or respiration).
Inverse models using atmospheric CO2 ob-
servations and atmospheric transport have been
applied to infer the mean spatial distribution of
CO2 fluxes (7-9), but rarely to estimate their
interannual variability (10). Here, we construct-
ed an inversion using 20 years of atmospheric
CO2 measurements, mostly from the NOAA
Climate Monitoring and Diagnostics Laborato-
ry air sampling network, to infer monthly changes in the carbon balance of large regions. The carbon balance of continents and oceans can be considered as the sum of two compo-
nents, a long-term mean net flux (over 20 years)
and a monthly varying flux anomaly. In the following, we present and discuss the monthly varying flux anomalies. The results of the in- verse approach ("top-down") are compared
with predictions of two state-of-the-art global
models ("bottom-up") of the carbon fluxes over
land ecosystems and oceans.
Over the past 20 years, the annual accumu- lation of CO2 in the atmosphere has varied between 1 and 6 GtC year-1 (1). Because fossil CO2 emission changes do not vary much from year to year, the observed changes in accumu- lation rate reflect variations of ocean and land
outer core. The release of gravitational energy is proportional to tJ - tp(rjc), where tp(rjc) is the gravi- tational potential at r = ric and t+ is the average potential over the liquid core. If the excess light elements are subsequently incorporated into sedi- ments at the top of the core r = rc, the total release of gravitational energy is proportional to t(rj -
4(rjj), which is larger than + - 4(rjj) by about a
factor of 2.
46. Partially supported by NSERC (B.A.B.), NSF, the UC Institute of Geophysics (R.J.), and NSF grants EAR- 9905710 and NSF-9996302 (E.J.G.).
22 June 2000; accepted 29 September 2000
fluxes. At present, about 120 CO2 data records
from around the globe are available (11). Most
CO2 stations are in the marine boundaty layer; they can be influenced directly by ocean fluxes
and more indirectly by land fluxes. A few CO2
stations, however, are close to or within the continents and can better capture year-to-year
changes in terrestrial fluxes. Among the 120
sites available in 1998, we have selected 67 sites (12). At each site, we have analyzed the
variance of the deseasonalized trend after sub-
traction of the trend at the South Pole (13). This
analysis indicates that there is "excess" variance
at low frequency at continental sites compared
to oceanic sites (Fig. 1). This excess variance may reflect short-term spatial and temporal variability of land fluxes or of atmospheric
transport. However, it also suggests that terres-
trial carbon fluxes exhibit larger year-to-year
variations than their oceanic counterparts. This
inference can be evaluated by using an inverse
model to calculate regional carbon balance vari-
ations from observed concentration variations.
We have developed such a model, extend- ing the work of (9), to retrieve the net CO2 fluxes evety month from 1980 to 1998 (13). The inverse model optimizes CO2 ocean and
land fluxes for 11 continental regions and eight
ocean regions (Fig. 1) by minimizing the dif-
ferences between the CO2 concentrations sim-
ulated by a three-dimensional atmospheric
transport model and those observed at measure-
ment sites. Fossil CO2 fluxes are prescribed from energy use statistics (14). The control inversion is described in (13). The atmospheric CO2 data used for the inversion are calculated
from 67 selected monitoring sites (12) over the
period 1980-1998. Raw flasks and in situ records are smoothed in the time domain to
remove synoptic variability (11) and are used in
the form of monthly means. An increasing number of stations is available over time, from 20 sites in 1980 to 67 sites in 1997, with 35 new
sites appearing between 1987 and 1991. Data
uncertainties are estimated each month at each
station from the (synoptic) scatter and measure- ment uncertainties of the original flask data (13). In addition to the control inversion (13),
we have carried out a sensitivity study consist-
ing of seven additional inversions in which key
parameters are varied individually (15), provid-
ing a range of uncertainty on the inferred fluxes. The sensitivity study was performed to better
account for uncertainties that are not explicitly
represented in the inverse procedure, which only returns a residual uncertainty.
At the regional scale, we find that the long-term mean net fluxes are significantly different among the eight inversions, within a typical range of 0.4 GtC year-' for ocean regions and of 0.8 GtC year-' for land re- gions. Independent inverse modeling studies of the mean net fluxes tend to confirm this result (7-9). On the other hand, the inferred flux anomalies are substantially more similar among our sensitivity tests, which suggests that anomalies are retrieved more robustly than long-term mean fluxes (16). The latter are inferred from mean spatial concentration
differences among stations, which are rather small within a given latitude band. For in- stance, the apportionment of sources and sinks between North America and Eurasia relies on spatial mean differences on the or- der of 0.5 parts per million (ppm) at mid- northern latitudes (7). In contrast, flux anom- alies for these regions are inferred from tem- poral changes of concentration differences between stations, which are larger than mean longitudinal differences (see below). Accord- ingly, we focus on monthly flux anomalies.
During the 1980-1998 period, land fluxes are found to be twice as variable as ocean fluxes (Fig. 2), in agreement with the quali- tative analysis in Fig. 1. The anomalies have a peak-to-peak amplitude of 5.0 GtC for the
total global terrestrial flux and 2.5 GtC for the
global air-sea flux. Anomalous uptake over land is inferred during 1981-1983, 1991- 1993, and 1997, and anomalous uptake over oceans persists from 1989 to 1996. Unlike previous studies that relied on atmospheric carbon isotope records (2, 3), we infer no
significant anticorrelation in the flux anoma-
lies between ocean and land. In this study, the ocean flux anomalies are always smaller than the land anomalies. The inversion with the minimum variability in the air-sea flux anom- alies (half as large as the control run) corre- sponds to larger observational uncertainties, allowing a looser fit to the ocean stations. The inversion with the maximum variability in the air-sea flux anomalies (1.3 times as large as the control run) occurs when no constraint is applied to the global mean ocean uptake (13).
90?N 60N 30?S SHM 60?S__ 90?S 180?W 1P20?W 60?W 0? 60?E 120?E 180E Longitude
ppmv
|o RPB GMI- o o o0 0 0 - -' -' - -' M~ 0 o o o o o o o 000 oFig. 1. Year-to-year variability of the CO2 trend at the monitoring sites used in the inverse procedure over the period 1980-1998. The variability is estimated by the standard deviation of the weekly CO2 deseasonalized trend after subtraction of the South Pole trend (13). Sites further toward the red end of the scale indicate stronger trend variations, which are presumably caused by larger variability of the sources influencing the station. The 11 continental regions (gray areas) and the eight ocean regions (separated by lines) used in the inverse procedure are also shown. For the continents, from north to
south: Arctic regions (far North America and far north Eurasia), boreal
and temperate North America, boreal and temperate Europe, boreal and temperate North Asia, tropical Africa, south America, tropical Asia, and all lands south of 200S. For the oceans: North Atlantic, >50?N; North Pacific, >50?N; North Atlantic, 200 to 50?N; North Pacific, 200 to 50?N; Equatorial Pacific, 200S to 20?N; sum of Equa- torial Indian and Atlantic, 200S to 20?N; subtropical, sub-Antarctic oceans, 200 to 50?S; and Southern Ocean, >500S. A total of 67 sites are used in this study. The Mace-Head (MHD, Ireland) continuous record is split in two time series according to continental and oceanic origin of air at the station (two dots).
REPORTS
No individual ocean basin is inferred to
contribute predominantly to the global ocean
flux anomaly, although both the Southern
Ocean (south of 50?S) and the equatorial zone
exhibit relatively larger flux anomalies. The
Equatorial Pacific (20?S to 20?N) is known to
exhibit year-to-year variations in the air-sea
CO2 fluxes, as shown by repeated surveys (17-
20) of measured ApcO2. The year-to-year vari-
ations found in our inversions are in good agreement with the ocean flux anomalies de-
rived from Apco2 measurements (17-20). Both
approaches estimate an anomalous C02sink of
0.1 to 0.5 GtC year- ' during the strong El Nifio events of 1982-1983, 1986-1987, and 1997- 1998, and an anomalous source of the same amplitude during the La Nifia event of 1988- 1989. The agreement in this region may be
partially due to the relatively dense observation-
al network in the atmosphere, with 20% of the
flask data (Fig. 1), and in the ocean with the
dense ApCO2 coverage (17-20).
Our inversions also compare favorably with
the ocean carbon model of (21) for the ampli-
tude of the year-to-year variations both in the
Equatorial Pacific (Fig. 3A) and in the Southern
Ocean [not shown, see (22)]. However, some phasing differences remain between the two
approaches. Outside the Equatorial Pacific and
Southern Ocean, the inversions and the ocean carbon model disagree: The inversions give much larger variations than the ocean model (+0.4 versus ?0.1 GtC year- '). The few basin
scale observations do not justify a preference of
one estimate over the other. The ocean model
could underestimate variability because it does
not include continental margins, and because it
underestimates the variability in ocean dynam-
ics at high latitudes (21). On the other hand, the
inversions could overestimate variability be- cause the low density of the atmospheric sta- tions makes it difficult to draw a precise line between land and ocean, leaving the possibility
that some of the land variability has been attrib-
uted to the oceans.
During the 1980s, tropical land regions are
found to contribute more anomalous changes to
the global carbon balance than mid- and high-
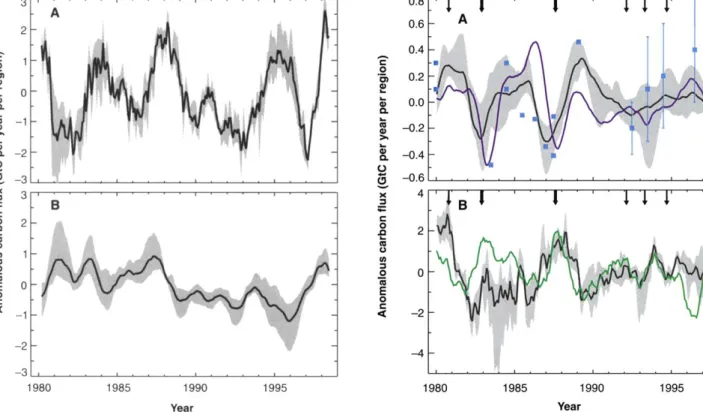
3 A 2 0) 0 0 190 1819019 -2 3 . B 0 2 .0 0 E0 0 -2 - 3. . . . . 1980 1985 1990 1995 Year
Fig. 2 (left). Inferred anomalous changes in the global land (A) and ocean (B) carbon fluxes. Black lines are the average of the eight inversions. Shaded areas represent the range of values obtained from the eight sensitivity inversions. For each inversion, we calculated monthly flux anomalies by subtracting the long-term mean flux over the period 1980-1998, and then used a 12-month running mean to deseasonalize the anomalous flux. Fig. 3 (right). Carbon balance anomalies of tropical regions. Black lines are the average of the eight inversions. Shaded areas represent the range of values obtained from the eight sensitivity inversions. Thick arrows indicate strong El Nino events docu- mented by minima in the Southern Oscillation Index. Thin arrows indicate weak El Nino conditions. (A) Equatorial Pacific region, 20?S to 200N. The (deseasonalized) flux anomalies derived by the inversion are compared to those predicted by one global three-dimensional ocean
latitude ecosystems, whereas the converse is true for the period 1990-1995. During the pe- riod 1996-1998, tropical and Northern Hemi- sphere land ecosystems contribute equally to the total flux anomaly (13). Observed changes in the CO2 growth rate partly illustrate that result. For the periods 1980 -1985, 1989 -199 1, and 1995, growth rate anomalies start in the tropics and propagate toward high latitudes within a few months. During the period 1992-
1993, a negative growth rate anomaly initiates
at mid-northern latitudes and then propagates
toward the Equator (13).
In the 1980s, tropical land regions predom- inantly influence the carbon flux anomalies in
all eight inversions performed (Fig. 3A), except
during 1984-1985. An anomalous source is
inferred during El Nifio years in 1987-1988 and
1998, whereas an anomalous sink occurs during
1982, 1985-1986, and 1989-1993. A strong El Nifno occurred in 1982-1983, for which the inversions produce only a relatively small pos- itive flux anomaly over tropical land regions (Fig. 3B). This may reflect the low station
0.8 '1
J
I
I I
'I
0.6 A 0.4 0 0) 0.2 0) (D 0.0 D-0.2-
D --0.6 x 4 B 0 2 co o 0 'E 0 -2- -4 1980 1985 1990 1995 Yearcarbon model (blue line) that computes changes in ocean circulation and in marine biology (21), as well as to those estimated on the basis of Apco2 measurements compiled in (17-20) (blue squares). Uncertainties in the flux estimates (rightmost blue squares) are composed of the seasonal variations of pco2 in water, wind speed variability, and wind speed dependence of gas exchange (18). Oceanic flux anomalies from the model of (21) are averaged over the same regions as the inversion. Apco2-based flux anomalies are extrapolated to different surfaces of the equatorial Pacific Ocean as de- scribed in (17-20). (B) Tropical land regions, 200S to 200N. The deseason- alized flux anomalies derived by the inversion are compared to those predicted by a global biogeochemical model of the terrestrial biosphere [green line, see (23)] averaged over the same regions as the inversion. Note that land use-induced and disturbance-induced carbon flux anomalies are not included in the biogeochemical model.
density in the tropics in the early 1980s. The
interannual variations estimated from the inver-
sion are in reasonable agreement with those predicted by the global biogeochemical model of (23) (r = 0.55, Fig. 3B), except for the period 1996-1998. Note that the inverse esti- mates combine changes in land use, biomass burning of natural origin and induced by hu- mans, and biogeochemical carbon sources and sinks, whereas the model of (23) only accounts for climate-driven biogeochemical effects. Among tropical continents, the Amazon is a
major contributor to anomalous carbon balance
variations (24). However, the partition of the land fluxes within the tropical band can only be tentative, given the absence of sampling sta- tions on the tropical continents and the small magnitude of atmospheric signals (ppm per GtC) caused by strong convective vertical "di- lution" of the surface fluxes.
Northern Hemisphere land areas predomi- nantly influenced the carbon flux anomalies during the early 1990s. A strong drop in growth rate occurred during 1992-1993 at mid-north- ern latitudes (1). We invert this signal into an
enhanced terrestrial uptake over the Northern
Hemisphere continents. Terrestrial carbon stor-
age increased there by 1.4 GtC year-' from the
biannual mean in 1989-1990 to that of 1992- 1993 (Fig. 4A), in accordance with previous analyses of atmospheric carbon isotopes (25) and oxygen data (26). Our regional inversions
locate the 1992-1993 enhanced terrestrial sink
predominantly over North America (-2.0
GtC). This striking result is also directly visible
in the CO2 observations. Figure 4B shows the
annual mean difference in CO, concentration between Atlantic and Pacific stations, which relates to the North American carbon balance (27). The Atlantic stations were 0.5 ppm higher than those in the Pacific during 1989-1990 but were 0.5 ppm lower during 1992-1993 (Fig.
4B). The enhanced North American uptake dur-
ing 1992-1993 is inferred by all but one of the
seven sensitivity runs (28). Between 1989 and 1993, North American and Eurasian carbon
fluxes are anticorrelated (r = -0.65, see Fig.
4A), but the enhanced uptake over North Amer-
ica remains on average three times the size of
the reduced uptake over Eurasia. Moreover, the
error correlation between those two regions es-
timated by the inversion is not significant (r = -0.35), which indicates that the present atmo- spheric network may be able to correctly sepa-
rate anomalous changes in Eurasia versus North
America in the early 1990s.
The carbon balance of North America has
received much attention. We show here that this
region experienced a large change in carbon fluxes of 2 GtC in the early 1990s, a change
similar in magnitude to the mean annual uptake
inferred by Fan et al. (7) over the period 1988-
1992. Although the mean carbon balance of North America appears to be poorly con- strained in our eight inversions (29), the large
flux anomaly that we infer appears fairly robust.
This anomalous increase in carbon storage over North America was of short duration; it was followed by a carbon loss of the same magni-
tude during 1994-1995 (Fig. 4A). A second large negative growth rate anomaly occurred between 1995 and 1997 (see Fig. 4A) that we attribute to an anomalous land uptake of 0.9
2 A (S.0 -
21m
F
%
4
~w
0 00 E 1L -2 1988 1990 1992 1994 1996 1998 1 .5 I I I I I I I I I IB Pacific stations Atlantic stations
O -0 . _ .is--- -- - -- - -- - -- - -- - -- - -- - -- - -- - -- - -- - E AL -1.. CL 0.5 - - - -W - - - - -- 89-90 - - - - - - 0 0.0 30 ALL67--- 0 04 -1.0 -~~0
ur
-15 1 1 10 1 1 20 30 40 50 60 70 20 30 40 50 60 70 LatitudeFig. 4. Carbon balance anomalies of Northern Hemisphere land regions after 1988. (A) Terrestrial carbon flux anomalies. Black line is the average of the eight inversions for northern extratropical lands. Shaded area represents the range of values obtained from the eight sensitivity inversions. Flux anomalies are separated between North America (purple line) and Eurasia (orange line). North America corresponds to the aggregated results of the inversion over three regions (temperate, boreal, and arctic in Fig. 1), and Eurasia corresponds to aggregated results over four regions (temperate and boreal Europe, temperate and boreal Siberia in Fig. 1). Note that we restrict this plot to the period 1987-1998 because the partition of land fluxes between Eurasia and North America is constrained by too few sites in the early 1980s (14 sites in 1980 and 20 sites in 1985 for the whole Northern Hemisphere). (B) Observed CO2 concentrations at Eastern Pacific stations (left) and Atlantic stations (right) between 200 and 70?N for two different biannual mean periods (1989-1990 and 1992-1993) and one annual period (1996.5-1997.5). Changes in the difference of concentrations between Pacific and Atlantic sites partly reflect shifts in the carbon balance of North America. For each of the periods 1989-1990, 1992-1993, and 1996-1997, we calculated anomalous concentrations at each site by subtracting the mean concentration calculated using Pacific sites only. This represents anomalies at Atlantic sites compared to Pacific sites [see (7), figure 3]. In the Atlantic, each period is summarized by the mean anomaly shown as a horizontal line. In the Pacific, all mean anomalies are zero (the segment "All"). Data are shown for the following locations: BME (32.370N, 64.65?W), BMW (32.270N, 64.88?W), CBA (55.200N, 162.72?W), CMO (45.480N, 123.97?W), CSJ (51.930N, 131.02?W), ICE (65.OOON, 24.00?W), IZO (28.300N, 16.48?W), KEY (25.670N, 80.20?W), MHT (53.330N, 9.70?W), STM (66.00?N, 2.OOOE), P05 (25.OOON, 154.00?W), P04 (30.OOON, 148.0OW), P03 (35.OOON, 143.00?W), P02 (40.OOON, 138.00?W), and P01 (45.OOON, 131.00?W). For the Pacific Ocean, we exclude sites located too far from the west coast of America (limit of 160?W). For the Atlantic Ocean, we keep all stations between 200 and 700N. For both oceans, we include the coastal sites (KEY, CSJ, and CMO) and we do not use sites located in the interior of the American continent (UTA, NWR, and ITN).
REPORTS
GtC in the Northern Hemisphere, both over North America (increase of 0.6 GtC) and over Eurasia (increase of 0.3 GtC).
Both 1992 and 1993 were colder years than average over the entire Northern Hemi- sphere, but North America experienced air temperatures 0.5?C colder than Eurasia in early 1993 (30). We find that North American flux anomalies strongly correlate with tem- perature anomalies over the early 1990s (r = 0.8). A decrease of ecosystem respiration larger than a decrease of photosynthesis could have enhanced carbon uptake over North America during 1992-1993. The glob- al biogeochemical model (23), which cap- tured tropical flux anomalies well, fails to reproduce the inferred changes over Northern Hemisphere land ecosystems.
It is important to determine which regions
and processes are responsible for interannual changes in the carbon balance of oceans and continents for two reasons. First, the impact of climate variability on the carbon sources and sinks can provide a unique assessment of pro- cess models used to predict CO2 levels in re- sponse to emission and climate change scenar- ios. Second, to detect where CO2 is being ab- sorbed over land and oceans over the long term,
it is necessary to separate interannual variations
from long-term mean fluxes. Only when more
atmospheric CO2 measurements become avail-
able will it be possible to better understand carbon flux anomalies, especially on land. One
of the challenging issues then will be to link this
top-down information to local measurements
related to the interannual changes in the carbon
balance of land ecosystems, such as climate
anomalies, land use, and flux and tree-ring data.
References and Notes
1. See figures 6 and 7 in T. J. Conway et al., J. Geophys. Res. 99, 22831 (1994).
2. R. J. Francey et al., Nature 373, 326 (1995). 3. C. D. Keeling et al., Nature 375, 666 (1995). 4. K. Lee, R. Wanninkhof, T. Takahashi, S. C. Doney, R. A.
Feely, Nature 396, 155 (1998).
5. C. Le Quere et al., Global Biogeochem. Cycles, in press.
6. A. M. Winguth et al., Global Biogeochem. Cycles 8, 39 (1994).
7. S. Fan et al., Science 282, 442 (1998).
8. P. Bousquet, P. Peylin, P. Ciais, M. Ramonet, P. Mon- fray, J. Geophys. Res. 104, 26161 (1999). 9. P. Peylin, P. Bousquet, P. Ciais, P. Monfray, in Inverse
Methods in Global Biogeochemical Cycles, P. Kasib- hatla et al., Eds. (American Geophysical Union, Wash- ington, DC, 1999), pp. 295-309.
10. P. J. Rayner, I. G. Enting, R. J. Francey, R. Langenfelds, Tellus 51B, 213 (1999).
11. CO2 atmospheric data are from the GLOBALVIEW-
CO2 database (available on CD-ROM from Coopera- tive Atmospheric Data Integration Project-Carbon Dioxide, NOAA Climate Monitoring and Diagnostics Laboratory, Boulder, CO, 1997; also available via anonymous FTP to ftp.cmdl.noaa.gov, path: ccg/C02/ GLOBALVIEW). GLOBALVIEW-CO2 is a synthesis product that merges data from different air sampling networks. The raw CO2 concentration data are smoothed in the time domain. Gaps in the data are interpolated, and it is possible to extrapolate the CO2 time series backward, before the onset of real obser- vations. We have used "interpolated" data but dis- carded "extrapolated" data, which constitute more
than 80% of the GLOBALVIEW-CO2 database in the early 1980s. Data analysis was performed as de- scribed [K. A. Masarie, P. P. Tans,J. Geophys. Res. 100, 11593 (1995)].
12. The 50 sites for which measurements did not begin until after 1994 are excluded from our study. This choice allows us to have at least four consecutive years of raw data for calculating a curve fit to the data at each site (11). Two continental sites that are not well represented by the coarse resolution of the transport model are also excluded: Baltic Sea (BAL) and Monte Cimone (CIM). Finally, the station of Azores (AZR) is excluded because of large gaps in the time series (-30%).
13. For further details about the calculation of the deseasonalized trend from the raw data, method and control inversion, multivariate regression coefficient and time lag calculation, net fluxes, and North Amer- ican carbon balance, see Science Online (www. sciencemag.org/cgi/content/full/290/5495/1 342/ DC1).
14. We adopt temporal and spatial patterns in regional fossil fuel emissions, following the maps of Andres et al. [R. J. Andres, G. Marland, I. Fung, E. Matthews,
Global Biogeochem. Cycles 10, 419 (1996)] as well as
the fossil fuel source magnitude given in Trends
Online, A Compendium of Data on Global Change
(http://cdiac.esd.ornl.gov/trends/trends.htm). Decad- al variations in the regional distribution of fossil fuels use are substantial. In the inversion, ignoring such a southward shift in the geographic distribution of the fossil CO2 source during the 1990s would misallocate an additional terrestrial carbon source of 1.0 GtC over Southeast Asia and an additional terrestrial sink of 0.3 GtC over Eastern Europe and Russia. 15. The seven sensitivity tests are as follows. (i) We used
the TM3 model instead of TM2 to test the impact of using a different transport parameterization, which was reported to be a main source of uncertainties when inverting mean fluxes [R. Law et al., Global Biogeochem. Cycles 10, 783 (1996)]. TM3 is based on the same scheme as TM2, but it has a higher vertical and horizontal resolution (5? x 4? x 19 hybrid levels, compared to 7.5? x 7.5? x 9 sigma levels), which produces a CO2 distribution over continents very different from that of TM2. (ii) We used 1993 mete- orological fields instead of 1990 fields to test the impact of interannual variations in the atmospheric transport. (iii) We carried out a test inversion with 16 continental and 14 ocean regions to partly evaluate the impact of spatial discretization of prior sources. (iv) We multiplied all errors on the data by an arbi- trary factor of 2, as we may underestimate some observational errors (e.g., representativeness of sta- tions in the model, data selection, network intercali- bration). (v) We inverted only the 20 sites covering the full 1980-1998 period to study the effect of the appearance of new data in the assimilation scheme. (vi) We removed the additional constraint on the global ocean uptake. (vii) We inverted deseasonalized data at each site instead of monthly seasonal values to test the impact of the seasonal cycle in the inversion results.
16. For instance, in the inversion, both the TM2 and TM3 models produce fairly similar flux anomalies over tropical lands, but TM2 yields an average net sink of 0.6 GtC year-', whereas TM3 yields an average net source of 0.2 GtC year-1 for the period 1980-1998. 17. For years 1997 and 1998, R. A. Feely, personal
communication.
18. R. A. Feely, R. Wanninkhof, T. Takahashi, P. Tans,
Nature 398, 597 (1999).
19. R. A. Feely et al., Deep Sea Res. 44, 1851 (1997). 20. C. S. Wong et al., Tellus 45B, 64 (1993).
21. The ocean model is an updated version of that of Le Quere et al. (5) and of C. Le Quere [thesis, Paris VI University (1999)]. The physical model has high res- olution at the equator (0.5? x 2.0? of latitude x longitude) and is forced by daily to weekly fields from reanalyzed wind and satellite data. The biogeochem- istry model represents the interactions among car- bon, nutrients, phytoplankton, zooplankton, and de- tritus. Initial conditions are based on observations [S. Levitus, M. E. Conkright, J. L. Reid, R. G. Najjar, A. Mantyla, Prog. Oceanogr. 31, 245 (1993); C. Goyet,
D. Davies, Deep Sea Res. 44, 859 (1997); C. Goyet, R. Healy, J. Ryan, Tech. Rep. NDP-076 (Oak Ridge Na- tional Laboratory, Oak Ridge, TN, 2000)]. For the computation of air-sea CO2 fluxes, the atmospheric CO2 follows the observed monthly average value. 22. The agreement in the Southern Ocean is encouraging
and is probably favored by the absence of land and the persistence of westerly winds in this region. The source of atmospheric CO2 variability is therefore directly attributed to the Southern Ocean. Moreover, both direct and inverse approaches present a nega- tive trend in the anomalous fluxes of -0.4 GtC between 1985 and 1995 for the Southern Ocean (south of 50?S).
23. For land regions, we used the global biogeochemical model CASA-SLAVE [P. Friedlingstein et al., Global
Biogeochem. Cycles 9, 541 (1995)]. The terrestrial
carbon model (SLAVE) is driven by surface air tem- perature, precipitation, and solar radiation, and cal- culates net primary productivity (NPP) according to a light-use efficiency formulation that is a function of temperature and water stress. Litter and soil decom- position follow a methodology similar to CENTURY [W. Parton, D. S. Schimel, C. V. Cole, D. S. Ojima,
Global Biogeochem. Cycles 7, 785 (1993)]. Nitrogen
limitation and deposition as well as vegetation dy- namics are ignored.
24. Amazonian ecosystems act as an anomalous source during 1984-1985, 1987-1988, and 1997, whereas anomalous carbon storage is found in Amazonia dur- ing 1985-1986, 1989, 1993, and 1994-1995. No significant correlation between El Nino and carbon storage is observed over the entire period 1980- 1998. Although atmospheric inverse modeling does not provide direct insights into biogeochemical pro- cesses controlling the year-to-year shifts in the car- bon balance of Amazonian ecosystems, we find that enhanced carbon storage positively correlates with precipitation anomalies over the Amazon (r = 0.4) and negatively correlates with temperature anoma- lies (r = -0.4).
25. P. Ciais et al., Science 269, 1098 (1995).
26. R. F. Keeling, S. C. Piper, M. Heimann, Nature 381, 218 (1996).
27. That changes in the difference between Atlantic and Pacific stations correlate with changes in the North American carbon balance is a necessary, albeit not sufficient, verification of the inversion results (13). 28. The inversion where 20 sites are used (15) is the only
one that changes significantly the inferred 1992- 1993 anomalous North American sink (-1.0 GtC year-') compared to the control run. The addition of new sites to the inversion can alter the consistency of the inferred anomalous changes in carbon fluxes. A significant number of new stations (more than 25) were added in the Northern Hemisphere during the late 1980s. This occurred before the 1992-1993 drop in CO2 growth rate.
29. Although a mean terrestrial sink north of the Equator is required in our analysis to balance the North minus South CO2 difference, the partition of that mean sink between Eurasia and North America differs signifi- cantly among the eight inversions performed. For instance, the long-term mean carbon flux of North America over 1988-1992 ranges between a sink of 0.3 GtC year-' and a source of 0.6 GtC year-', which represents in all cases a smaller mean value than the large sink estimated by Fan et al. (7) over the period 1988-1992.
30. J. Hansen et al., Geophys. Res. Lett. 23, 1665 (1996).
31. We thank M. Heimann for providing LSCE with both TM2 and TM3 models, S. Denning for providing LSCE with SIB2 land surface fluxes, P. Monfray for sugges- tions and comments about this work, and P. Rayner for many scientific discussions. Supported by the Ministere de l'Education Nationale de la Recherche et de [a Technologie (MENRT) under contract 99-1226 and the Commission of the European Community under contract EVK2-CT-1999-00013 (AEROCARB). Computing support was provided by Commisariat a l'Energie Atomique (CEA). This is contribution 0511 of the LSCE.
8 June 2000; accepted 11 October 2000