HAL Id: hal-03110173
https://hal.archives-ouvertes.fr/hal-03110173
Submitted on 24 Jan 2021
HAL is a multi-disciplinary open access
archive for the deposit and dissemination of
sci-entific research documents, whether they are
pub-lished or not. The documents may come from
teaching and research institutions in France or
abroad, or from public or private research centers.
L’archive ouverte pluridisciplinaire HAL, est
destinée au dépôt et à la diffusion de documents
scientifiques de niveau recherche, publiés ou non,
émanant des établissements d’enseignement et de
recherche français ou étrangers, des laboratoires
publics ou privés.
A kinetic isotope effect during ice formation by water
freezing
R. Souchez, J. Jouzel, R. Lorrain, S. Sleewaegen, M. Stiévenard, V. Verbeke
To cite this version:
R. Souchez, J. Jouzel, R. Lorrain, S. Sleewaegen, M. Stiévenard, et al.. A kinetic isotope effect during
ice formation by water freezing. Geophysical Research Letters, American Geophysical Union, 2000,
27 (13), pp.1923-1926. �10.1029/2000GL006103�. �hal-03110173�
GEOPHYSICAL RESEARCH
LETTERS, VOL. 27, NO. 13, PAGES 1923-1926,
JULY 1, 2000
A kinetic isotope effect during ice formation by water freezing
R. Souchez,
• J. Jouzel,
2 R. Lorrain,
• S. Sleewaegen,
• M. Sti6venard
2 and
V. Verbeke
•
Abstract. A kinetic isotope effect is known to occur during ice formation from water vapour in a cloud ; it is due to the
difference
in molecular
diffusivities
in air of HDO and H2•80
molecules. A similar effect is likely during water freezing since
diffusion
coefficients
of HDO and H2•80 are also different
in
liquid water. Their values are however less different from each other than those in air. Therefore, such a kinetic isotope effect during water freezing is less frequently observed in Nature. This paper describes a situation in Antarctica where this effect is conspicuous in icings (aufeis). In this type of ice indeed there is
no relationship between /SD (or/5•80) and deuterium excess
whereas a clear inverse relationship between these parameters exists in ice formed by water freezing when equilibrium isotopic fractionation applies. This kinetic effect is potentially present in hail within clouds, in infiltration ice (formed during sea ice growth) and in some kinds of ground ice.
The Glaciological Context
In some areas of North Victoria Land, Antarctica, flowing water can sometimes be observed during the summer even if air temperature is lower than the freezing point (as indicated by automatic weather stations). This situation occurs in places swept across by strong katabatic winds which are responsible for snow-free rock outcrops and relatively strong ice sublimation. Absorption of solar radiation by rock can lead to liquid meltwater production from the small remaining snow patches.
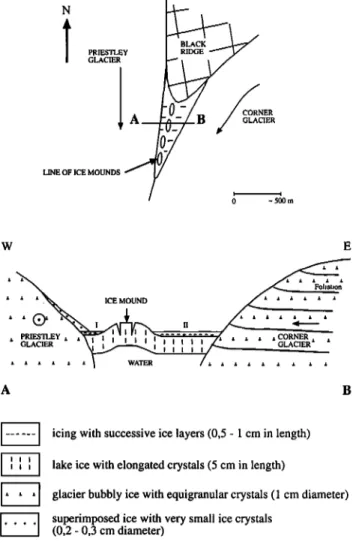
One such area (Fig. 1) is the confluence of Priestley and Corner Glaciers (lat. 74o30 ' S; long. 163o30 ' E). A rock outcrop called Black Ridge - the name was given since it is mainly snow-free - is at the origin of flowing water during some summer days. This water reaches a nearby frozen lake and freezes on its surface. Successive events of this kind are responsible for successive ice layers so that an icing is formed. Two icings in this area have been sampled for isotopic analyses. The analyses have been performed at the Centre d'Etudes Nuc16aires de Saclay with
an accuracy
of 0.5 %0 in/SD and 0.1%0 in/5•80. The/5-values
are
expressed in per mil versus V-SMOW.
Isotopic Fractionation by Water Freezing
Freezing of water involves isotopic fractionation because the different kinds of water molecules freeze at slightly different
temperatures.
In a/5D-/5•80
diagram,
ice samples
resulting
from
water freezing are aligned on a straight line with a slope - called
t D6partement des Sciences de la Terre, Universit6 de Bruxelles,
Brussels, Belgium.
2 Laboratoire des Sciences du Climat et de l'Environnement - CEA Saclay, France.
Copyright 2000 by the American Geophysical Union.
Paper number 2000GL006103.
0094-8276/00/2000GL006103505.00
freezing slope - different from that of the Meteoric Water Line
(/SD
= 8/5•80 + d). This freezing
slope
is observed
in a closed
system and also in an open system if the water input has the same isotopic composition than initial water [Jouzel and Souchez,
1982; Souchez and Jouzel, 1984].
The freezing slope S is given by the following equation in
open systems:
S=
ot•80 ot•8
CtD(CtD-11)
O-
( 1000+/SiD
1000+•5i•80
)
(1)
where/5•D
and/5•80
are the respective
b-values
in deuterium
and
oxygen 18 of the initial water and CtD, C•80 the respective equilibrium fractionation coefficients for deuterium and oxygen 18. Equation (1) shows that the freezing slope is,lower when the initial water has more negative b-values. Anyway, the freezing slope is always lower than the slope of the Meteoric Water Line (MWL) which is about eight.
Modelling of the redistribution of isotopic species during water freezing is mathematically equivalent to modelling of the
LINE OF ICE MOUNDS PRIESTLEY GLACIER ! 0 ~500m E ICE MOUND
II
'i-/'-•
....
/' .... coR•R
--
i I i I IIi?•
GLACIER
• •
I I I IWATER / ...
•
A BI ...
I icing
with
successive
ice
layers
(0,5
- 1
cm
in
length)
• • • I lake
ice
with
elongated
crystals
(5 cm
in length)
I' ' ' [ glacier
bubbly
ice
with
equigranular
crystals
(1
cm
diameter)
I .... I superimposed
(0,2 - 0,3 cm diameter)ice
with
very
small
ice
crystals
Figure 1. Icings at the confluence of Priestley and Corner Glaciers. I and II are the locations where the icings were sampled.
1924 SOUCHEZ ET AL.' A KINETIC ISOTOPE EFFECT DURING ICE FORMATION 18 16 -;,14 o10 E 8 • 6 '• 4
R
2 0.95
!
hD (%0) 2610 ,,,,
_
"6
3•
R
2 = 0.99
24 22 '• 20El8
•16• 14
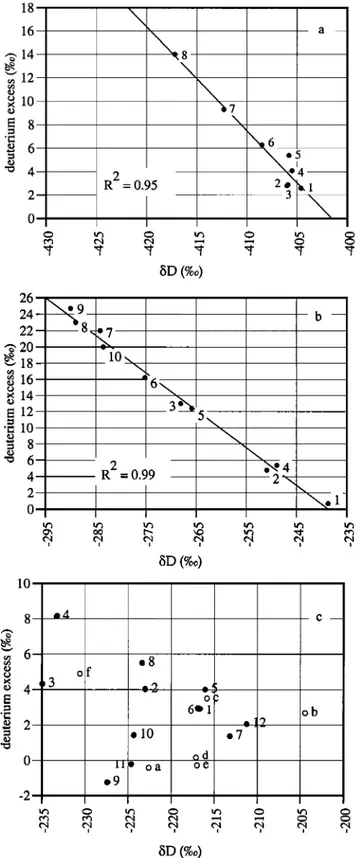
E 12 ß c 10 = 8 -o 6 4 2 0 i i i i i i i SD (%0) 10 _•4 c of O" 6•1 ob el0 e7 od -- lie oa oe .9 8 • 4 • 2 0 -2 i i i i i i i i SD (%0)Figure 2. 6D-d relationships in ice samples from an Antarctic meltwater freezing experiment (a), lake ice samples from a small Antarctic lake situated in the Dry Valleys area (b), and icing
samples
from the Black Ridge area, North Victoria Land (c).
Numbers are increasing with depth. In 2c, letters from a to f refer to icing I and numbers from 1 to 12 refer to icing II.
redistribution of a solute during solidification, a problem extensively studied for preparation of materials by zone melting [Tiller et al., 1953]. The distribution of heavy isotope species in ice during water freezing is related to their distribution in the liquid immediately adjacent to the freezing front. Since isotopic
diffusion in ice is slow (diffusion coefficient -- 10 '• cm 2 s'l), the distribution of deuterium and oxygen 18 in the ice can be deduced from knowledge of their variations in the liquid at the
interface
during
freezing.
In a •iD-•i•80 diagram,
the position
of
an ice sample on the freezing slope is dependent in the case of an open reservoir on the freezing rate v and on the thickness h of the boundary layer close to the interface where isotope transport in water is solely due to diffusion [Souchez et al., 1987]. The relationship between isotopic composition of the ice, freezing rate and boundary layer thickness can be very well approximated for open systems by an equation similar to Burton's equation [Burton
et al., 1953]:
1000 + •s
( 1000
+ •i )
-h.v
(2)
ct-(ct- 1)e D
where •i• and •i• are the respective •i-values of the ice and of the initial water, ct the appropriated equilibrium fractionation coefficient and D the appropriated diffusion coefficient. This equation can be solved either for deuterium or oxygen 18.
Independently, if the rate of water supply is less than the freezing rate, the position of an ice sample on the freezing slope is also dependent on the percentage of freezing [Jouzel and
Souchez, 1982]. A progressive impoverishment of the heavy
isotopes occurs in both the residual water and the ice layers in the course of freezing.
Since the freezing slope has a value lower than eight, an inverse linear relationship between the deuterium excess
(d = •iD- 8 •i•80) of ice samples
resulting
from water
freezing
and •i-values of the same samples is expected. Variations in
deuterium excess are in this case the result of the conditions
prevailing during freezing (freezing rate, boundary layer thickness, percentage of freezing of the reservoir). This is in strong contrast with the general acceptation of this concept in precipitation where it is mainly dependent on the temperature and the relative humidity of the air in the source area [Jouzel et al., 1982; Merlivat and Jouzel, 1979].
Evidence for a Kinetic Isotope Effect
Six ice samples
were analysed
for •iD and •i•80 along the
3.5 cm vertical profile of icing I and twelve ice samples along the 5 cm vertical profile of icing II (Fig. 1). Results of these analyses are compared to analyses of ice samples from a freezing experiment and from an ice core from a small Antarctic lake situated in the Dry Valleys area. Eight ice samples are distributed over a total ice thickness of 10 cm in the experiment. Ten ice samples were taken from the 3.3 m lake ice core. Despite a difference in resolution, large ranges in •i-values exist in the different situations, making the comparison valid.
Figure 2 gives the •iD-d relationships in:
a) samples of ice resulting from a water freezing experiment [Souchez and Jouzel, 1984] with Antarctic ice meltwater having initial isotopic composition •iD = -408.8 %0, •i•80 =- 51.7 %0 (Fig. 2.a),
b) samples of lake ice from a small lake frozen to the bottom, adjacent to Suess Glacier in Taylor Valley, South Victoria Land (Fig. 2.b) and
c) samples of ice from icings in the Black Ridge area (Fig. 2.c). In the first two situations, a very good inverse linear relationship is displayed on a •iD-d diagram. This is the consequence of the alignment of sample points along a freezing slope. There is indeed a very good correspondence between the calculated freezing slope from equation (1) and the slope of the
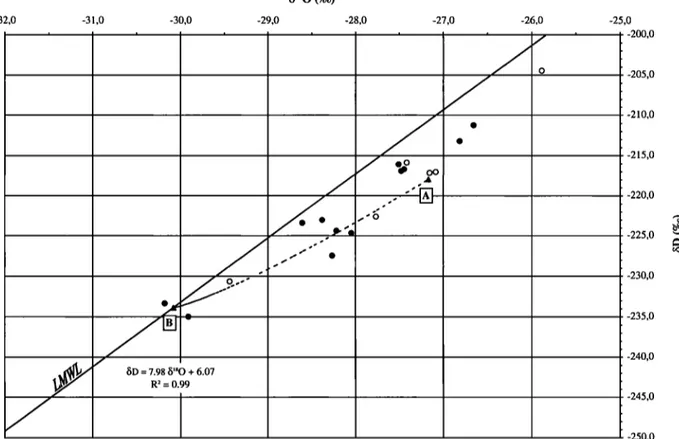
SOUCHEZ ET AL.: A KINETIC ISOTOPE EFFECT DURING ICE FORMATION 1925 -32,0 $•80 (%0) -3 ,0 -30,0 -29,0 -28,0 -27,0 -26,0 -25,0 7.98/5'sO + 6.07 R 2 = 0.99 -200,0 -205,0 -210,0 -215,0 -220,0 -225,0 -230,0 -235,0 -240,0 -245,0 -250,0
Figure
3. bD-b•80
diagram
for the icing
samples
from
the Black
Ridge
area.
Solid
line ß Local
Meteoric
Water
Line (LMWL) ß dotted
line ß Burton's equation.
are 4.32 and 4.37 for the experiment; 5.44 and 5.47 for lake ice from the Taylor Valley lake. For the latter case, the b-values of the intersection point between the local MWL and the regression
line are taken as those of the initial water. In these two situations,
the b-values generally decrease towards the base of the ice cover,
suggesting the progressive downward movement of a freezing
front. The nearly closed system formed is responsible for the impoverishment of heavy isotopes as the volume of the remaining liquid decreases.
By contrast, there is no such a linear relationship in a bD-d diagram for the icing from the Black Ridge area (Fig. 2.c). The absence of correlation and the fact that no trend is displayed in the distribution of heavy isotopes with depth in the ice cover imply:
a) non-existence of a freezing slope,
b) freezing of successive thin water layers in an open system so that equation (2) could apply.
Figure 3 shows the local MWL in the Black Ridge area determined by thirty one samples of local snow, superimposed ice and glacier ice. Also displayed in the figure are the points representing the icing samples. Except one, all of them are located below the MWL. Those with the most negative/5 values are very close to this line. The whole set of points shows a slight upward (concave up) curvature. As developed below, this is the consequence of a kinetic isotope effect.
The respective values for deuterium and oxygen 18 of the
diffusion coefficients in water at 0 øC are 1.1 10 '5 cm 2 s '• and
1.33 10
'5 cm
2 s
-• [Wang et al., 1953]. Using equation
(2) with
these values the curved dotted line of figure 3 is obtained. The isotopic composition of initial water considered in equation (2) is
taken as $D = - 233.9 %0 and b180 '- -30.1%0. These values
would correspond to the meltwater of a snow or ice sample displayed on the MWL of figure 3 as point B which is the closest point to the most negative icing samples. Position of a point on the dotted curve is dependent on the freezing rate v and/or the boundary layer thickness h. This curved line is theoretically developed between point A representing the maximum enrichment in heavy isotopes on the freezing slope taking into account the equilibrium fractionation coefficients and point B representing the initial water. For a given value of h, the point representing an ice sample is closer to the one representing the initial water if v is higher. For a given value of v, it is closer if h is greater. There is however no possible way to determine both v and h at a given situation. This is only possible in sea ice, for' which a second equation combining v and h can be derived for salinity [Eicken, 1998; Souchez et al., 1988]. If the two diffusion
coefficients
for HDO and H2•80
in water
were identical,
equation
(2) solved for deuterium and oxygen 18 would lead to a straight line between A and B in figure 3, this straight line being the freezing slope.
On figure 3, a relatively good match exists between the distribution of icing samples and the curve given by Burton's equation. Some icing samples have however less negative b-values than those of point A. Therefore, the use of equation (2) with a single initial water is not sufficient for explaining the isotopic composition of the icings. Since there is no fractionation on ice melting [Moser and Stichler, 1980], the various snow and ice samples on the MWL could produce initial waters with different isotopic compositions. A bundle of curves as defined in equation (2) which are parallel shifted along the local MWL is required to fully understand the isotopic composition of the icings.
1926 SOUCHEZ ET AL.: A KINETIC ISOTOPE EFFECT DURING ICE FORMATION Conclusion
Due to a difference in molecular diffusivities in air of HDO
and H2•80,
a kinetic
isotope
effect
exists
in a cold or mixed
cloud
[Jouzel and Merlivat, 1984].
A similar kinetic isotope effect is found to be present during the formation of icings in Antarctica. Such an effect has however not occurred during the formation of the lake ice from the Taylor Valley lake. The difference in behaviour is recorded in the/SD-d relationship.
Since diffusion
coefficients
of HDO and H2•80 molecules
in
H2160
water
are different
from each
other
by only 17 %, special
conditions are required for such a kinetic effect to take place. Freezing rate is probably the most important governing factor. Icing due to rapid freezing of meltwater produced under favourable local conditions at subfreezing air temperatures is the most likely type of ice where such an effect can be recorded. Most icings in Antarctica, because of rapid freezing, have probably this specific isotopic signature. Further implications of this study are possible for other natural phenomena such as
formation of hail in convective clouds, formation of infiltration
ice during sea ice growth and ground ice development in the active layer of permafrost.
Acknowledgements. The "Programma Nazionale di Richerche in Antardide" (PNRA) is gratefully acknowledged for having supported the field work of the first author in Terra Nova Bay in 1989-90. Thanks are also due to Antarctica New Zealand for having supported the field trip of the third author in the Dry Valleys area in 1997-98. This paper is a contribution to the Belgian Antarctic Program (Science Policy Office). References
Burton, J.A., R.C. Prim, and W.P. Slichter, The distribution of solute in crystal growth from the melt. Part I: Theoretical, J. of Chemical
Physics, 21 (1), 1987-1991, 1953.
Eicken, H., Deriving modes and rates of ice growth in the Weddell Sea from microstructural, salinity and stable-isotope data, in Antarctic sea ice: physical processes, interactions and variability, edited by M.O. Jeffries, pp. 89-122, American Geophysical Union, Washington, D.C.,
1998.
Jouzel, J., L. Merlivat, and C. Lorius, Deuterium excess in an East
Antartic ice core suggests higher relative humidity at the oceanic surface during the last glacial maximum, Nature, 299 (5885), 688-691.
1982.
Jouzel, J., and R. Souchez, Melting-refreezing at the glacier sole and the isotopic composition of the ice, J. Glaciol., 28 (98), 35-42, 1982. Jouzel, J., and L. Merlivat, Deuterium and oxygen 18 in precipitation:
modeling of the isotopic effects during snow formation, J. of Geophys.
Res., 89 (D7), 11749-11757, 1984.
Merlivat, L., and J. Jouzel, Global climatic interpretation of the deuterium-oxygen-18 relationship for precipitation, J. of Geophys.
Res., 84 (C8), 5029-5033, 1979.
Moser, H., and W. Stichler, Environmental isotopes in ice and snow, in Handbook of Environmental Isotope Geochemistry, the terrestrial environment, 1A, edited by P. Fritz, and J. Fontes, pp. 141-178,
Elsevier, New York, 1980.
Souchez, R., and J. Jouzel, On the isotopic composition in •SD and •5•80 of
water and ice during freezing, Journal of Glaciology, 30 (106), 369-
372, 1984.
Souchez, R., J.-L. Tison, and J. Jouzel, Freezing rate determination by the isotopic composition of the ice, Geophysical Research Letters, 14 (6),
599-602, 1987.
Souchez, R., J.-L. Tison, and J. Jouzel, Deuterium concentration and
growth rate of Antarctic first-year sea ice, Geophysical Research
Letters, 15 (12), 1385-1388, 1988.
Tiller, W.A., K.A. Jackson, J.W. Rutter, and B. Chalmers, The
redistribution of solute atoms during the solidification of metals, Acta
Metallurgica, 1,428-437, 1953.
Wang, J., C. Robinson, and I. Edelman, Self-diffusion and structure of liquid water. III. Measurement of the self-diffusion of liquid water with H2, H3 and O 18 as tracers, J. of the American Chemical Society,
75, 466-470, 1953.
R. Lorrain, S. Sleewaegen, R. Souchez and V. Verbeke, D6partement
des Sciences de la Terre et de l'Environnement, Facult6 des Sciences, CP 160/03, avenue F.D. Roosevelt 50, B-1050 Bruxelles, Belgium
(e-mail: glaciol@ulb.ac.be)
J. Jouzel and M. Stievenard, Laboratoire des Sciences du Climat et de
l'Environnement, UMR CEA-CNRS 1572, CEA Saclay, Orme des M6risiers, F-91191 Gif sur Yvette, France (e-mail : jouzel, misti @ lsce.saclay.cea.fr)
(Received December 16, 1999; revised March 29, 2000; accepted May 9, 2000.)