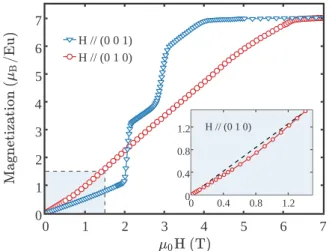
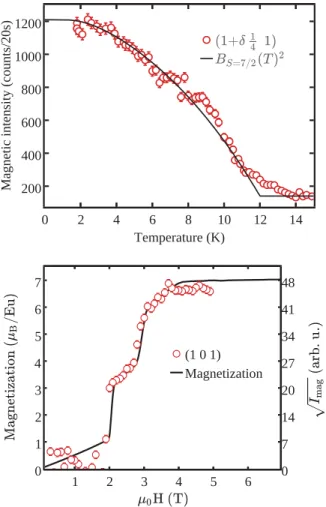
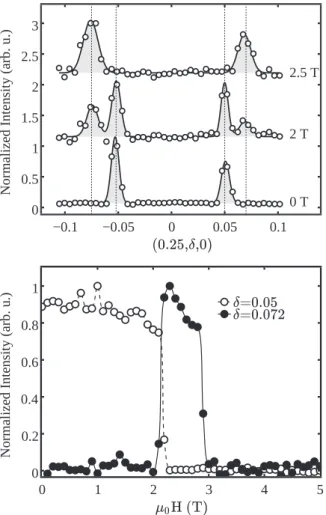
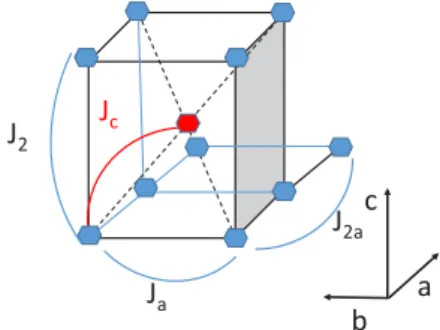
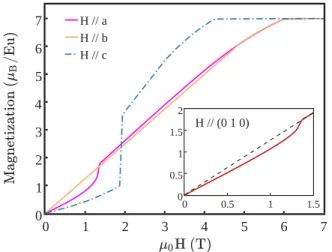
Exploring metamagnetism of single crystalline EuNiGe$_3$ by neutron scattering
Texte intégral
Figure
Documents relatifs
normative influence to reduce the consumption of hot drinks sold in to-go cups.. To that end, we
Indeed, the Situational Method Engineering [4, 5] is grounded on the assimilation approach: constructing ad-hoc software engineering processes by reusing fragments of existing
Consider an infinite sequence of equal mass m indexed by n in Z (each mass representing an atom)... Conclude that E(t) ≤ Ce −γt E(0) for any solution y(x, t) of the damped
the one developed in [2, 3, 1] uses R -filtrations to interpret the arithmetic volume function as the integral of certain level function on the geometric Okounkov body of the
[r]
What we want to do in this talk is firstly to explain when (§1) and why (§2) a presupposition trigger becomes obligatory in the very case where it is redundant, and secondly
S everal years ago, at the urging of some nonmedical friends, a small group of physicians and our spouses created a new board game called “Diagnosis.” Each player was a
F rom the beginning of medical school, I had heard many travel horror stories: the resident who had to deliver a baby at 10 000 feet; the physician who had to manage a
![When is a geode not a geode: when LSMFT? [Letters to the Editor]](data:image/gif;base64,R0lGODlhAQABAIAAAP///wAAACH5BAEAAAAALAAAAAABAAEAAAICRAEAOw==)