HAL Id: hal-02993289
https://hal.univ-lorraine.fr/hal-02993289
Submitted on 6 Nov 2020
HAL is a multi-disciplinary open access
archive for the deposit and dissemination of
sci-entific research documents, whether they are
pub-lished or not. The documents may come from
teaching and research institutions in France or
abroad, or from public or private research centers.
L’archive ouverte pluridisciplinaire HAL, est
destinée au dépôt et à la diffusion de documents
scientifiques de niveau recherche, publiés ou non,
émanant des établissements d’enseignement et de
recherche français ou étrangers, des laboratoires
publics ou privés.
Distributed under a Creative Commons Attribution - NonCommercial - NoDerivatives| 4.0
International License
Influence of intra-granular void distribution on the grain
sub-structure of UO2 pellets after high temperature
compression tests
M. Ben Saada, X. Iltis, N. Gey, A. Miard, P. Garcia, N. Maloufi
To cite this version:
M. Ben Saada, X. Iltis, N. Gey, A. Miard, P. Garcia, et al.. Influence of intra-granular void distribution
on the grain sub-structure of UO2 pellets after high temperature compression tests. Journal of Nuclear
Materials, Elsevier, 2021, �10.1016/j.jnucmat.2020.152632�. �hal-02993289�
1
Influence of intra-granular void distribution on the grain sub-structure of UO
2pellets after high
temperature compression tests
M. Ben Saada
a,b,c**, X. Iltis
a,*, N. Gey
b, A. Miard
a, P. Garcia
a, N. Maloufi
b aCEA, DES, IRESNE, DEC, Cadarache, F-13108, Saint-Paul-Lez-Durance, France.
b Laboratoire d’Etude des Microstructures et de Mécanique des Matériaux (LEM3), Université de Lorraine,
CNRS, Art et Métiers ParisTech, Metz, France
c Laboratoire MSMP-EA7351, Arts et Métiers ParisTech, 2 Cours des Arts et Métiers, 13617 Aix-en-Provence,
France
* Corresponding author:
X. Iltis
Tel: +33 4 42 25 64 97
E-mail address: xaviere.iltis@cea.fr
**
Presently at ENSAMAbstract
The aim of this work is to study the role of the intra-granular voids, on the macroscopic behavior and the microstructure of uranium dioxide (UO2) for different strain conditions in the dislocational creep regime.
Two batches (B1 and B2) of stoichiometric UO2 pellets were fabricated by adapted powder metallurgy
processes to obtain very close mean grain size and porosity but different fractions of intra-granular voids: they were 2.5 times more numerous in the second batch. The pellets were then compressed at 1773 K mostly in the dislocational regime for different strain levels and strain rates. Large Electron BackScattered Diffraction (EBSD) maps were acquired to quantify the sub-boundaries fraction in each deformed sample (with reliable detection of disorientation lines down to 0.25°). Accurate-Electron Contrast Channeling Image (Accurate-ECCI) experiments were also performed to evidence the arrangement of dislocations in the sub-boundaries and highlight their interaction with intra-granular voids. The fractions of sub-boundaries and their disorientation increased in both batches with increasing strain levels and strain rates. This confirms that during creep, UO2 is
subject to a dynamic recovery mechanism. Interestingly, for similar deformation conditions, the pellets from batch B2 crept slower than those from batch B1. They also had a higher fraction of sub-boundaries which were more tortuous and located essentially close to the grain boundaries where the voids clustered. This suggests an influence of intra-granular voids on the creep rate, probably due to a void pinning effect of dislocation sub-boundaries. This effect should be taken into account to optimize the microstructure and mechanical properties of UO2 nuclear fuel, in order to improve its behavior under irradiation.
Keywords:
2
1. Introduction
Numerous studies were carried out for about sixty years now, to understand the microstructural evolution of sintered uranium dioxide (UO2) fuel commonly used in pressurized-water nuclear reactors (PWRs). Some of
these studies particularly addressed its behavior during power transients, where temperatures of the order of 1773 K or even more can be reached in the central part of the pellets [1-5]. Under such conditions, the pellets undergo a visco-plastic deformation driven by creep mechanisms. These mechanisms were mainly studied by using as fabricated pellets by means of compression creep tests at high temperatures [3, 6-9]. These studies showed that the macroscopic mechanical behavior of UO2 is significantly influenced by the strain conditions
(temperature [10], strain rate [3, 11, 12], etc.) and also by the initial microstructure of the ceramic pellet like grain size, composition etc. [8, 13-14]. To our knowledge, very few studies address the role of intra-granular voids on deformation. They mostly focus on modeling interactions between dislocations and voids and never concern UO2 [15-18]. In addition, the microstructure of deformed UO2 samples was characterized only
qualitatively by evidencing the intra-granular sub-structure by means of Scanning Electron Microscopy (SEM) and Transmission Electron Microscopy (TEM) [3, 6, 8, 11, 19]. Recently, the Electron BackScattered Diffraction (EBSD) technique was applied on crept UO2 pellets [9, 20] and pointed out a sub-structure development
process within UO2 grains in the dislocational creep regime. However, the number of samples characterized in
these studies was limited and the smallest disorientation angles detected by EBSD did not fall below 0.5°. This probably underestimated the reality since sub-boundaries with a disorientation angles less than 0.5° are very likely to be present and have to be considered playing an important role in the creep mechanisms.
The aim of this work is to study the role of the intra-granular voids, on the macroscopic behavior and the microstructure of uranium dioxide (UO2) for different strain conditions in the dislocational creep regime. For
this purpose, two batches of stoichiometric UO2 pellets, characterized by a similar void volume fraction but
with different intra-granular void distributions, were manufactured. Pellets from each batch were deformed by uniaxial compression tests at 1773 K at different strain conditions. The deformed samples were characterized using an optimized protocol detailed in [21], for EBSD data acquisition and processing, to detect and quantify sub-boundaries with very low disorientation angles. This protocol was applied first on one batch of pellets and the corresponding results are presented in [22]. It allowed to quantify the evolution of sub-structure after deformation, in particular the linear fraction of sub-boundaries, from large EBSD maps, according to test conditions. The same protocol was applied on the second batch of pellets. In addition to that, in order to get new clues about the influence of the void distribution (mainly intra-granular voids remaining within the grains after sintering), EBSD maps at high magnification and Accurate-Electron Contrast Channeling Images (Accurate-ECCI) were also acquired on deformed samples.
2. Experimental 2.1. Materials
2.1.1. Manufacturing process
Two batches of stoichiometric UO2 pellets, named respectively, B1 and B2, were manufactured in order to
obtain two microstructures that differ only by their intra-granular void distributions. Pellets were made from similar UO2 powders obtained by a dry route process from the same source, but that used to manufacture the
batch B2 was de-agglomerated by crushing before pressing. The powders were pressed isostatically under 50 MPa, crushed in a mortar and sieved with a 450 µm sieve. They were then pressed uniaxially under 450 MPa to obtain green pellets with a density of about 55% of the UO2 theoretical density (10.96 g.cm-3). The sintering
heat treatment was performed under 95% Ar + 5% H2 atmosphere, to ensure the pellets stoichiometry. Pellets
of batch B1 were sintered at 2053 ± 20 K for 5.5 h, while the pellets of batch B2 were sintered at 1943 ± 20 K for 4 h. The obtained pellets had a diameter of 8 mm and a height of about 15 mm. The sintering temperature was lower for B2 because the powder used for batch B2 was de-agglomerated. Indeed, the de-agglomeration process increases the specific surface area and the reactivity of the powder and, consequently, the sintering
3
rate. For both batches, the density obtained for the pellets was of 98.1% ± 0.07% of the UO2 theoretical
density, with a closed porosity of 1.7% ± 0.1%, stated by an immersion method. Hereafter, the reference pellets (as-sintered) of batch B1 and B2 are named as B1-R and B2-R, respectively. The same designation is used for the samples cut from these pellets.
2.1.2. Characterization of the as-sintered samples: Grain size and void distribution
Fig. 1 shows SEM micrographs of samples B1-R and B2-R, taken in BackScattered Electron (BSE) imaging mode. Both samples have close mean grain size but differ by their number of intra-granular voids (being more numerous in B2). In Fig. 1, the grains are evidenced by differences in grey levels. The fabrication voids, remaining after sintering, are visible in black in intra-and inter-granular locations. Intra-granular voids are smaller and more numerous than the inter-granular ones. The number of intra-granular voids in B2-R is significantly higher than in B1-R (see in particular Fig. 1c and 1d).
The grain size of each sintered batch was further determined from EBSD data, as described in [22]. The mean Equivalent Circular Diameters (ECD) 1 were 15 µm (± 1 µm) and 12 µm (± 1 µm), respectively, for B1-R and B2-R. For this analysis, the critical disorientation angle corresponding to a grain boundary was set at 5°, knowing that very few low-angle boundaries (with disorientation comprised between 2° and 5°) were present in as-sintered UO2 samples.
The fabrication voids were also quantified using AnalySIS image software. This software provides results in the form of a table containing information related to each detected void (DCE, number, etc.). The results are summarized in Table 1 and show that the number of intra-granular voids are approximately 2.5 times higher in B2-R than in B1-R. These results are obtained from six BSE images per sample, acquired at high resolution (6144 x 4096 pixels). Each image covering a surface of about 11000 µm2. The binarized image allowed to obtain information about the whole porosity. The inter-granular voids were obtained by superimposing the grain boundaries network, previously drawn on the initial BSE image using a graphic tablet, on the binarized image. Finally, the intra-granular voids were obtained by inter-granular voids substraction from the total porosity. Given the pixel size of 0.022 µm, the smallest voids detected have a minimum ECD of 0.07 μm (those which have an ECD less than three times the size of the pixel being disregarded).
From Table 1, a difference in total surface fraction of voids for B1-R and B2-R samples (1% and 2.5% respectively) is to be noticed. The total surface fraction of voids was expected to be the same for the two batches since they
had the same closed porosity (1.7% ± 0.1%), according to the measurements
performed by immersion
. This difference is mainly related to sampling effect when acquiring the BSE images. Indeed, the surface fractions deduced from the image analysis was determined from six images per sample acquired at a relatively high magnification (to detect small intra-granular voids) and representing a total surface of 0.066 mm2. This effect has a little impact on the quantification of intra-granular voids, since they are homogeneously distributed, contrary to the inter-granular ones. In the case of the intra-granular voids, there is only a risk of underestimating their population, due to the pixel size which limits the detection of the smallest of them, but this risk is the same for the two batches. The sampling effect has a much greater impact on the results related to inter-granular voids, and, consequently, those related to the total porosity. Indeed, the number of inter-granular voids is much lower than the intra-granular ones, and these voids are bigger and more unevenly distributed, especially in the case of batch B1 (as illustrated in Fig. 1). This is at the origin of the void fraction difference when quantified by image analysis on a limited sample area and by immersion method. Despite of this difference, the obtained results are sufficiently reliable to conclude that intra-granular voids are1
The Equivalent Circular Diameter (ECD) of an object represents the diameter of a disc that occupies the same area as that object.
4
2.5 times more numerous in B2-R than in B1-R batch. Their average size (expressed in ECD) is almost identical: approximately 0.4 μm.
(a) (b)
(c) (d)
Fig. 1. SEM micrographs in BSE mode of the reference samples (as-sintered) (a) B1-R and (b) B2-R. (c) and (d) zoom of the black-boxed grains in (a) and (b) respectively.
Table 1
Void distribution in the reference samples B1-R and B2-R (statistics obtained by image analysis over a surface containing about 400 grains).
B1-R B2-R Surface fraction of voids (%) Number of voids per mm2 Average ECD (µm) Surface fraction of voids (%) Number of voids per mm2 Average ECD (µm) Total porosity 1.0 ~ 68000 0.44 2.5 ~ 175000 0.42 Intra-granular voids 0.6 ~ 63000 0.35 1.8 ~ 163000 0.37 Inter-granular voids 0.4 ~ 5000 1.11 0.7 ~ 12000 0.88 2.2. Mechanical tests
Pellets from each batch were deformed by uniaxial compression creep tests at 1773 K, under the same atmosphere as used for sintering (95% Ar + 5% H2),thereby ensuring their stoichiometry. All the compression
tests were performed in an adapted furnace on a screw-type Instron compression test machine. Two types of compression tests were performed:
Tests at imposed constant strain rate: Nine pellets from the batch B1 (referenced B1-D1 to B1-D9) and from the batch B2 (referenced B2-D1 to B2-D9) were deformed by displacing the moving crosshead of the machine at an imposed constant speed (varying from 1 µm/min to 100 µm/min, depending on the test) until a given strain level was reached. This strain was measured thanks to two LVDT (Linear Voltage Differential Transducer) sensors. Tests conditions were chosen to deform pellets in the dislocational creep regime (at high stress).
5
In order to explore lowest values of strain rate, a limited number of tests was performed at imposed low constant stress (tests performed at constant strain rate or at constant load being considered, to first order, as equivalent in stationary creep regime).
Tests at imposed constant stress (creep tests): Two pellets each from batch B1 (B1-D10 and B1-D11) and batch B2 (B2-D10 and B2-D11) were deformed at an imposed constant stress of 12 and 20 MPa, respectively.
These creep tests were performed in order to deform pellets in the diffusional creep regime (at low stress). It is worth noting that, in these conditions, the deformation rate is very low and the tests last for several days.
Complementary details concerning the testing machine characteristics and the testing procedure are given in [23, 24]. The cooling rate, after all tests, was 17 K per minute.
Table 2 summarizes the compression test characteristics of all these pellets. Stress values for tests at imposed strain rate were determined by considering the load at the end of the test and the mean section of the pellet measured a posteriori, taking into account thermal dilatation.
Table 2
Main characteristics of mechanical tests.
Pellet designation Stress (MPa) Strain rate x10-6 (s
-1)
Strain level (%) Duration of the test
Batch B1
B1-R 0 0 0
At imposed strain rate
B1-D1 45 20 3 37 min B1-D2 46 20 5.1 1 h B1-D3 40 20 7 1 h 19 min B1-D4 46 20 9.4 1 h 28 min B1-D5 48 20 11 1 h 41 min B1-D6 43 5 7 5 h 20 min B1-D7 54 40 7 33 min B1-D8 37 5 10 6 h 10 min B1-D9 52 70 11 28 min At imposed stress B1-D10 12 0.005 0.48 114 h B1-D11 20 0.02 0.88 66 h 20 min Batch B2 B2-R 0 0 0
At imposed strain rate
B2-D1 60 20 5.1 1 h B2-D2 66 20 7.2 1 h 10 min B2-D3 63 20 11 1 h 26 min B2-D4 40 1 6.6 20 h 25 min B2-D5 51 5 6.3 4 h 10 min B2-D6 51 5 11.2 7 h 14 min B2-D7 71 70 11 30 min B2-D8 71 100 11 23 min B2-D9 72 100 16 31 min
6
At imposed stress
B2-D10 12 0.02 0.78 92 h
B2-D11 20 0.022 2.6 230 h
2. 3. Characterization of the deformed samples: EBSD and Accurate-ECCI analysis
A longitudinal slice (i.e. parallel to the compression direction) was cut from the central part (the most deformed area) of the reference pellets (as-sintered) and of the crept ones. The obtained samples were then polished to achieve a suitable surface state for the SEM examinations.
EBSD maps were acquired in a FEI NovaNano SEM equipped with a Nordlys Nano II camera from Oxford Instruments (in 2x2 binning mode, i.e. 672x512 pixels). The EBSD data were obtained with an accelerating voltage of 20 kV and a working distance of 15 mm using “refined accuracy mode” in AZTEC. Large scale EBSD maps (500 x 344 μm), covering around 1000 grains, were acquired with a step size of 0.4 µm. Their indexing rate was more than 98%. The EBSD maps were then post-treated and analyzed with the Channel 5 software, using the optimized protocol presented in [21], to quantify reliable low angle boundaries in porous material. Low disorientation angles down to 0.25° were quantified on EBSD maps. The critical disorientation angle chosen to define a grain boundary in UO2 material was set at 5°. Thus, the term "Sub-grain boundaries or
sub-boundaries" refers to all lines corresponding to angular disorientations comprised between 0.25° and 5°. Such sub-boundaries appear inside the prior grains during compression tests. Sub-grain sizes were also quantified from EBSD maps. The procedure to evaluate the sub-grains proceeds in two steps considering an upper and lower threshold angle set here to 0.25° and 0°, respectively [22, 25]. Finally, in order to explore sub-boundaries induced by creep and contrast their dislocation arrangements, Accurate-ECC images were acquired with a Zeiss Auriga 40 FEG-SEM equipped with a GEMINI-type electron column (with an accelerating voltage of 20 kV, a beam current of 550 pA and at a working distance of 7 mm) [26-28].
3. Results and discussion
3. 1. Macroscopic mechanical behavior
Differences in visco-plastic behavior were evidenced between batches B1 and B2, as it is clearly illustrated by the graph in logarithmic coordinates of the creep strain rate as a function of the applied stress (Fig. 2). Especially at high stresses, the batch B1 (with the lower amount of intra-granular voids) creeps faster than B2.
The following equation is usually applied to express the relation between the strain rate and applied stress:
(1)
where " " is a constant characterizing the fuel microstructure (it is a function of the grain size, the porosity, the deviation from the stoichiometric composition, etc.), "n" is the stress exponent, " " is the activation energy, and "T" the absolute temperature [29]. This graph ( ), plotted in logarithmic coordinates, is commonly used to determine the transition stress "σt" and the stress exponent "n" of the creep law, in the diffusional (low
7
Fig. 2. Strain rate as a function of stress at 1773 K for B1 and B2 pellets.
The transition stresses (σt)were found to be approximately 23 MPa and 25 MPa for batches B1 and B2,
respectively (Fig. 2). These values are very close and tainted by a high degree of uncertainty, related to the low number of points acquired in the diffusional domain. Despite this, they are in good agreement with literature data dealing with UO2 pellets with similar mean grain sizes [29, 30].
In the low stress domain (σ < σt), the values of the stress exponent n are about 2.5 and 0.8 for B1 and B2,
respectively. These values are only estimative as only two experimental points per batch are available in this domain. They are still consistent with literature where 1 ≤ n ≤ 3 is generally considered for diffusional creep of UO2 [7, 12, 31]. However, it is difficult to assess the predominant diffusion mechanism in this domain. Since
pellets from B1 are characterized by a lower creep rate and have a mean grain size slightly larger than that of pellets from B2, a Coble creep mechanism implying diffusion along grain boundaries [32] could come into play, as proposed in [29].
The behavior of the two microstructures is reversed in the high stress domain (σ > σt): the batch B1 creeps
faster than B2. Indeed, all the experimental points relating to the mechanical tests carried out on B2 are below those of B1. The stress exponent n was estimated at 5.7 and 7.2, for B1 and B2, respectively. These values of n belong to the interval [4-10] defined in the literature as typical of the dislocational creep regime for UO2 [3, 7,
12, 31].
According to some authors, in this domain, the creep strain rate increases with the grain size [8, 29]. This tendency is confirmed for batches B1 and B2, as pellets from the batch B1 (mean grain size: 15 µm) deform quicker than those from the batch B2 (mean grain size: 12 µm). However, the difference found in our study seems important given the small grain size difference between the two batches. For example, Vivant-Duguay [29] found that, at 50 MPa, the strain rate was multiplied by 9 when the grain size varied from 11 to 26 μm. In our case and also at the same stress of 50 MPa, the strain rate was found to be higher by a factor 10 even for a small difference of grain size of 3 microns between the samples. It is therefore likely that other factors also come into play to induce this difference. Void distribution could be one of these factors. Accurate-ECCI and EBSD at high magnification were used to highlight the interactions between sub-boundaries dislocation networks and voids.
3. 2. Accurate-ECCI and EBSD analyses at high magnification
Accurate-ECCI micrographs presented in Fig. 3 shows dislocations (in white) in the vicinity of the voids (in black) and their arrangement in sub-boundaries. These images were acquired at high magnification on several
8
deformed samples of both batches. Different dislocation arrangements with hexagonal or square cells are observed. Moreover, in many cases, the sub-boundaries adopt a tortuous path due to multiple pinning on mainly intra-granular voids (see red arrows in the images, for example). This highlights the contribution of voids in the setting up of the sub-boundaries network.
Fig. 3. Accurate-ECCI images showing interactions between voids and dislocations arranged in sub-boundaries.
Additional EBSD maps were acquired with a step size of 0.2 µm to highlight the network of sub-boundaries in relation to the spatial distribution of intra-granular voids. For these maps, the angular resolution was improved in order to detect the boundaries with very low-angle down to 0.1°. All sub-boundaries can be further detected and located relative to the voids, even the smallest ones, thanks to the corresponding BSE images.
Fig. 4 shows some such EBSD maps and the corresponding BSE images for samples B1-D6 and B2-D5, which were deformed with a strain rate of the order of 5 x 10⁻⁶ s-1 up to a final strain level of around 7%. The same type of sub-structure formation was noticed in both B1 and B2 samples. During the compression tests, dislocations appeared at the vicinity of grain boundaries. Then, they migrated inwards grains and rearranged to create sub-boundaries, subdividing the initial grains into sub-grains. The sub-boundaries are generally continuous and homogeneously distributed within the grains in B1 (Fig. 4a). In B2, they are often more tortuous and located near the grain boundaries where intra-granular voids are clustered (Fig. 4b). The sub-boundaries seem to be often anchored on relatively large intra-granular voids.
9
(a)
(b)
Fig. 4. EBSD maps and corresponding BSE images acquired, respectively on the samples (a) B1-D6 and (b) B2-D5 at high magnification.
3. 3. Quantitative evolution of sub-boundaries
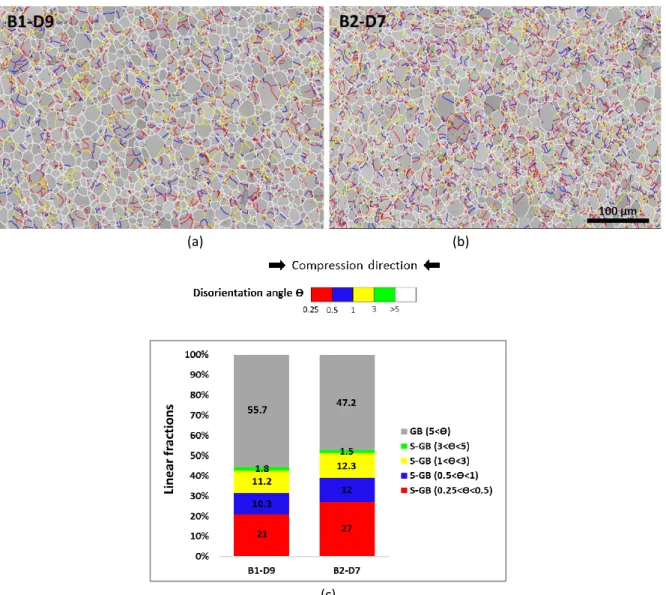
Large EBSD maps were acquired on all deformed samples to quantify the evolution of the grain sub-structure with strain conditions. Fig. 5 shows the misorientation maps acquired on the samples B1-D9 and B2-D7, deformed under the same strain conditions and the linear fractions2of sub-boundaries and grain boundaries associated to different disorientation classes. For batch B1, all maps and related analysis are already presented in [22] and some of those corresponding to batch B2 are presented in Appendix A.
10
(a) (b)
(c)
Fig. 5. Sub-boundaries distribution inside the grains: (a), (b) EBSD maps acquired, respectively in the samples B1-D9 and B2-D7 deformed under the same strain conditions (strain rate: 70 x 10-6 s-1, strain level: 11%), (c) Linear fractions of grain boundaries (GB) and sub-grain boundaries (S-GB), considering all disorientation lines
with angles > 0.25°.
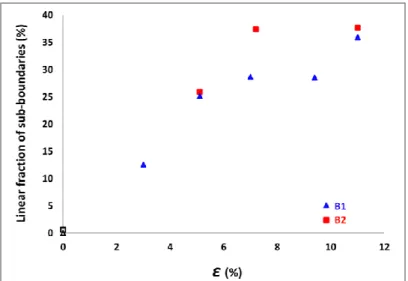
Fig. 6 and 7 present the evolution of linear fractions of sub-boundaries with the strain level and the strain rate for both batches. After only 3% of deformation, the fraction of sub-boundaries with disorientations lower than 5° reaches 13% in the case of the sample B1-D1 as shown in Fig. 6. When increasing strain level, the linear fraction of sub-boundaries increases to reach 25% and 26% for B1-D2 and B2-D1, respectively (Fig. 6).
All the microstructural observations and the quantification of linear fractions show that when the deformation increases, a network of very low disoriented boundaries appears and the disorientation of the sub-boundaries already present increases. This microstructural evolution was extensively discussed in [22]. It is often called “dynamic recovery" and implies a progressive rotation of sub-grains [33-36]. At moderate deformation levels, the combination of hardening processes (by increasing the number of dislocations) and dynamic recovery (by migration and organization of these dislocations in networks) takes place [37].
Under the same conditions, the deformed samples from the batch B2 (with the higher fraction of intra-granular voids and a lower creep rate) systematically present a linear fraction of sub-boundaries which is clearly greater than that of batch B1 (Fig. 6 and Fig. 7). This difference is more striking at high strain rate, as illustrated in Fig. 7b. This statistical analysis of the setting up of sub-boundaries with strain level and strain rate shows that
11
both batches behave differently. Indeed, these microstructural results are consistent with the differences already obtained in macroscopic behavior at high strain rate and stress (as illustrated in Fig. 2).
Fig. 6. Evolution of the linear fraction of sub-boundaries with the strain level in the two batches (data obtained from large EBSD maps considering the disorientation between [0.25°-5°[). All the pellets were deformed with the same strain rate of the order of 20 x 10-6s-1. The black markers correspond to the reference samples B1-R
and B2-R.
12
(b)
Fig. 7. Evolution of the linear fraction of sub-boundaries with the strain rate in the two batches. Strain levels are of the order of (a) 7% and (b) 11%, respectively.The black markers correspond to the reference samples B1-R and B2-R (data obtained from large EBSD maps considering the disorientations between [0.25°-5°[). 3. 4. Quantitative analysis of the effect of intra-granular voids on sub-structure
Fig. 8 presents the sub-grain size evolution with the strain level
.
In order to minimize the difference
in grain size between the two samples (15 and 12 μm, respectively in B1-R and B2-R) and make them
more comparable, we chose to consider only grains with an ECD larger than 15 μm. This allowed to
reduce the difference of mean grain sizes between the two batches from 25% to 4.5% (when
considering only these large grains).
Within the same batch, when the strain level increases, the sub-grains size decreases. This is fully consistent with the fact that the number of sub-boundaries increases with the deformation. With increasing deformation, the mean sub-grain size stabilizes and reaches a plateau with values of about 9 μm for B1, and 6 μm for B2.Fig. 8. Evolution of the mean sub-grain size with the strain level. The black markers correspond to the prior grain size in both batches (calculated from the large EBSD maps considering only detected grains with an
ECD>15µm).
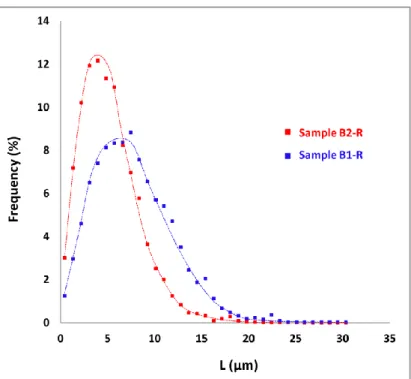
For comparison purpose, the average spacing (or mean intercept) between the grain boundaries and the voids, in each microstructure, was measured using an image analysis module developed in the Aphelion software.
13
This work was carried out on the six images per sample already used for the voids characterization (cf. section 2.1). The obtained results for the two microstructures are shown in Fig. 9. The average intercepts are about 8 µm and about 5 µm for B1-R and B2-R, respectively. Interestingly, those values are in the same range calculated for sub-grain size after deformation as shown in Fig. 8. This observation of smaller intercept in the microstructure of B2-R sample is entirely consistent with its higher number of intra-granular voids than B1-R. The similarity between the mean intercept size and sub-grain size further supports that the void distribution influences on first order the rearrangement of dislocations on sub-boundaries.
Fig. 9. Distribution of the mean intercepts for the two reference microstructures taking into account the grain boundaries and the voids.
The results obtained by authors from the mean intercepts and the previously presented EBSD maps and Accurate-ECCI micrographs show that the voids have a marked influence on the distribution of sub-grain boundaries. Possible interactions between voids and isolated dislocations have to be considered first. For such an interaction between a dislocation and a void to occur, the migration of one of them or both are necessary. According to Gill [38], the voids migration process requires a strong thermal gradient, which does not exist in our compression tests. In addition, we did not observe a significant change in void size, following mechanical tests, which tends to indicate that they did not coalesce or might have coalesced only slightly. This indicates that they did not migrate or, even it they had migrated, only by a very small distance. On the other hand, the movement of dislocations is made possible by the stress and the temperature. According to our observations and the literature [39], during the deformation, the dislocations are created preferentially in the vicinity of the grain boundaries, because of the incompatibilities of deformation between grains, and then they migrate.
At high temperature, the movement of dislocations involves the movement of vacancies, which can either diffuse to the voids or be emitted by them. In addition, the free surface of a void wall can lead to a local relaxation of stress, which could have an attractive effect on dislocations [40]. Moreover, Ohashi has shown from his model of crystalline plasticity that dislocations can multiply around the voids [18]. All these mechanisms converge towards a tendency for dislocations to concentrate near the voids. This effect has indeed been observed in the B2 microstructure, which contains a lot of intra-granular voids.
In the deformed UO2 samples, most of the dislocations are organized into networks creating sub-boundaries to
sub-14
boundaries are likely mobile, as it has been shown in the case of aluminum thanks to TEM in-situ experiments [41]. As the isolated dislocations, the sub-boundaries would tend to concentrate at the vicinity of the voids for the various reasons previously mentioned. The observations made on batch B2 have effectively revealed the presence of numerous sub-boundaries around the voids. A pinning effect which has clearly been highlighted on Accurate-ECC images (Fig. 3, red arrows) comes also into play. Such an effect is probably similar to that induced by the presence of micro-precipitates in metallic alloys (see for example [42]).
In summary, from the above results, the following global scenario can be proposed: during the compression test, dislocations appear at the vicinity of the grain boundaries. Then, they migrate inwards grains and rearrange to create sub-boundaries. In the case of batch B2, dislocations and sub-boundaries are often pinned between the intra-granular voids, which limit their mobility. As a result, the majority of sub-boundaries are formed near the initial grain boundaries. In addition, the void distribution within grains is not homogeneous: they are generally clustered together. The sub-boundaries network seems to be developed in the areas of high void concentration, and is mainly formed by short and tortuous sub-boundaries with very low disorientation angles. In the case of batch B1, the movement of dislocations and sub-boundaries within grains is easier because of the lowest number of intra-granular voids in this microstructure. As a result, the sub-boundaries are more grain-crossing. Since batch B2 presents more intra-granular voids, the pinning effect of dislocations and sub-boundaries is more significant in the deformed pellets. This creates a deformation resistance at high temperature, which could partially explain why this pellet crept a little bit slower than B1 in the dislocational creep regime (see Fig. 2).
5. Conclusion
The role of the strain conditions and the intra-granular voids on the macroscopic and microscopic behavior of uranium dioxide (UO2) sintered pellets has been studied in the dislocational creep regime. Two batches of
stoichiometric UO2 pellets, named B1 and B2, were manufactured. They were characterized by a close grain
size (15 µm (± 1 µm) and 12 µm (± 1 µm), respectively for B1 and B2), a same closed voids volume fraction (about 1.7%) but they had significantly different intra-granular void distribution. There were 2.5 times more intra-granular voids in batch B2 than in batch B1. Pellets from each batch were deformed by uniaxial compression tests at 1773 K under different strain conditions. Linear fraction of sub-boundaries were quantified from large EBSD maps, to analyze the sub-structure evolution according to the test condition and to study the role of the void distribution on the grain sub-structure.
The study of the influence of the deformation conditions on B2 microstructure reveals the same general trends of evolution as in the case of batch B1: the number as well as the linear fraction of sub-boundaries increase with the strain rate and the strain level. For high strain rate and/or strain level of deformation (from 11% and 70 x 10- 6 s-1 in the case of the two microstructures), the misorientation angles of sub-boundaries already formed in the material increase whereas new sub-boundaries with very low misorientation angles appear. These evolutions are typical of dynamic recovery mechanism. Several significant differences were found between the two microstructures at the grain and sub-grain scales. Indeed, for similar test conditions, the deformed pellets from batch B2 have a number and a linear fraction of sub-boundaries which are both clearly higher than those encountered in pellets from batch B1. In addition, the distribution of these sub-boundaries is rather homogeneous within the grains in the samples of batch B1 whereas, in the case of the samples of batch B2, the sub-boundaries are tortuous and located essentially close to the grain boundaries. These differences are related to the presence of numerous intra-granular voids clustered close to the grain boundaries in B2. They limit the movement of dislocation sub-boundaries within the grains by pinning them. A hardening effect and a decrease in creep rate could thus be induced by numerous small intra-granular voids in UO2 pellets. That
is why these effects should be taken into account to optimize the microstructure and mechanical properties of this nuclear fuel.
15
Appendix A. Quantitative study of the microstructural evolutions in batch B2 A. 1. Influence of the strain level
Fig. A. 1 presents the EBSD maps acquired on the reference sample (B2-R) and three of the deformed ones (referenced B2-D1 to B2-D3) from the batch B2. These three pellets were deformed under the same strain rate of the order of 20 x 10-6 s-1 up to an average strain level ranging from 5.1 to 11%.
EBSD map performed on the reference sample (Fig. A. 1a) allowed checking the absence of sub-boundaries. Actually, few lines with disorientations less than 5° were evidenced. They did not correspond to sub-boundaries but in fact to rare low angle grain boundaries with disorientations of the order of 3° present in the microstructure after sintering.
Deformation induced the birth of a network of sub-boundaries inside the prior UO2 grains, as illustrated in
Fig. A. 1b to A. 1d. This network was further quantified by calculating the linear fraction of sub-boundaries associated to the different disorientation classes (Fig. A. 2). In the reference sample, most of the boundaries (99.4%) exhibit disorientations higher than 5°. The linear fraction of sub-boundaries increases significantly when the strain level increases: it reaches about 26% and 37.7% when the strain level reaches about 5.1% and 11%, respectively.
Between 7.2% and 11% of deformation (samples B2-D2 and B2-D3), the linear fraction of sub-boundaries increases only slightly. This near saturation of the population of sub-boundaries could be related to the establishing of quasi-stationary conditions between creation and annihilation of dislocations.
(a) (b)
(c) (d)
Fig. A. 1. EBSD disorientation maps obtained on the reference and deformed samples: B2-R, B2-D1, B2-D2, and B2-D3. The background level is given by the Kikuchi Pattern Quality index; non-indexed points are drawn in black and correspond mainly to the fabrication voids. The white lines correspond to the prior grain boundaries
16
Fig. A. 2. Linear fractions of sub-grain boundaries (S-GB) measured by EBSD (filtered data) on the reference (B2-R) and deformed samples (B2-D1 to B2-D3).
A. 2. Influence of the strain rate
Two groups of three pellets from the batch B2 were deformed under different strain rates ranging from 1 x 10
6s- 1 to 100 x 10-6 s-1 to reach mean strain levels of about 7% and 11%, respectively. The results show that the
linear fraction of sub-boundaries increases with the strain rate in each disorientation class, in the group which was deformed up to 7% (Fig. A. 3a). No saturation of the population of sub-boundaries is observed, whatever may be their disorientation classes.
If we focus now on the results of the sample B2-D8 deformed at 100 x 10-6 s-1, we notice that there is no longer an increase in the linear fraction of sub-boundaries, but rather a slight decrease for the two classes corresponding to the lowest disorientations, compared to the test performed at 70 x 10-6 s-1(sample B2-D7). Indeed, the sample B2-D8 has a linear fraction of sub-boundaries which belong to classes [0.25-0.5°[ and [0.5-1°[ lower than those of sample B2-D7. Conversely, the linear fraction of sub-boundaries which belong to classes [1-3°[ and [3-5°[ increases. In addition, an increase of the linear fraction of grain boundaries from the class [5-15°[ (not represented in the figure) is observed : from 1.6% in the sample B2-D7 to 2.4% in the sample B2-D8. From the above results one can conclude that there is a saturation effect of the population of sub-boundaries. In fact, new sub-boundaries would no longer be formed, but existing ones would evolve towards increasing disorientation until it exceeds 5°, the threshold at which sub-boundaries in UO2 are counted as grain
boundaries.
17
(b)
Fig. A. 3. Linear fractions of sub-grain boundaries (S-GB) measured by EBSD (filtered data) on the reference (B2-R) and deformed samples (a) B2-D1 to B2-D3 and (b) B2-D6 to B2-D8.
18
References:
[1] S. Aas, Mechanical interaction between fuel and cladding, Nucl. Eng. Des. 21 (1972) 237-253.
[2] J.N. Wang, T.G. Nieh, A new interpretation of the mechanisms in Newtonian creep of uranium dioxides, J. Nucl. Mater. 228 (1996) 141-147.
[3] F. Dherbey, F. Louchet, A. Mocellin, S. Leclercq, Elevated temperature creep of polycrystalline uranium dioxide: from microscopic mechanisms to macroscopic behaviour, Acta Mater. 50 (2002) 1495-1505.
[4] J. Gao, X. Yang, R. Li, Y. Wang, F. Zhong, Low-temperature sintering mechanism on uranium dioxide, J. Mater. Sci. 42 (2007) 5936-5940.
[5] B. Michel, J. Sercombe, C. Nonon, O. Fandeur, Modeling of pellet-cladding interaction, Compr. Nucl. Mater. 3 (2012) 677–712.
[6] C.S. Yust, J.T.A. Roberts, On the observation of lattice and grain boundary dislocations in UO2 deformed at
high temperature, J. Nucl. Mater. 48 (1973) 317-329.
[7] D.B. Knorr, R.M. Cannon, R.L. Coble, An analysis of diffusion and diffusional creep in stoichiometric and hyper-stoichiometric uranium dioxide, Acta metall. 37 (1989) 2103-2123.
[8] B. Burton, G.L. Reynolds, J.P. Barnes, The influence of grain size on the creep of uranium dioxide, J. Mater. Sci. 8 (1973) 1690-1694.
[9] X. Iltis, M. Ben Saada, H. Mansour, N. Gey, A. Hazotte, N. Maloufi, A new characterization approach for studying relationships between microstructure and creep damage mechanisms of uranium dioxide, J. Nucl. Mater. 474 (2016) 1-7.
[10] Y. Guérin, Etude par compression à hautes températures de la déformation plastique du bioxyde et du monocarbure d’uranium, PhD Thesis, Université Claude Bernard de Lyon, France, 1973.
[11] W.M. Armstrong, W.R. Irvine, R.H. Martinson, Creep deformation of stoichiometric uranium dioxide, J. Nucl. Mater. 7 (1962) 133-141.
[12] M.S. Seltzer, J.S. Perrin, A.H. Clauer, B.A. Wilcox, A Review of Creep Behavior of Ceramic, Reactor Technol. 14 (1971) 99-135.
[13] J. Philibert, Creep and diffusion, Solid State Ion. 12 (1984) 321-336.
[14] A. Hough, Compressive creep in nuclear oxides, Report AERE-R-13232, Chemistry Div, 1988.
[15] S. Queyreau, G. Monnet, B.D. Wirth, J. Marian, Modeling the dislocation-void interaction in a dislocation dynamics simulation, Symposium P-Deformation Mechanisms, Microstructure Evolution and Mechanical Properties of Nanoscale Materials 1297 (2011) 10-61.
[16] A. Simar, H.J.L. Voigt, B.D. Wirth, Molecular dynamics simulations of dislocation interaction with voids in nickel, Comput. Mater. Sci. 50 (2011) 1811-1817.
[17] P. Shanthraj, M.A. Zikry, Dislocation-density mechanisms for void interactions in crystalline materials, Int. J. Plast. 34 (2012) 154-163.
[18] T. Ohashi, Crystal plasticity analysis of dislocation emission from micro voids, Int. J. Plast. 21 (2005) 2071– 2088.
[19] A. Alamo, J.M. Lefebvre, J. Soullard, Déformation plastique du bioxyde d'uranium: Observation des sous-structures de dislocations, J. Nucl. Mater. 75 (1978) 145–153.
[20] X. Iltis, N. Gey, C. Cagna, A. Hazotte, Ph. Sornay, Microstructural evolution of uranium dioxide following compression creep tests: An EBSD and image analysis study, J. Nucl. Mat. 456 (2015) 426-435.
19
[21] M. Ben Saada, N. Gey, B. Beausir, X. Iltis, H. Mansour, N. Maloufi, Sub-boundaries induced by dislocational creep in uranium dioxide analyzed by advanced diffraction and channeling electron microscopy, Mater. Charact. 133 (2017) 112-121.
[22] M. Ben Saada, X. Iltis, N. Gey, B. Beausir, A. Miard, P. Garcia, N. Maloufi, Influence of strain conditions on the grain sub-structuration in crept uranium dioxide pellets, J. Nucl. Mat. 518 (2019) 265-273.
[23] M. Ben Saada, Etude du comportement visco-plastique du dioxyde d'uranium : Quantification par analyse EBSD et ECCI des effets liés aux conditions de sollicitation et à la microstructure initiale, PhD Thesis, Université de Lorraine, France, 2017.
[24] P. Garcia, A. Miard, T. Helfer, J.B. Parise, X. Iltis, G. Antou, The effect of oxygen partial pressure on dislocation creep in polycrystalline uranium dioxide, J. Eur. Ceram., accepted.
[25]. L. Germain, D. Kratsch, M. Salib, N. Gey, Identification of sub-grains and low angle boundaries beyond the angular resolution of EBSD maps, Mater. Charact. 98 (2014) 66-72.
[26] H. Mansour, J. Guyon, M.A. Crimp, N. Gey, B. Beausir, N. Maloufi, Accurate electron channeling contrast analysis of dislocations in fine grained bulk materials, Scr. Mater. 84-85 (2014) 11-14.
[27] J. Guyon, H. Mansour, N. Gey, M.A. Crimp, S. Chalal, N. Maloufi, Sub-micron resolution selected area electron channeling patterns, Ultramicroscopy 149 (2015) 34-44.
[28] H. Mansour, M.A. Crimp, N. Gey, X. Iltis, N. Maloufi, Dislocation analysis of a complex sub-grain boundary in UO2 ceramic using accurate electron channelling contrast imaging in a scanning electron microscope, Ceram.
Int. 45 (2019) 18666–18671.
[29] C. Vivant-Duguay, Contribution à l’étude du fluage du dioxyde d’uranium. Rôle des activateurs de croissance cristalline, PhD Thesis, Institut National des Sciences Appliquées de Lyon, France, 1998.
[30] A. Ndiaye, Microstructures d’UO2 à propriétés pilotées : compréhension des mécanismes d’élaboration et
du comportement mécanique en température, PhD Thesis, Université de Grenoble, France, 2012.
[31] W.M. Armstrong, A.R. Causey, W.R. Sturrock, Creep of single-crystal UO2, J. Nucl. Mater. 19 (1966) 42-49.
[32] R.L. Coble, A model for boundary diffusion controlled creep in polycrystalline materials, J. Appl. Phys. 34 (1963) 1679-1682.
[33] M.R. Drury, J.L. Urai, Deformation-related recrystallization processes, Tectonophysics 172 (1990) 235-253. [34] J. Robert-Amodeo, N.M. Ghoniem, A review of experimental observations and theoretical models of dislocations cells and subgrains, Res Mechanica 23 (1988) 137-160.
[35] F. Montheillet, Métallurgie en mise en forme à chaud, Matériaux/ Mise en forme des métaux et fonderie, Technique de l’Ingénieur, M 3 301, 2009.
[36] E. Mariani, J. Mecklenburgh, J. Wheeler, D.J. Prior, F. Heidelbach, Microstructure evolution and recrystallization during creep of MgO single crystals, Acta Mater. 57 (2009) 1886-1898.
[37] H. Mughrabi, Revisiting “Steady-State” Monotonic and Cyclic Deformation: Emphasizing the Quasi-Stationary State of Deformation, Metall. Mater. Trans. A. 51 (2020) 1441-1456.
[38] S.P.A. Gill, Pore migration under high temperature and stress gradients, Int. J. Heat Mass Transf. 52 (2009) 1123–1131.
[39] G.M. Pennock, M.R. Drury, Low-angle subgrain misorientations in deformed NaCl, J. Microsc. 217 (2005) 130–137.
[40] A.J. Forty, Interaction of Cavities and Dislocations in Crystals, Discussions of the Faraday Society 38 (1964) 56-60.
20
[41] D. Caillard, J.L. Martin, Microstructure of aluminium during creep at intermediate temperature-II. In situ study of subboundary properties, Acta. Metall. 30 (1982) 791-798.
[42] A. Urbanczyk-Gucwa, K. Radwanski, K. Rodak, Influence of solution and aging treatment conditions on the formation of ultrafine-grained structure of CuFe2 alloy processed by rolling with cyclic movement of rolls, Archives of Metallurgy and Materials (2016) 1235–1240.