HAL Id: inserm-01802831
https://www.hal.inserm.fr/inserm-01802831
Submitted on 29 May 2018
HAL is a multi-disciplinary open access
archive for the deposit and dissemination of sci-entific research documents, whether they are pub-lished or not. The documents may come from teaching and research institutions in France or abroad, or from public or private research centers.
L’archive ouverte pluridisciplinaire HAL, est destinée au dépôt et à la diffusion de documents scientifiques de niveau recherche, publiés ou non, émanant des établissements d’enseignement et de recherche français ou étrangers, des laboratoires publics ou privés.
Health, frailty and disability after ninety: Results of an
observational study in France
Marie Herr, Arvieu Jean-Jacques, Jm Robine, Joël Ankri
To cite this version:
Marie Herr, Arvieu Jean-Jacques, Jm Robine, Joël Ankri. Health, frailty and disability after ninety: Results of an observational study in France: Health after ninety. Archives of Gerontology and Geri-atrics, Elsevier, 2016, 66, pp.166 - 175. �10.1016/j.archger.2016.06.002�. �inserm-01802831�
Health, frailty and disability after ninety: results of an observational study
in France
Herr M1,2,3, Arvieu JJ4, Robine JM5 et Ankri J1,2,3
1 INSERM, U1168, VIMA: Aging and chronic diseases. Epidemiological and public health
approaches, F-94807, Villejuif, France
2 Univ Versailles St-Quentin-en-Yvelines, UMR-S 1168, F-78180, Montigny le Bretonneux,
France
3 AP-HP, Hôpital Sainte Périne, Département de Santé Publique, Paris, France
4 AG2R La Mondiale, Direction des Etudes, Prévoyance Individuelle et IARD, Paris, France 5 INSERM U988 et U1198, EPHE, Paris & Montpellier, France
Corresponding author: Marie HERR
INSERM UMR 1168 : « Vieillissement et Maladies chroniques : approches épidémiologique et de santé publique », Université Versailles St-Quentin-en-Yvelines
Centre de Gérontologie, 49, rue Mirabeau, 75016 PARIS, FRANCE Tel: +33 1 44 96 32 05 ; Fax: +33 1 44 96 31 46
Mail: marie.herr@uvsq.fr
Running title: Health after ninety
1
Abstract (250 words)
Background: In spite of their increasing demographic weight, health characteristics of the
oldest old remain poorly described in epidemiological studies.
Objective: To describe the health of people aged 70 years and over included in the SIPAF
study, and to compare the prevalence of health indicators including successful aging, frailty, and disability and between three age groups including the oldest old.
Methods: The study population is composed of 2,350 retired people recruited between 2008
and 2010, of whom 512 are aged 90 and over (21.8%). A comprehensive geriatric assessment was performed at home by trained nurses. The prevalence of health and functional indicators, as well as the distribution of people among successful ageing, frailty, and disability, were described by age group (70-79, 80-89, 90+) and sex.
Results: Compared to their younger counterparts, people aged 90 years and over were more
likely to experience functional limitations, sensory impairment, cognitive impairment, poor mood, and frailty. One third of the nonagenarians needed help in at least one basic activity of daily living and 25% met the frailty criteria. In contrast, the prevalence of most chronic diseases did not increase after ninety. Successful ageing concerned 9% of the oldest old. Women were less likely to experience successful ageing and more likely to be frail or dependent.
Conclusion: This study shows the diversity of health states in very old age and points out that
one quarter of the people aged 90 and over said frail are likely to take advantage of preventive actions of disability.
2
Introduction
Thanks to medical and social advances, life expectancy has dramatically increased during the 20st century. Whereas the increase in life expectancy was initially due to the diminution of infant and child mortality, the increase in life expectancy is now related to the increasing longevity of old people. According to the central scenario established by the French Institute for Statistics and Economic Studies, the number of centenarians could reach 200,000 by 2060, in other words 13 times the current number. The quality of life at very old age has become an important issue. The joint action on healthy life years (JA: EHLEIS) [1] revealed that additional life years may be at the cost of some limitations. In France, life expectancy increased by 1.8 year for women and 1.6 year for men between 2005 and 2011. During the same period, disability-free life expectancy remained relatively stable (+0.3 years for women and +1.2 year for men) [2].
Epidemiological studies focusing on the oldest old are needed to improve our knowledge of the characteristics and needs of this increasing segment of population. Such studies exist, mainly in North European countries, United Kingdom (UK), and Japan. The UK was pioneer in the description of functioning in the oldest old [3-6]. The predominance of functional indicators in early studies was counterbalanced thereafter by the use of health indicators (physical and mental illnesses) [7, 8]. Some tried to classify the oldest old in homogeneous groups according to their health and/or functional status [9-11] and others to investigate the predictors of longevity [12-16]. In order to better understand the heterogeneity of situations in old age, Rowe and Kahn suggested to distinguish and value “successful ageing” ageing from ageing with disability or in poor health [17]. In Finland, Nosraty et al compared the prevalence of successful ageing according to different definitions [18], its predictive value with regard to longevity after 90 years [19], and its different components according to the oldest old themselves [20]. The concept of frailty, defined as a loss of resistance to stress,
3
exposing the subject to an increased risk of falls, loss of autonomy and death [21], is often considered as a state of pre-disability and can hence contribute to disentangle the heterogeneity of situations in the oldest old [22]. All these studies, as well as additional ones [23-35], are presented in a chronological overview of the literature about the health of the oldest old in Appendix.
In France, there is a paucity of information about the characteristics of the oldest old. Despite numerous sources of health information (national population-based surveys, epidemiological studies, analyses of data from the health insurance system), results concerning the oldest old are rarely displayed separately from results in the old age category [36]. The oldest old are often a minority in study samples, because this is a small age group compared to younger age groups, and because the oldest old are less likely to participate in epidemiological studies [37].
In this context, this study aimed to analyse the characteristics of a sample of 2,350 old people aged in France, among which 512 subjects were aged 90 and over. Using the information of a comprehensive geriatric assessment, the objective was to describe and compare the proportion of subjects meeting the criteria for successful aging, frailty, and disability among three age groups including the oldest old.
Methods
Study design and population
This work is part of a cross-sectional study carried out to characterize health and functional independence among people aged 70 and older (SIPAF study, French acronym for “Système d’Information sur la Perte d’Autonomie Fonctionnelle de la personne âgée”). Subjects were selected at random among the 2,100,000 recipients of a supplementary pension fund, AG2R La Mondiale (Paris, France). The randomization was centralized and performed by the
4
actuary of AG2R La Mondiale. Using information about the geographic area of residence, the sampling method was designed to ensure the inclusion of participants from all regions of France excluding overseas territories, in rural as well as in urban areas. The randomization was stratified by age group in order to include a larger proportion of oldest old than expected with a simple random drawing. As a result, people aged 90 years and over represented 21.8% of our study sample whereas they represented 5.7% of the population of France in 2009 (according to the National Institute of Statistical and Economic Information). After they had given their informed consent, participants were interviewed at home by trained nurses who collected information on health and functional abilities. The research protocol was approved by an independent ethics committee (permission n°060316).
Health assessment
Information was collected about self-rating of health, unintentional weight loss, chronic diseases, emotional status, cognitive impairment, functional abilities, sensory limitations, and physical activity.
Self-perceived health was assessed using the question "How is your health in general?". A complementary question was asked: "How is your health compared to people of the same age as you?". Participants were asked about unintentional weight loss (of 10% of body weight during the past 6 months). Chronic diseases were identified by reported diagnosis/symptoms/treatment during the last 12 months of 14 diseases, including asthma, allergies, diabetes, cataract, high blood pressure, heart attack, stroke/cerebral haemorrhage, chronic bronchitis/emphysema, arthrosis/(rheumatic) arthritis, osteoporosis, gastric or duodenal ulcer, malignant tumour, migraines/frequent headaches, and chronic anxiety/depression (list used by the European Commission to monitor population health). Emotional status was assessed with the self-rating of morale and the 15-item Geriatric
5
Depression Scale (GDS15) [38]. Cognitive impairment was defined as a Mini-Mental State Examination score of 26 or less [39].
Questions about sensory limitations dealt with the ability to see newspaper print clearly, the ability to see the face of someone 4 meters away clearly, and the ability to hear distinctly what is said in a conversation without difficulty, optionally with corrective devices (glasses, hearing devices). Participants were also asked whether they can walk up and down stairs without difficulty, and whether they can lift a bag weighing 5 kg without difficulty. The evaluation of activity limitations examined the five activities of daily living (ADL) included in the Katz index [40], i.e. bathing, dressing, toileting, transferring, continence and feeding, as well as instrumental activities of daily living (IADL) [41] such as food preparation, the ability to use a telephone, housework (light and heavy), shopping and the ability to manage one’s finances.
The level of physical activity was assessed with the International Physical Activity Questionnaire (IPAQ) [42] and 3 levels of activity were distinguished (low, moderate and high) according to time spent walking and doing moderate (for instance, carrying light loads, leisure bicycle ride, tennis) and vigorous activity (for instance, carrying heavy loads, digging, lifting a pack of 6 bottles or speed bicycle) during the past 7 days.
Other information
In addition to age and gender, socio-demographic information included the marital status, education level (number of years at school), self-rating of economic situation, and social isolation. Social isolation was defined as having reduced contacts with family (less than once a month) or as the absence of anyone to confide in, which could give an advice in case of need or show affection.
6
Successful ageing
Successful ageing was defined according to the work of the Vitality 90+ study [18], as a good or fair self-perceived health in the absence of each of the following: dementia (defined as MMSE<20), vision or hearing impairment, disability in ADL, depression (GDS15>5 or low self-rated morale), and social isolation.
Frailty
Frailty was defined according to the construct derived from the Cardiovascular Health Study (CHS) [43]. Due to variations in health assessment between the SIPAF study and the CHS, some components of our operational measurement of the frailty differ from the original definition. In particular, measures of grip strength and slow walking speed were replaced by self-reported variables, as previously observed in other epidemiological settings [44, 45]. The five frailty components were defined as follows:
- Nutrition: unintentional weight loss or body mass index £18.5 kg/m2;
- Energy: positive answer to the question “Compared to before, do you feel weak now?” or negative answer to the question “Do you have a lot of energy?”;
- Physical activity: low level of activity according to the IPAQ questionnaire; - Physical strength: difficulty lifting a bag weighing 5 kg;
- Mobility: difficulty walking up and down stairs.
Integrated approach
Participants were categorised into four groups, being:
- Successful ageing: people who met the criteria of successful ageing in the absence of
frailty;
7
- Frailty: people who met three of the five criteria of frailty, in the absence of disability
in ADL;
- Disability: people who needed help in at least one ADL.
Statistical analyses
All the health indicators were described in terms of prevalence by age group (70-79 years, 80-89 years, 90 years and older) and sex in case of significant differences between men and women. The differences between age groups and between men and women were analysed using Chi-2 tests. The significance level was set at 5%. Statistical analyses were performed using the STATA v13.
Results
Characteristics of the study population
A total of 2,350 people agreed to participate in the study. A close relative, generally the spouse or the child, was present during the interview in 16.6% of the cases. The participation rate amounted to 18.9%. The main reasons for non-participation were the lack of interest in the study (28.3% of the non-participants), followed by a state of frailty (10.8%) and the refusal of a close relative (7.3%). Male sex and younger age positively influenced the participation, as well as living in low-populated areas and in departments where the population is aging or with a lower standard of living [46]. The study population included 863 participants aged 70 to 79 years, 975 participants aged 80 to 89 years, and 512 participants aged 90 years and over (21.8% of the study population). The oldest participant was aged 102 years. The proportion of women increased with age: there were 1.13 women for 1 man in the age interval 70-79, 1.51 in the age interval 80-89 years, and 2.16 after age 90 years.
8
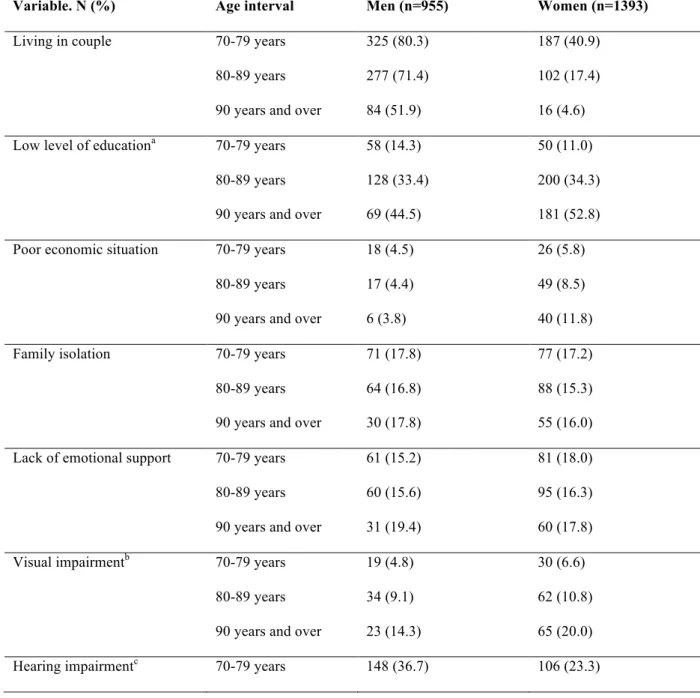
Women were less likely to live in couple compared to men (4.6% versus 51.9%) and more likely to experience financial difficulties in very old age (11.8%). The oldest old had a lower level of education compared to younger generations. Social isolation (family and/or emotional) was reported by 29.6% of the individuals aged 90 and over (n=147). Characteristics of the participants are further described in the Table 1.
Table 1. Sociodemographic and health characteristics according to age and sex in the
SIPAF study SIPAF (n=2,350)
Variable. N (%) Age interval Men (n=955) Women (n=1393)
Living in couple 70-79 years
80-89 years 90 years and over
325 (80.3) 277 (71.4) 84 (51.9) 187 (40.9) 102 (17.4) 16 (4.6)
Low level of educationa 70-79 years
80-89 years 90 years and over
58 (14.3) 128 (33.4) 69 (44.5) 50 (11.0) 200 (34.3) 181 (52.8)
Poor economic situation 70-79 years
80-89 years 90 years and over
18 (4.5) 17 (4.4) 6 (3.8) 26 (5.8) 49 (8.5) 40 (11.8)
Family isolation 70-79 years
80-89 years 90 years and over
71 (17.8) 64 (16.8) 30 (17.8) 77 (17.2) 88 (15.3) 55 (16.0) Lack of emotional support 70-79 years
80-89 years 90 years and over
61 (15.2) 60 (15.6) 31 (19.4) 81 (18.0) 95 (16.3) 60 (17.8)
Visual impairmentb 70-79 years
80-89 years 90 years and over
19 (4.8) 34 (9.1) 23 (14.3) 30 (6.6) 62 (10.8) 65 (20.0)
9
80-89 years 90 years and over
163 (42.3) 100 (61.7)
199 (34.1) 189 (55.1)
Cognitive impairmentd 70-79 years
80-89 years 90 years and over
42 (10.5) 53 (14.0) 34 (21.8) 32 (7.0) 75 (13.2) 90 (28.6)
Probable depressionf 70-79 years
80-89 years 90 years and over
43 (10.7) 56 (14.5) 37 (23.3) 81 (17.8) 148 (25.3) 100 (29.4)
Low moraleg 70-79 years
80-89 years 90 years and over
11 (6.7) 18 (4.7) 11 (4.0) 24 (7.1) 40 (6.9) 26 (5.7) a £7 years at school b
Inability to read the newspaper or to see someone at 4 meters of distance
c Inability to follow a conversation with several people d Mini Mental State Examination score < 20
e Need of help in at least one activity of daily living f Geriatric Depression Scale 15 score >5
h Answer bad or very bad to the question: “How is your moral in general?”
Self-perceived health
When asked about their health, 48.0% of people aged 90 years and over (n=244) declared themselves in good health, 40.6% (n=206) consider their health fair, and 11.4% (n=58) perceived themselves in poor health (Figure 1.A). While the self-perceived health did not vary according to age, the relative health, meaning the rating of its own health compared to people of the same age, was better in the oldest old (p<0.001) (Figure 1.B). There was no significant difference between men and women.
10
Figure 1. Self-perceived health (A) and self-rating of health compared to people of the
same age (B) by age group in the SIPAF study (n=2,350)
Chronic diseases
Half of the participants included in SIPAF reported at least three chronic conditions, 51.2% in the age group 70-79 years (n=437), 54.7% in the age group 80-89 (n=527), and 45.5% in people aged 90 years and over (n=230) (p<0.001). After age 90 years, the main health problems were arthrosis/(rheumatic) arthritis, high blood pressure and chronic anxiety/depression (Figure 2). Their prevalence was higher in women compared to men (prevalence of arthrosis/(rheumatic) arthritis=76.3% versus 52.5%, p<0.001; prevalence of chronic anxiety/depression=20.9% versus 13.8%, p=0.056; prevalence of high blood pressure=47.3% versus 34.6%, p=0.007). Except for stroke, the prevalence of chronic diseases did not increase significantly with age. In the case of high blood pressure, diabetes and allergy, there was even a significant decrease in the prevalence with age.
11
Figure 2. Prevalence of chronic diseases by age group in the SIPAF study (n=2,350)
* Significant difference between age groups (p<0.05)
Sensory impairment
The prevalence of visual and hearing impairment increased with age (Table 1). Hearing impairment, foremost, concerned 57.2% of the participants aged 90 years and over (n=289) versus 37.4% of people aged 80-89 years (n=362) and 29.6% of those aged 70-79 years (n=254) (p <0.001). Though hearing impairment was more reported in men of younger age intervals, there was no significant difference between men and women regarding sensory impairment after age 90 years.
Cognitive and mood disorders
The prevalence of cognitive and mood disorders also increased with age. Indeed, 26.3% of the participants aged 90 years and over (n=124) had a MMSE£26 versus 13.5% of the participants (n=128) in age interval 80-90 years, and 8.7% of the participants (n=74) in age
12
interval 70-79 years (p<0.001). Though few people reported a low morale (7.0% of the oldest old), the results of the GDS15 indicated a probable depression in many more people (27.5% of the oldest old). There was no difference in the prevalence of cognitive and mood disorders between men and women after age 90 years.
Disability
The proportion of subjects needing help in ADL increased with age, from 5.5% (n=47) between 70 and 79 years, 14.1% (n=137) between 80 and 89 years, and up to 33.0% (n=167) after age 90 years (p<0.001). Bathing and dressing were the leading causes of difficulty (31.7% and 21.0% respectively). After age 90 years, 67.9% (n=343) of the participants needed help in IADL, versus only 15.7% (n=135) of participants aged 70-79 years. IADL causing the most difficulties were heavy housework and shopping (67.4% and 62.9% respectively). Men had less disability than women, and the gap widened with age (Figure 3); 37.8% (n=62) of the men were still independent versus 27.9% (n=96) of women after age 90 years (p=0.008).
Figure 3. Proportion of people who needed help in ADL and IADL in the SIPAF study
13
ADL = bathing, dressing, toileting, transferring, continence and feeding
IADL = food preparation, ability use a telephone, housework (light and heavy), shopping and ability to manage one’s finances
Frailty
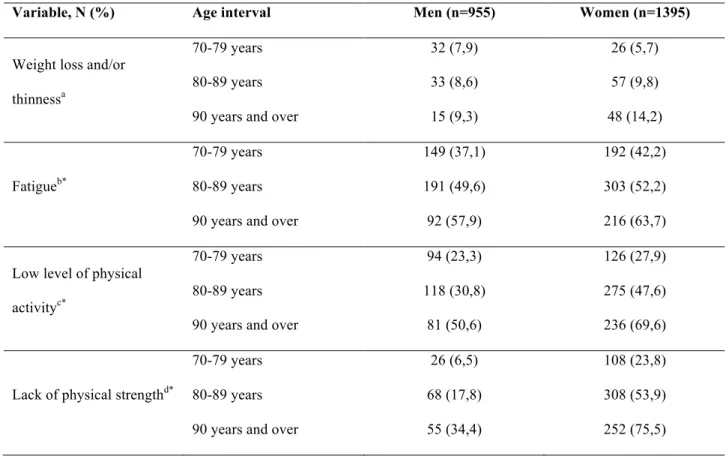
The prevalence of the different frailty criteria is described by age group and sex in Table 2. The frail phenotype concerned 25.3% of people aged 90 and over (n=125), versus 18.4% of people 80-89 years (n=183), and 9.5% of people aged 70-79 years (n=80) (p<0.001). Women were more likely to be frail compared to men in all age groups. After 90 years of age, 30.2% of the women (n=102) were frail versus 14.7% of the men (n=23) (p<0.001), with significant differences in the prevalence of criteria dealing with physical activity, strength and mobility.
Table 2. Prevalence of the different frailty criteria by age group and sex in the SIPAF
study (n=2,350)
Variable, N (%) Age interval Men (n=955) Women (n=1395)
Weight loss and/or thinnessa
70-79 years 80-89 years 90 years and over
32 (7,9) 33 (8,6) 15 (9,3) 26 (5,7) 57 (9,8) 48 (14,2) Fatigueb* 70-79 years 80-89 years 90 years and over
149 (37,1) 191 (49,6) 92 (57,9) 192 (42,2) 303 (52,2) 216 (63,7)
Low level of physical activityc*
70-79 years 80-89 years 90 years and over
94 (23,3) 118 (30,8) 81 (50,6) 126 (27,9) 275 (47,6) 236 (69,6)
Lack of physical strengthd*
70-79 years 80-89 years 90 years and over
26 (6,5) 68 (17,8) 55 (34,4) 108 (23,8) 308 (53,9) 252 (75,5)
14
Reduced mobilitye*
70-79 years 80-89 years 90 years and over
64 (16,0) 99 (25,9) 56 (35,2) 83 (18,4) 202 (34,8) 181 (53,6)
a Unintentional weight loss of at least 10% in 6 months and/or body mass index ≤ 18.5 kg/m²
b Positive answer to the question “Do you feel weak now?” or negative answer to the question “Do you have a
lot of energy?”
c Low level of activity according to the IPAQ questionnaire d Difficulty lifting a bag weighing 5 kg
e Difficulty walking up and down stairs
* Significant difference between men and women (p<0.05)
Integrated approach
According to the health, psychological and social indicators previously described, we estimated the prevalence of successful ageing to 9.1% (n=46) among people aged 90 and over, 22.8% (n=221) among people aged 80-89 years, and 38.7% (n=332) among those aged 70-79 years. The Figure 4 shows the distribution of the prevalence of successful ageing, frailty and disability according to age and sex. If men and women had close profiles in age group 70-79 years, differences were more pronounced in the oldest old, where women were less likely to experience successful ageing and more likely to be frail or disabled.
15
Figure 4. Distribution of people between successful ageing, frailty and disability by age
groups, in men and women in the SIPAF study (n=2,350)
Discussion
Main findings
Considering together different indicators of health in old age, this study shows that 9% of the nonagenarians meet the criteria of successful aging, defined by ageing in relatively good physical and mental health, surrounded and without sensory or functional limitations, versus 39% of the septuagenarians. Though the prevalence of chronic diseases was relatively stable between septuagenarians and nonagenarians, there was a marked increase in the prevalence of
16
functional limitations, sensory impairment, cognitive impairment, poor mood, and frailty with age. As a result, about one third of the nonagenarians were dependent of other people for at least one ADL, and one quarter of people aged 90 years and over were considered frail.
Health
Regarding chronic health problems, we found joint and cardiovascular disease (high blood pressure) to the forefront of health problems reported by the oldest old, in agreement with previous studies [14, 31, 47]. The relative stability of the prevalence of chronic diseases between age groups observed in this study may be partly explained by a selection effect. Indeed, subjects with chronic illnesses were more likely to die before the age of 90 years, resulting in the relative health of the "survivors". This selection effect was previously suggested by Motta et al [11], by comparing the health of two populations of different age: in one hand, the 602 centenarians included in the IMUSCE study (The Italian Multicenter Study
on Centenarians, 2005) [11] and on the other hand, the 5,632 participants included in the
ILSA study (The Italian Longitudinal Study on Aging, 1997) aged between 65 and 84 years. The comparison of the two populations showed the lower prevalence of Parkinson's disease, high blood pressure, diabetes and thyroid disease in the older cohort. However, the prevalence of cognitive impairment was higher among the older cohort. Using similar definitions, our estimate of cognitive impairment in nonagenarians was lower than estimates from the PAQUID study, a French study on cognitive ageing (26% versus 35%) [14]. People included in the PAQUID study were recruited free of dementia at baseline and followed up for more than 20 years, whereas the SIPAF study had a cross-sectional design where one can expect the lower participation of people with cognitive impairment. Nonetheless, estimates of self-perceived health were comparable between the two studies (48% of the nonagenarians in SIPAF versus 42% of the nonagenarians in PAQUID perceived themselves in good health).
17
Disability
Our results confirm the extent of the need for assistance in activities of daily living. The methodological closeness of our study with the Canadian Community Health Survey (CCHS) - Healthy Aging [35] allows comparisons of prevalence of disability between the two studies. Among the 28,406 participants aged 50-104 years, 1,120 were aged 90 years and over. Among them, 26% reported a need of help in at least one ADL and 74% in at least one IADL. Our estimates are relatively close in value for ADL (33%) and IADL (68%), but also regarding the evolution of disability with age, with a marked increase after 80 years. Indeed, Guay et al. showed an exponential increase in difficulties in ADL with age. In line with previous studies [5, 48], the most problematic ADLs were those using the upper part of the body and requiring balance, i.e. bathing, dressing, and sleeping, and the most problematic IADLs were cleaning, shopping and dining.
Frailty
Frailty has raised growing interest in gerontology but few data are available in the oldest old. A study about the prevalence and the factors associated with frailty among 273 subjects aged 86 years reported that one participant in five was frail [22]. Based on a systematic review of the literature, Shamliyan et al [49] estimated the prevalence of the frail phenotype to 14% in people aged 65 years and over, and to 26% in people over 85 years. Our estimates are remarkably close to these figures, since we found that the prevalence of frailty was 17% in our whole study sample and 25% after age 90 years. Before the onset of disability, the screening and management of frailty offer opportunities to prevent or delay health complications and dependency [50]. After the detection of frailty, the main areas for improvement are the proper management of chronic diseases, the reduction of sarcopenia
18
through exercise and the establishment of a hyper-protein and high calorie diet, the prevention of fractures via vitamin D supplementation, and the reduction of polypharmacy.
Successful ageing
The definition of successful aging varies substantially depending on the study, resulting in a wide range of prevalence, from less than 1% to over 90% [51]. The definition used in this study is based on previous findings from the 90+ Vitality study [19]. Because their work highlighted the extremely low proportion of old people free from any physical, psychological and social problems, we used a more realistic approach to successful ageing, allowing the presence of chronic diseases [52]. Nevertheless, our estimates should be considered with caution as they may vary with the choice of the definition. Of note, 11 women and 3 men classified frail also met the criteria for successful ageing, which can seem paradoxical. These cases probably show the limits of these health indicators. However, one cannot exclude that some people experience silent physical decline while they are still satisfied with their health, independent, surrounded by relatives, etc. Whether a classification bias or a reality, these cases remained very rare.
Differences between genders
Whether for mood, disability or frailty, women reported more impairments than men in our study. This difference is common in the literature [14, 23, 30, 48]. Whereas women live longer, European data show that they live longer with health problems compared to men [53]. Besides potential biological effects, the sex-differences could be of socio-economic nature [54]. Furthermore, our data were self-declared and we cannot exclude a reporting bias, where women may be more likely to be aware of and to report health problems than men [55].
19
Strength and limitations
The main strength of this study is the large number of people aged 90 years and over (n=512). For comparison, the French sample of SHARE (Survey on Health, Ageing and Retirement in
Europe) only included 5% of people aged 85 years and over, i.e. 278 individuals in the
analysis published by Sirven et al [56]. Another strength is the use of multiple health indicators – self-perceived health, medical conditions, functional indicators – rarely considered together in other studies. Despite the use of validated tools (MMSE, GDS15, etc.) and the presence of a close relative in 16.6% of the cases, we cannot exclude a possible measurement bias due to the declarative nature of our data, especially in the oldest old were the prevalence of cognitive impairment is higher.
The representativeness of our study population, composed of a random sample of recipients of a supplementary pension fund, can be challenged. Nevertheless, the representation of a variety of situations was ensured by the recruitment of people throughout France (excluding overseas territories), in rural and urban areas, from a source population of 2.1 million people.
Finally, the interpretation of the differences between age groups must take into account a possible cohort effect. The dates of birth of our study population ranged between 1906 and 1939, and it is likely that participants experienced relatively different situations in terms of living conditions (especially in the war years), organization of the system health, medical knowledge and preventive policies, including vaccination.
Conclusion
This study shows the heterogeneity of health states in very old age. In 1987, Rowe and Kahn stated that gerontological research should not neglect the substantial heterogeneity within age groups by focusing on average tendencies within such groups [17]. Indeed, we observed than
20
9% of the nonagenarians met the criteria for successful ageing, while 33% required help in ADL and 25% were in a pre-disability stage where they could benefit from preventive actions.
Acknowledgments
We thank our supports for this study, AG2R-La Mondiale and Université Versailles-St-Quentin-en-Yvelines, as well as the Dr Manèle El Bahri and Audrey Cordier for their collaboration in the preliminary steps of this work.
References
1. Robine, J.M., E. Cambois, W. Nusselder, B. Jeune, H. Van Oyen, and C. Jagger. The joint action on healthy life years (JA: EHLEIS). Arch Public Health, 2013. 71(1): p. 2.
2. Espérance de vie en bonne santé : dernières tendances. Available from: http://www.inserm.fr/espace-journalistes/esperance-de-vie-en-bonne-sante-dernieres-tendances (Accessed: 28 avril 2015)
3. O'Connor, D.W., P.A. Pollitt, C.P. Brook, and B.B. Reiss. A community survey of mental and physical infirmity in nonagenarians. Age Ageing, 1989. 18(6): p. 411-4.
4. McGee, M.A., A.L. Johnson, and D.W. Kay. The description of activities of daily living in five centres in England and Wales. Medical Research Council Cognitive Function and Ageing Study. Age Ageing, 1998. 27(5): p. 605-13.
5. Jagger, C., A.J. Arthur, N.A. Spiers, and M. Clarke. Patterns of onset of disability in activities of daily living with age. J Am Geriatr Soc, 2001. 49(4): p. 404-9.
6. Xie, J., F.E. Matthews, C. Jagger, J. Bond, and C. Brayne. The oldest old in England and Wales: a descriptive analysis based on the MRC Cognitive Function and Ageing Study. Age Ageing, 2008. 37(4): p. 396-402. DOI: 10.1093/ageing/afn061
21
7. Marengoni, A., B. Winblad, A. Karp, and L. Fratiglioni. Prevalence of chronic diseases and multimorbidity among the elderly population in Sweden. Am J Public Health, 2008. 98(7): p. 1198-200. DOI: 10.2105/AJPH.2007.121137
8. Collerton, J., K. Davies, C. Jagger, A. Kingston, J. Bond, M.P. Eccles, L.A. Robinson, C. Martin-Ruiz, T. von Zglinicki, O.F. James, and T.B. Kirkwood. Health and disease in 85 year olds: baseline findings from the Newcastle 85+ cohort study. BMJ, 2009. 339: p. b4904. DOI: 10.1136/bmj.b4904
9. Cevenini, E., R. Cotichini, M.A. Stazi, V. Toccaceli, M. Scurti, V. Mari, M. Berardelli, G. Passarino, B. Jeune, C. Franceschi, and G.P. Consortium. How to classify the oldest old according to their health status: a study on 1160 subjects belonging to 552 90+ Italian sib-ships characterized by familial longevity recruited within the GEHA EU Project. Mech Ageing Dev, 2013. 134(11-12): p. 560-9. DOI: 10.1016/j.mad.2013.11.001
10. Gondo, Y., N. Hirose, Y. Arai, H. Inagaki, Y. Masui, K. Yamamura, K. Shimizu, M. Takayama, Y. Ebihara, S. Nakazawa, and K. Kitagawa. Functional status of centenarians in Tokyo, Japan: developing better phenotypes of exceptional longevity. J Gerontol A Biol Sci Med Sci, 2006. 61(3): p. 305-10.
11. Motta, M., E. Bennati, L. Ferlito, M. Malaguarnera, L. Motta, and C. Italian Multicenter Study on. Successful aging in centenarians: myths and reality. Arch Gerontol Geriatr, 2005. 40(3): p. 241-51. DOI: 10.1016/j.archger.2004.09.002
12. Dupre, M.E., G. Liu, and D. Gu. Predictors of longevity: evidence from the oldest old in China. Am J Public Health, 2008. 98(7): p. 1203-8. DOI: 10.2105/AJPH.2007.113886 13. Ferrer, A., F. Formiga, D. Ruiz, J. Mascaro, C. Olmedo, and R. Pujol. Predictive items
of functional decline and 2-year mortality in nonagenarians--the NonaSantfeliu study. Eur J Public Health, 2008. 18(4): p. 406-9. DOI: 10.1093/eurpub/ckn020
22
14. Edjolo, A., C. Helmer, P. Barberger-Gateau, J.F. Dartigues, C. Maubaret, and K. Peres. Becoming a nonagenarian: factors associated with survival up to 90 years old in 70+ men and women. Results from the PAQUID longitudinal cohort. J Nutr Health Aging, 2013. 17(10): p. 881-92. DOI: 10.1007/s12603-013-0041-8
15. Tiainen, K., T. Luukkaala, A. Hervonen, and M. Jylha. Predictors of mortality in men and women aged 90 and older: a nine-year follow-up study in the Vitality 90+ study. Age Ageing, 2013. 42(4): p. 468-75. DOI: 10.1093/ageing/aft030
16. Robine, J.M., F.R. Herrmann, Y. Arai, D.C. Willcox, Y. Gondo, N. Hirose, M. Suzuki, and Y. Saito. Exploring the impact of climate on human longevity. Exp Gerontol, 2012. 47(9): p. 660-71. DOI: 10.1016/j.exger.2012.05.009
17. Rowe, J.W. and R.L. Kahn. Human aging: usual and successful. Science, 1987. 237(4811): p. 143-9.
18. Nosraty, L., T. Sarkeala, A. Hervonen, and M. Jylha. Is there successful aging for nonagenarians? The vitality 90+ study. J Aging Res, 2012. 2012: p. 868797. DOI: 10.1155/2012/868797
19. Nosraty, L., L. Enroth, J. Raitanen, A. Hervonen, and M. Jylha. Do successful agers live longer? The vitality 90+ study. J Aging Health, 2015. 27(1): p. 35-53. DOI: 10.1177/0898264314535804
20. Nosraty, L., M. Jylha, T. Raittila, and K. Lumme-Sandt. Perceptions by the oldest old of successful aging, Vitality 90+ Study. J Aging Stud, 2015. 32: p. 50-8. DOI: 10.1016/j.jaging.2015.01.002
21. Bergman, H., L. Ferrucci, J. Guralnik, D.B. Hogan, S. Hummel, S. Karunananthan, and C. Wolfson. Frailty: an emerging research and clinical paradigm--issues and controversies. J Gerontol A Biol Sci Med Sci, 2007. 62(7): p. 731-7.
23
22. Ferrer, A., T. Badia, F. Formiga, H. Sanz, M.J. Megido, R. Pujol, and G. Octabaiz Study. Frailty in the oldest old: prevalence and associated factors. J Am Geriatr Soc, 2013. 61(2): p. 294-6. DOI: 10.1111/jgs.12154
23. von Strauss, E., H. Aguero-Torres, I. Kareholt, B. Winblad, and L. Fratiglioni. Women are more disabled in basic activities of daily living than men only in very advanced ages: a study on disability, morbidity, and mortality from the Kungsholmen Project. J Clin Epidemiol, 2003. 56(7): p. 669-77.
24. Engberg, H., K. Christensen, K. Andersen-Ranberg, and B. Jeune. Cohort changes in cognitive function among Danish centenarians. A comparative study of 2 birth cohorts born in 1895 and 1905. Dement Geriatr Cogn Disord, 2008. 26(2): p. 153-60. DOI: 10.1159/000149819
25. Berlau, D.J., M.M. Corrada, and C. Kawas. The prevalence of disability in the oldest-old is high and continues to increase with age: findings from The 90+ Study. Int J Geriatr Psychiatry, 2009. 24(11): p. 1217-25. DOI: 10.1002/gps.2248
26. Nogueira, S.L., R.C. Ribeiro, L.E. Rosado, S.C. Franceschini, A.Q. Ribeiro, and E.T. Pereira. Determinant factors of functional status among the oldest old. Rev Bras Fisioter, 2010. 14(4): p. 322-9.
27. Freeman, S., H. Kurosawa, S. Ebihara, and M. Kohzuki. Understanding the oldest old in northern Japan: an overview of the functional ability and characteristics of centenarians. Geriatr Gerontol Int, 2010. 10(1): p. 78-84. DOI: 10.1111/j.1447-0594.2009.00550.x 28. Arai, Y., T. Iinuma, M. Takayama, M. Takayama, Y. Abe, R. Fukuda, J. Ando, K.
Ohta, H. Hanabusa, K. Asakura, Y. Nishiwaki, Y. Gondo, H. Akiyama, K. Komiyama, N. Gionhaku, and N. Hirose. The Tokyo Oldest Old survey on Total Health (TOOTH): a longitudinal cohort study of multidimensional components of health and well-being. BMC Geriatr, 2010. 10: p. 35. DOI: 10.1186/1471-2318-10-35
24
29. Zhao, J., S. Barclay, M. Farquhar, A.L. Kinmonth, C. Brayne, J. Fleming, and C. Cambridge City over-75s Cohort Study. The oldest old in the last year of life: population-based findings from Cambridge city over-75s cohort study participants aged 85 and older at death. J Am Geriatr Soc, 2010. 58(1): p. 1-11. DOI: 10.1111/j.1532-5415.2009.02622.x 30. Berlau, D.J., M.M. Corrada, C.B. Peltz, and C.H. Kawas. Disability in the oldest-old:
incidence and risk factors in the 90+ study. Am J Geriatr Psychiatry, 2012. 20(2): p. 159-68. DOI: 10.1097/JGP.0b013e31820d9295
31. Wu, H., J. Flaherty, B. Dong, G. Liu, J. Deng, Y. Zhang, J. Wu, G. Zeng, X. Ren, J. Hu, W. Wu, and T.K. Malmstrom. Impact of geriatric conditions versus medical diagnoses on ADL disability among nonagenarians and centenarians. J Aging Health, 2012. 24(8): p. 1298-319. DOI: 10.1177/0898264312457411
32. Andersen-Ranberg, K., K.T. Fjederholt, A. Madzak, M. Nybo, and B. Jeune. Cardiovascular diseases are largely underreported in Danish centenarians. Age Ageing, 2013. 42(2): p. 249-53. DOI: 10.1093/ageing/afs108
33. van Houwelingen, A.H., I.D. Cameron, J. Gussekloo, H. Putter, S. Kurrle, A.J. de Craen, A.B. Maier, W.P. den Elzen, and J.W. Blom. Disability transitions in the oldest old in the general population. The Leiden 85-plus study. Age (Dordr), 2014. 36(1): p. 483-93. DOI: 10.1007/s11357-013-9574-3
34. Christensen, K., M. Thinggaard, A. Oksuzyan, T. Steenstrup, K. Andersen-Ranberg, B. Jeune, M. McGue, and J.W. Vaupel. Physical and cognitive functioning of people older than 90 years: a comparison of two Danish cohorts born 10 years apart. Lancet, 2013. 382(9903): p. 1507-13. DOI: 10.1016/S0140-6736(13)60777-1
35. Guay, M., M.F. Dubois, M. Corrada, M.P. Lapointe-Garant, and C. Kawas. Exponential increases in the prevalence of disability in the oldest old: a Canadian national survey. Gerontology, 2014. 60(5): p. 395-401. DOI: 10.1159/000358059
25
36. Sermet, C. L'état de santé des personnes âgées. Actualité et dossier en santé publique, 2013. 85: p. 20-25.
37. Dartigues, J.F. [Methodological problems in clinical and epidemiological research on ageing]. Rev Epidemiol Sante Publique, 2005. 53(3): p. 243-9.
38. Yesavage, J.A., T.L. Brink, T.L. Rose, O. Lum, V. Huang, M. Adey, and V.O. Leirer. Development and validation of a geriatric depression screening scale: a preliminary report. J Psychiatr Res, 1982. 17(1): p. 37-49.
39. Folstein, M.F., S.E. Folstein, and P.R. McHugh. "Mini-mental state". A practical method for grading the cognitive state of patients for the clinician. J Psychiatr Res, 1975. 12(3): p. 189-98.
40. Katz, S., A.B. Ford, R.W. Moskowitz, B.A. Jackson, and M.W. Jaffe. Studies of Illness in the Aged. The Index of Adl: A Standardized Measure of Biological and Psychosocial Function. JAMA, 1963. 185: p. 914-9.
41. Lawton, M.P. and E.M. Brody. Assessment of older people: self-maintaining and instrumental activities of daily living. Gerontologist, 1969. 9(3): p. 179-86.
42. Hurtig-Wennlof, A., M. Hagstromer, and L.A. Olsson. The International Physical Activity Questionnaire modified for the elderly: aspects of validity and feasibility. Public Health Nutr, 2010. 13(11): p. 1847-54. DOI: 10.1017/S1368980010000157
43. Fried, L.P., C.M. Tangen, J. Walston, A.B. Newman, C. Hirsch, J. Gottdiener, T. Seeman, R. Tracy, W.J. Kop, G. Burke, M.A. McBurnie, and G. Cardiovascular Health Study Collaborative Research. Frailty in older adults: evidence for a phenotype. J Gerontol A Biol Sci Med Sci, 2001. 56(3): p. M146-56.
44. Castrejon-Perez, R.C., S.A. Borges-Yanez, L.M. Gutierrez-Robledo, and J.A. Avila-Funes. Oral health conditions and frailty in Mexican community-dwelling elderly: a cross
26
sectional analysis. BMC Public Health, 2012. 12: p. 773. DOI: 1471-2458-12-773 [pii]10.1186/1471-2458-12-773
45. Theou, O., T.D. Brothers, A. Mitnitski, and K. Rockwood. Operationalization of frailty using eight commonly used scales and comparison of their ability to predict all-cause mortality. J Am Geriatr Soc, 2013. 61(9): p. 1537-51. DOI: 10.1111/jgs.12420
46. Herr, M., J.J. Arvieu, P. Aegerter, J.M. Robine, and J. Ankri. Unmet health care needs of older people: prevalence and predictors in a French cross-sectional survey. Eur J Public Health, 2013. DOI: 10.1093/eurpub/ckt179
47. Andersen-Ranberg, K., M. Schroll, and B. Jeune. Healthy centenarians do not exist, but autonomous centenarians do: a population-based study of morbidity among Danish centenarians. J Am Geriatr Soc, 2001. 49(7): p. 900-8.
48. Kingston, A., J. Collerton, K. Davies, J. Bond, L. Robinson, and C. Jagger. Losing the ability in activities of daily living in the oldest old: a hierarchic disability scale from the Newcastle 85+ study. PLoS One, 2012. 7(2): p. e31665. DOI: 10.1371/journal.pone.0031665
49. Shamliyan, T., K.M. Talley, R. Ramakrishnan, and R.L. Kane. Association of frailty with survival: a systematic literature review. Ageing Res Rev, 2013. 12(2): p. 719-36. DOI: 10.1016/j.arr.2012.03.001
50. Morley, J.E., B. Vellas, G.A. van Kan, S.D. Anker, J.M. Bauer, R. Bernabei, M. Cesari, W.C. Chumlea, W. Doehner, J. Evans, L.P. Fried, J.M. Guralnik, P.R. Katz, T.K. Malmstrom, R.J. McCarter, L.M. Gutierrez Robledo, K. Rockwood, S. von Haehling, M.F. Vandewoude, and J. Walston. Frailty consensus: a call to action. J Am Med Dir Assoc, 2013. 14(6): p. 392-7. DOI: 10.1016/j.jamda.2013.03.022
27
51. Cosco, T.D., A.M. Prina, J. Perales, B.C. Stephan, and C. Brayne. Operational definitions of successful aging: a systematic review. Int Psychogeriatr, 2014. 26(3): p. 373-81. DOI: 10.1017/S1041610213002287
52. Bowling, A. Aspirations for older age in the 21st century: what is successful aging? Int J Aging Hum Dev, 2007. 64(3): p. 263-97.
53. Robine, J.M. and E. Cambois. Healthy life expectancy in Europe. Population et
Sociétés 2013 Avril;499:4p. . Available from:
http://www.eurohex.eu/pdf/Scientific%20papers/2013_Pop%20et%20Soc_Eng.pdf (Accessed: May 9th 2016)
54. Romero-Ortuno, R., T. Fouweather, and C. Jagger. Cross-national disparities in sex differences in life expectancy with and without frailty. Age Ageing, 2014. 43(2): p. 222-8. DOI: 10.1093/ageing/aft115
55. Louie, G.H. and M.M. Ward. Sex disparities in self-reported physical functioning: true differences, reporting bias, or incomplete adjustment for confounding? J Am Geriatr Soc, 2010. 58(6): p. 1117-22. DOI: 10.1111/j.1532-5415.2010.02858.x
56. Sirven, N. Mesurer la fragilité des personnes âgées en population générale : une comparaison entre les enquêtes ESPS et SHARE. Questions d'économie de la santé n°199 juin 2014. Available from: http://www.irdes.fr/recherche/questions-d-economie-de-la-
sante/199-mesurer-la-fragilite-des-personnes-agees-en-population-generale-une-comparaison-entre-les-enquetes-esps-et-share.pdf (Accessed: May 9th 2016)
57. Robine, J.M., S.L. Cheung, Y. Saito, B. Jeune, M.G. Parker, and F.R. Herrmann. Centenarians Today: New Insights on Selection from the 5-COOP Study. Curr Gerontol Geriatr Res, 2010. 2010: p. 120354. DOI: 10.1155/2010/120354
28
58. Jacobs, J.M., A. Cohen, E. Ein-Mor, Y. Maaravi, and J. Stessman. Frailty, cognitive impairment and mortality among the oldest old. J Nutr Health Aging, 2011. 15(8): p. 678-82.
29
Appendix. Main characteristics of the observational studies about disability and health in the oldest old
Author, year, country [reference]
Study design Population Main topic
O’Connor, 1989, UK [3]
Cross-sectional N=132 nonagenarians Mental and physical
functioning in nonagenarians McGuee, 1998, UK
[4]
Cross-sectional N=13,009 individuals aged ³65 years,
including 1,188 individuals aged ³85 years
Prevalence of disability by age and gender
Andersen-Randberg, 2001, Denmark [47]
Cross-sectional analysis of the data from the
Longitudinal Study of Danish Centenarians (LSDC)
N=207 Danish centenarians Prevalence of disability
and chronic diseases in centenarians
Jagger, 2001, UK [5]
Prospective cohort N=1,344 patients registered in one large UK general practice, aged ³75 years, and free from disability in ADL at baseline
Detailed description of the onset of disability
Von Strauss, 2003, Sweden [23]
Community-based cohort N=1,848 individuals aged ³77 years Disability in men and women
Motta, 2004, Italy [11]
Cross-sectional N=602 centenarians from the Italian
Multicenter Studies on Centenarians (IMUSCE)
Groups of centenarians individuals depending on their psychophysical status and autonomy Gondo, 2006, Japan
[10]
Cross-sectional analysis of baseline data from a prospective cohort
N=304 centenarians living in Tokyo Functional phenotypes in centenarians
Marengoni, 2008, Sweden [7]
Cross-sectional N=1,099 individuals aged 77 to 100
years Prevalence of chronic diseases and multimorbidity in the elderly population Dupre, 2008, China [12]
Prospective cohort N=13,297 individuals aged between 85
and 105 years
Predictors of Longevity Xie, 2008, UK [6] Retrospective analysis of a
population-based cohort study in England and Wales + survival analysis
N=958 individuals aged ³90 years Characteristics and survival of the oldest old
30
Author, year, country [reference]
Study design Population Main topic
[13] functional decline and
2-year mortality Engberg, 2008,
Denmark [24]
Cross-sectional analysis of the data of two prospective cohorts: “The Longitudinal Study of Danish
Centenarians (LSDC)” and “The Danish 1905 Cohort Survey”
N=207 centenarians in the LDSC (born in 1895);
N=225 centenarians in “The Danish 1905 Cohort Survey” (born in 1905)
Prevalence of disability in centenarians born ten years apart
Collerton, 2009, UK [8]
Cross sectional analysis of baseline data from ‘The Newcastle 85+ study”
N=1,042 individuals born in 1921 and registered with the participating general practices
Health and disease in 85 year olds
Berlau, 2009, USA [25]
Cross-sectional analysis of baseline data from “The 90+ Study”
N=697 individuals aged ³90 years Prevalence of disability by age and gender Nogueira, 2009,
Brazil [26]
Cross-sectional population-based study
N=129 individuals aged between 80 and 96 years
Determinant factors of functional status among the oldest old
Freeman, 2010, Japan [27] Comparative cross-sectional study N=56 centenarians and 104 younger control subjects Functional abilities and characteristics of centenarians Arai, 2010, Japan [28]
Prospective cohort “The Tokyo Oldest Old Survey on Total Health (TOOTH)”
N=1152 randomly selected inhabitants of Tokyo aged ³85 years
Strategies for data collection in the oldest old
Zhao, 2010, UK [29] Retrospective analysis of the data from the
“Cambridge City over-75s” cohort
N=321 individuals aged ≥85 years deceased after one year of follow-up
Modifications of health status during the year preceding death Robine, 2010,
France [57]
Demographic Five low mortality countries, Denmark,
France, Japan, Switzerland, and Sweden, part of the 5-Country Oldest Old Project (5-COOP).
Levels of mortality selection among the nonagenarians and centenarians Jacobs, 2011, Israël
[58]
Cross-sectional analysis of the data from the Jerusalem Longitudinal cohort study + survival analysis
N= 840 community dwelling people aged 85 years
Frailty, cognitive impairment and mortality among the oldest old Kingston, 2012, UK Cross-sectional analysis of N= 839 individuals aged ≥85 years Hierarchical ADL
31
Author, year, country [reference]
Study design Population Main topic
[48] baseline data from ‘The
Newcastle 85+ study” Robine, 2012,
France [16]
Ecological study of the relation between centenarian rate and climate characteristics
47 prefectures in Japan Environmental predictors
of longevity
Nosraty, 2012, Finland [18]
Cross-sectional analysis of the baseline data from “The Vitality 90+ Study”
N=1283 individuals aged ³90 years Definition and prevalence of successful ageing Berlau, 2012, USA
[30]
Prospective cohort “The 90+ Study”
N=216 individuals aged ³90 years free of disability at baseline
Risk factors for onset of disability in the oldest old Wu, 2012, China
[31]
Cross-sectional N=870 individuals aged between 90 and
108 years
Relationships between medical conditions, medical diagnosis and disability in
nonagenarians and centenarians Ferrer, 2013, Spain
[22]
Cross-sectional N=273 community-dwelling individuals
aged 86 years included in a randomized-controlled trial
Frailty in the oldest old
Andersen-Randberg, 2013, Denmark [32]
Cross-sectional N=207 Danish centenarians Cardiovascular diseases
in centenarians Edjolo, 2013, France
[14]
Prospective cohort “PAQUID”
N=2578 individuals aged ³70 years at baseline and followed-up for at least 20 years
Predictors of longevity
van Houwelingen, 2013, Netherlands [33]
Prospective cohort “The Leiden 85-plus study”
N=597 individuals aged 85 years at baseline
Disability transitions in the oldest old
Cevenini , 2013, Italy [9]
Prospective cohort of sib-ships
N=1,160 Italian siblings aged ³90 years Classification of the oldest old according to their health status Christensen, 2013,
Denmark [34]
Comparison of two Danish cohorts born 10 years apart
N= 2,262 individuals aged 93 years in the first cohort (born in 1905);
N=1,584 individuals aged 95 years in the second cohort (born in 1915)
Physical and cognitive functioning of people older than 90 years Tiainen, 2013,
Finland [15]
9-year follow-up of the “The Vitality 90+ study”
N=171 men and 717 women aged ³90 years at baseline
Predictors of mortality in men and women aged 90
32
Author, year, country [reference]
Study design Population Main topic
and older Guay, 2014, Canada
[35]
Cross-sectional N=28,406 noninstitutionalized
Canadians aged between 50 and 104 years Description of disability by age Nosraty, 2015, Finland [19] Cross-sectional analysis of the data from “ The Vitality 90+ Study” + survival follow-up
N=1,370 individuals aged ³90 years Successful ageing and longevity after age 90 years
Nosraty, 2015, Finland [20]
Life-story interviews conducted in the context of “The Vitality 90+Study”
N=45 community-dwelling
nonagenarians (25 women and 20 men)
Successful ageing according to nonagenarians