HAL Id: hal-02547829
https://hal.archives-ouvertes.fr/hal-02547829
Submitted on 20 Apr 2020
HAL is a multi-disciplinary open access
archive for the deposit and dissemination of
sci-entific research documents, whether they are
pub-lished or not. The documents may come from
teaching and research institutions in France or
abroad, or from public or private research centers.
L’archive ouverte pluridisciplinaire HAL, est
destinée au dépôt et à la diffusion de documents
scientifiques de niveau recherche, publiés ou non,
émanant des établissements d’enseignement et de
recherche français ou étrangers, des laboratoires
publics ou privés.
Use of personal care products during pregnancy in
relation to urinary concentrations of select phenols: A
longitudinal analysis from the SEPAGES feasibility
study
Dorothy Nakiwala, Céline Vernet, Sarah Lyon-Caen, Anna Lavorel, Matthieu
Rolland, Claire Cracowski, Isabelle Pin, Antonia Calafat, Rémy Slama, Claire
Philippat, et al.
To cite this version:
Dorothy Nakiwala, Céline Vernet, Sarah Lyon-Caen, Anna Lavorel, Matthieu Rolland, et al.. Use
of personal care products during pregnancy in relation to urinary concentrations of select phenols:
A longitudinal analysis from the SEPAGES feasibility study. International Journal of Hygiene and
Environmental Health, Elsevier, 2020, 227, pp.113518. �10.1016/j.ijheh.2020.113518�. �hal-02547829�
Contents lists available atScienceDirect
International Journal of Hygiene and
Environmental Health
journal homepage:www.elsevier.com/locate/ijheh
Use of personal care products during pregnancy in relation to urinary
concentrations of select phenols: A longitudinal analysis from the SEPAGES
feasibility study
Dorothy Nakiwala
a, Céline Vernet
a,b,c, Sarah Lyon-Caen
a, Anna Lavorel
a, Matthieu Rolland
a,
Claire Cracowski
d, Isabelle Pin
a,e, Antonia M. Calafat
f, Rémy Slama
a,1, Claire Philippat
a,∗,1, the
SEPAGES study group (E. Eyriey
g, A. Licinia
g, A. Vellement
g, I. Pin
h,k, P. Ho
ffmann
h, E. Hullo
h,
C. Llerena
h, X. Morin
i, A. Morlot
j, J. Lepeule
k, S. Lyon-Caen
k, C. Philippat
k, J. Quentin
k,
V. Siroux
k, R. Slama
k)
aUniversity Grenoble Alpes, Inserm, CNRS, Team of Environmental Epidemiology Applied to Reproduction and Respiratory Health, Institute for Advanced Biosciences
(IAB), Grenoble, France
bCenter for Environmental Research and Children's Health (CERCH), School of Public Health, University of California, Berkeley, USA cUMRESTTE, Univ Lyon, Univ Gustave Eiffel, IFSTTAR, Bron, France
dUnité de Pharmacologie Clinique, CIC de Grenoble, Grenoble, France eCentre Hospitalier Universitaire (CHU), Service de Pédiatrie, Grenoble, France fCenters for Disease Control and Prevention, Atlanta, GA, USA
gGroupe Hospitalier Mutualiste, Grenoble, France hGrenoble University Hospital, La Tronche, France iClinique des Cèdres, Echirolles, France jClinique Belledonne, Saint-Martin d’Hères, France
kInserm, CNRS, University Grenoble Alpes IAB Research Center, France
A R T I C L E I N F O
Keywords: Benzophenone-3 Bisphenols Parabens
Personal care products Endocrine disruptors Pregnant women
A B S T R A C T
Background: Exposure to certain synthetic phenols is of growing concern, in particular among pregnant women, because of their endocrine disrupting nature. Many phenols are still authorized in personal care products (PCP). We aimed to assess if use of PCPs, by pregnant women could influence their urinary concentrations of synthetic phenols.
Methods: We used a panel design with intense urine sample collection. Eight women completed a diary with exact time and use of PCPs in three weeks. We measured the concentrations of phenols (four parabens, bisphenol A and S, two dichlorophenols, triclosan, and benzophenone-3) in 178 urine samples, collected during 7 con-secutive days at 3 time points during pregnancy. We characterized PCP use as the total number of PCP appli-cations or as a single PCP use (yes/no) in three time windows (0–6, 6 to 12 and 12 to 24h before each urine sample collection). We used adjusted linear and Tobit regressions to assess associations between PCP use and phenol urinary concentrations.
Results: The total number of PCP applications was positively associated with ethylparaben, propylparaben and butylparaben concentrations. We observed a peak in urinary concentration of ethylparaben, butylparaben and propylparaben at 2.86, 2.55 and 2.67 h since last PCP use, respectively and twelve different types of PCPs were positively associated with at least one of these parabens. The bisphenol S concentration increased by 12.4% (95%CI: confidence interval: 5.9; 19.3) for each additional PCP application in the 12 to 24 time window and use of specific PCPs such as anti-stretchmarks cream, facial cleanser and shower gel. Associations varied by time window.
Conclusion: Our study showed that PCP use was associated with a short-term increase in the urinary con-centration of ethylparaben, butylparaben and propylparaben, but not methylparaben. This study also reported a
https://doi.org/10.1016/j.ijheh.2020.113518
Received 6 November 2019; Received in revised form 13 February 2020; Accepted 22 March 2020
Abbreviations: CI, confidence interval; EU, European Union; GW, gestational weeks; ICC, intra-class correlation coefficient; PCP, personal care product; SD, standard deviation
∗Corresponding author. Institute for Advanced Bioscience (IAB), Site Santé, Allée des Alpes, 38700, La Tronche, France.
E-mail address:claire.philippat@inserm.fr(C. Philippat).
1Co-last authors.
International Journal of Hygiene and Environmental Health 227 (2020) 113518
1438-4639/ © 2020 The Authors. Published by Elsevier GmbH. This is an open access article under the CC BY-NC-ND license (http://creativecommons.org/licenses/BY-NC-ND/4.0/).
positive association between the use of PCPs and the bisphenol S concentration, afinding that warrants further investigation in cohorts with repeated collection of urine samples and detailed information on PCP use.
1. Introduction
Phenols constitute a family of aromatic chemical substances of natural and synthetic origin characterized by the presence of a hydroxyl group (C6H5–OH). Certain synthetic phenols such as benzophenone-3,
bisphenols A and S, 2,4- and 2,5-dichlorophenol, triclosan and specific parabens are suspected endocrine disruptors (Boberg et al., 2010;
Huang et al., 2014;Krause et al., 2012; Wetherill et al., 2007). Tox-icological and epidemiological studies have suggested that prenatal exposure to several phenols or their precursors may be associated with various adverse developmental, neurobehavioral, metabolic and re-spiratory effects in the offspring (Ali and Elgoly, 2013;Halden et al., 2017;Rochester, 2013;Ruszkiewicz et al., 2017).
These synthetic compounds are used in various consumer products including food and beverages (parabens), pharmaceuticals (parabens), herbicides/pesticides (2,4-dichlorophenol), thermal receipts, poly-carbonate plastics and epoxy resins (bisphenols), as well as personal care products (PCP) (parabens, as preservatives; benzophenone-3 as a sunblock and triclosan as a microbicide). According to the European Union (EU) regulation No 1223/2009, isopropyl, isobutyl, phenyl, benzyl and pentylparaben are banned from cosmetics, while methyl, ethyl, butyl and propylparaben are still authorized up to 0.4% or 0.8% of product weight in mixtures or in singular use, respectively (EC Regulation, 2014). Triclosan is authorized up to 0.3% (EC Regulation, 2014). Although not known to be used as ingredients, bisphenols have been detected in various PCPs (Dodson et al., 2012;Liao and Kannan, 2014;Lu et al., 2018), likely because of leaching from the packaging (Le et al., 2008). In the EU, the presence of bisphenols in PCPs is not regulated but bisphenol A is recognized as a substance of very high concern. Bisphenol S is of emerging concern based on toxicological results, with similar endocrine disrupting effects as bisphenol A (Qiu et al., 2019) and a few human studies suggesting associations with deleterious health outcomes (Rancière et al., 2019).
Previous epidemiological studies of pregnant women (Ashrap et al., 2018; Braun et al., 2014; Fisher et al., 2017; Meeker et al., 2013), adults, and children (Berger et al., 2018;Ferguson et al., 2017;Fillol et al., 2019;Kim et al., 2018;Nassan et al., 2017;Philippat et al., 2015) reported that use of PCPs (either the total number of PCPs or the use of specific PCPs) was associated with increased urinary concentrations of parabens, triclosan, benzophene-3 and bisphenol A.
With a few exceptions (Fisher et al., 2017;Koch et al., 2014;Nassan et al., 2017), most previous studies characterized use of PCPs as a binary variable (Yes/No) or as the frequency of use in the 24–48 h prior to urine collection, without assessing the exact time of PCP use. These may not be the relevant time windows since experimental studies of non-pregnant humans reported excretion of various phenols to peak between 2 and 11 h after dermal or oral exposure (Janjua et al., 2008;
Morrison et al., 2017; Queckenberg et al., 2010; Shin et al., 2019;
Völkel et al., 2002), suggesting that it would be relevant to look at shorter time windows than those considered in most previous studies (24–48 h prior to urination).
Tofinely characterize associations between PCP use and the urinary concentrations of 10 phenols including bisphenol S, we used a panel design with intense urine collection (8–80 urine samples per partici-pant) and detailed information on PCP use (including timing of use).
First, we assessed if PCP use within 0–6, 6–12 and 12–24 h prior to urination was associated with increases in phenol urinary concentra-tions, and then looked at the time elapsed between PCP use and urine collection with the aim of detecting peaks in phenol urinary con-centrations following product use.
2. Methods
2.1. Study population
The study population consisted of a sub-sample of the SEPAGES-feasibility (Suivi de l'exposition à la pollution atmosphérique durant la Grossesse et Effects sur la Santé) cohort that recruited 40 pregnant women before the 17th gestational week (GW, calculated from the date of the last menstrual period) from private obstetrical practices (Grenoble, France) between July 2012 and July 2013 (Ouidir et al., 2015;Vernet et al., 2018). Exclusion criteria were inability to write or speak French; being under 18 years of age; planning to give birth out-side of the four maternity hospitals of the Grenoble urban are; and not being enrolled in the French social security system. This feasibility cohort was approved by the appropriate ethical committees including the Comité de Protection des Personnes Sud-Est, the Commission Na-tionale de l'Informatique et des Libertés, the Comité Consultatif sur le Traitement de l'Information en matière de Recherche dans le domaine de la Santé and the Agence Nationale de sécurité du Médicament et des produits de santé. All participating women provided written informed consent for biological measurements and data collection. The involve-ment of the Centers for Disease Control and Prevention (CDC) labora-tory was determined not to constitute engagement in human subject research.
2.2. Urine collection during pregnancy, assessment of phenol biomarker concentrations and specific gravity
Pregnant women were followed up for 7 consecutive days at three points during pregnancy (median at 13 GW (min–max: 10–18); 23 GW (min–max: 21–26) and 32 GW (min–max: 29–33)) and during these weeks of follow-up, were asked to collect a sample of all their urine voids and to record the exact date and time of each micturition. Each spot urine sample was collected in a polypropylene container provided by the study team. After collection, urine spot samples were stored at 4 °C in the participants’ home refrigerators until collection by study staff which occurred two or three times per week. The samples were transported in coolers to the INSERM research center (Institute for Advanced Biosciences (IAB), Grenoble), where specific gravity, a marker of urine dilution was measured using a handheld PAL 10-S re-fractometer (Atago, Bellevue, WA, USA). Samples were then aliquoted into polypropylene cryovials and frozen at−80 °C.
We took advantage of a previous project which aimed tofinely characterize variability of phenol urinary biomarker concentrations and relied on the eight women of the SEPAGES-F cohort with the smallest percentage of missing voids (< 5% over the 3 weeks of follow-up) (Vernet et al., 2018). For these women, phenols concentrations were analyzed in a total of 178 samples: 130 (73%) belonged to two women for whom we had no missing void in week 1 (72 voids from woman 1, 42 voids from woman 2) plus 8 voids each, randomly selected during the second and the third collection weeks; and 48 samples from the remaining six women for whom 8 voids each were randomly selected over the 3 weeks of follow up (Vernet et al., 2018).
Urine samples were sent on dry ice to the CDC (Atlanta, GA, USA) where phenols were quantified using online solid-phase extraction high-performance liquid chromatography-isotope dilution-tandem mass spectrometry (Zhou et al., 2014). Total urinary concentrations of 2,4-and 2,5-dichlorophenols, benzophenone-3, bisphenol A, bisphenol S, triclosan, butylparaben, methylparaben, ethylparaben, and propylpar-aben were quantified. 2,4- and 2,5-dichlorophenol are not expected to
D. Nakiwala, et al. International Journal of Hygiene and Environmental Health 227 (2020) 113518
be found in PCPs and were only included in this study as controls (i.e., no association with PCP was expected for these compounds).
2.3. Use of personal care products and confounders
Relying on the date and exact time of each use of PCP reported by the women (the list of PCPs is given inTable 3), we characterized PCP use in relation to each urine void as the total number of PCP applica-tions as well as the use of specific PCPs (yes/no) in the 0–6, 6–12 or 12–24 h before urine collection.
In addition, women provided the date and exact time of food and drink consumption during the follow up weeks. At the start of the study, we also collected information about their anthropometry (weight and height), demographic characteristics, and social economic status in-cluding age, parity, marital status, education level and profession.
2.4. Statistical methods
For phenols with more than 90% detection frequency, associations between use of PCPs and phenol urinary concentration were assessed using adjusted linear regression, where concentrations below the limit of detection (LOD) were replaced by the specific instrumental reading values or with the lowest instrumental reading value divided by the square root of two, when no signal was detected.
To study the associations for phenols with less than 90% detection frequency, we used Tobit models where concentrations below the LOD were considered left-censored (Helsel, 2011;Lubin et al., 2004).
The explained variable in these models was the phenol concentra-tion, and all concentrations were ln-transformed prior to analysis to approach normal distribution.
We considered the total number of PCP applications and the use of specific PCP in the 0–6, 6–12 or 12–24 h before each urine collection as the explanatory variables.
In addition, for all phenols, when we identified a significant positive association with the specific PCPs, we generated timing of exposure (time of PCP use) as the time since last use of any of the identified PCPs. We then assessed the association between the phenol concentrations and timing of exposure with the aim of detecting peaks in phenol concentration. For this analysis, time since last use of a PCP was coded as restricted cubic splines (5 knots).
Adjustment factors were identified a priori as possibly associated with the use of PCP and/or the phenol urinary concentrations. These included the women (fixed effect), specific gravity, time (categories: 0000–0600, 0601–1200, 1201–1800, 1801–2359 h) and day (weekday/ weekend) of urine collection as well as the use of PCP (as the total number of applications or specific PCP use (yes/no)) in the time win-dows other than the one studied (e.g., analysis looking at the associa-tion with PCP use in the 12–24 h time window was adjusted for PCP use in the 0 to 6 and 6–12 h time windows).
In the models exploring the associations of urinary phenol con-centrations with use of a specific PCP (yes/no), for power reasons, PCPs were not considered if the frequency of use was less thanfive times in any of the time windows. These included mouth wash, nail polish, sunscreen, eye shadow and thermal spring water in all windows, in-timate soap in the 0 to 6 and 6–12 h windows, intimate soap in the
6–12 h time windows and toothpaste in the 12–24 h time window. Depending on the analysis, effect estimates were reported as the percent change in the phenol urinary concentration, either 1) for an additional PCP application (analysis relying on the total number of PCP applications); or 2) in a period in which a PCP had been used, compared to a period without PCP use (analysis relying on specific PCP use). 2.5. Sensitivity analyses
We considered other adjustment factors suspected to be associated with phenol urinary concentrations including gestational age at sam-pling, and, for the phenols likely to be found in food (parabens and bisphenols (Liao et al., 2013;Liu et al., 2018;Rudel Ruthann et al., 2011)), the time elapsed since the last meal (food or drink).
For comparison with previous studies, we also considered use of PCP 24 h before urination (Supporting information,Fig. S3).
With the exception of the two dichlorophenols considered as ne-gative controls, the studied phenols were selected because they have been previously detected in various PCPs (Dodson et al., 2012; Guo et al., 2014;Liao and Kannan, 2014;Lu et al., 2018). In addition, higher urinary concentrations of paraben urinary concentrations in relation to use of multiple or single PCPs have been consistently reported in pre-vious studies (Ashrap et al., 2018; Berger et al., 2018; Braun et al., 2014; Ferguson et al., 2017; Fillol et al., 2019; Fisher et al., 2017;
Husøy et al., 2019;Kim et al., 2018;Larsson et al., 2017;Meeker et al., 2013;Nassan et al., 2017;Philippat et al., 2015). Given the consistency in results for an association between PCP use and most of the studied phenols, we decided to not correct our analysis for the number of tests performed (Rothman, 1990). However, because we were aware that chancefindings cannot be rule out, in the discussion section we gave more weight to the associations that were previously described in the literature while other associations should be considered as hypothesis generating.
All analyses were carried out using STATA/SE 14 (StataCorp, College Station, TX, USA) and R version 3.4.3 statistical software.
3. Results
3.1. Study participants
The eight women included in this study were aged between 26.7 and 37.6 years old at enrolment;five were nulliparous; two primiparous and one was multiparous. All women had a college degree (Table 1).
3.2. Urinary phenol concentrations
Of the 178 urine samples collected over the three periods of follow up, 8% (n = 13) were collected between 00 and 6:00, 34% (n = 62) between 6:01 and 12:00, 26% (n = 46) between 12:01 and 18:00 and 32% (n = 57) between 18:01 and 23:59 h. Most samples (71%) were collected during a weekday.
Phenols were detected in more than 74% of the urine samples ex-cept for benzophenone-3 that was only detected in 35% (n = 62) of the samples. The highest concentrations were observed for the four para-bens, followed by triclosan and bisphenol A (Table 2). Spearman
Table 1
Characteristics of the eight women of the SEPAGES feasibility study for whom spot urine samples were analyzed for phenol concentrations.
Woman 1 Woman 2 Woman 3 Woman 4 Woman 5 Woman 6 Woman 7 Woman 8 Age (years) 33.5 27.4 26.7 30.8 37.6 30.6 28.9 28.0 Years of education after high school 6 6 5 7 9 5 5 5
Height (cm) 169 167 162 170 167 169 173 157
Weight before pregnancy (kg) 58 76 71 69 59 62 60 53
Number of children 1 1 0 0 2 0 0 0
correlation coefficients were higher between compounds of similar chemical structures: among the parabens (Spearman's coefficient (rho) = 0.57–0.97) and between the dichlorophenols (rho = 0.53). We also observed moderate positive correlations between bisphenol A and 2,4 dichlorophenol (rho = 0.50) and between triclosan and the di-chlorophenols (rho = 0.49 and 0.53 for 2,4- and 2,5- dichlorophenol, respectively). Spearman correlation coefficients between the phenols and specific gravity ranged from −0.12 (propylparaben) to 0.79 (2,4-dichlorophenol,Table S3). The intraclass correlation coefficients (ICC) for these compounds were previously discussed in detail byVernet et al. (2018). Briefly, we observed high to moderate within-day variability,
with ICCs ranging from 0.03; (95% CI: 0.00, 0.15) for ethylparaben to 0.50 (95% CI: 0.26, 0.73) for bisphenol S (Vernet et al., 2018).
3.3. Use of personal care products
Women reported use of over 23 different PCPs listed inTable 3. The most frequently used PCPs through the day were toothpaste (used in the last 24 h for 98% of the urine samples), face cream (80%), deodorant (76%) and makeup remover (63%) (Table 3). The median number of PCP applications varied by time window and was 1 (min: 0, max:16), 1(min: 0, max:15) and 3 (min:0, max: 12) in the 0 to 6, 6 to 12 and 12–24 h windows preceding urination, respectively.
3.4. Associations between use of PCPs and paraben urinary concentrations
For three of the four parabens assessed, we observed positive as-sociations with the total number of PCP applications, and these varied
Table 2
Distribution of urinary phenol concentrations (μg/L) in 178 urine samples collected from eight women of the SEPAGES feasibility study.
Biomarker LOD % > LOD Percentiles GM Max
5 50 95
Benzophenone-3 0.3 35 < LOD < LOD 17.2 0.8 378.5
Bisphenol A 0.1 99 0.2 1.6 8.9 1.5 30.4 Bisphenol S 0.1 97 0.1 0.3 2.6 0.3 212 2,4 dichlorophenol 0.1 99 0.1 0.3 1.4 0.3 6.2 2,5 dichlorophenol 0.1 98 0.1 0.4 9.2 0.5 278.4 Methylparaben 1.0 99 3.7 128 4080 129.0 8730 Ethylparaben 1.0 83 < LOD 6.1 1262 6.4 203.5 Propylparaben 0.1 100 0.2 14.9 4962 12.1 1253.6 Butylparaben 0.1 90 < LOD 2.0 88.2 1.6 335.4 Triclosan 1.0 74 < LOD 1.8 28.1 1.6 1474.8
LOD: Limit of detection, GM: geometric mean, Max: maximum. Table 3
Number of urine samples for which specific PCPs were used in the 0–24 h preceding urine collection (aN = 169).
PCPs 0–6 h 6–12 h 12–24 h 0–24 h aN (%) aN (%) aN (%) aN (%) Toothpaste 78 (46.2) 93 (55.0) 136 (80.5) 166 (98.2) Face cream 59 (34.9) 58 (34.3) 85 (50.3) 136 (80.5) Deodorant 47 (27.8) 34 (20.1) 57 (33.7) 129 (76.3) Makeup remover 16 (9.5) 35 (20.7) 58 (34.3) 106 (62.7) Mascara 41 (24.3) 32 (18.9) 44 (26.0) 112 (66.3) Foundation 38 (22.5) 31 (18.3) 39 (23.1) 103 (60.9) Bar soap 25 (14.8) 25 (14.8) 39 (23.1) 85 (50.3) Shower gel 26 (15.4) 13 (7.7) 33 (19.5) 66 (39.1) Shampoo 21 (12.4) 18 (10.7) 30 (17.8) 67 (39.6) Body cream 12 (7.1) 14 (8.3) 28 (16.6) 49 (29.0) Conditioner 15 (8.9) 15 (8.9) 20 (11.8) 48 (28.4) Lip/Chapstick 17 (10.1) 17 (10.1) 21 (12.4) 43 (25.4) Perfume 11 (6.5) 8 (4.7) 15 (8.9) 32 (18.9) Contour 16 (9.5) 8 (4.7) 16 (9.5) 36 (21.3) Facial cleanser 11 (6.5) 8 (4.7) 13 (7.7) 26 (15.4) Anti-stretchmarks' cream 10 (5.9) 6 (3.6) 12 (7.1) 23 (13.6) Hand cream 6 (3.6) 4 (2.4) 11 (6.5) 20 (11.8) Intimate soap 4 (2.4) 3 (1.8) 5 (3.0) 12 (7.1) Thermal spring water 5 (3.0) 2 (1.2) 3 (1.8) 8 (4.7) Eye shadow 4 (2.4) 1 (0.6) 1 (0.6) 6 (3.6) Sunscreen cream 1 (0.6) 0 (0) 2 (1.2) 3 (1.8) Nail polish 1 (0.6) 0 (0) 1 (0.6) 2 (1.2) Mouth wash 1 (0.6) 0 (0) 1 (0.6) 2 (1.2)
a
N: Including urine samples collected after thefirst report of PCP use.
Table 4
Adjusted percent change (β) in the phenol urinary concentrations in relation to the total number of PCP applications in the last 0 to 6, 6 to 12 and 12–24 h (N = 169a
urine samples of 8 women).
0–6 h 6–12 h 12–24 h β 95% CI β 95% CI β 95% CI Benzophenone-3 −23.4 [-42.6; 2.2] −16.5 [-37.0; 10.7] 7.0 [-14.2; 33.4] Bisphenol A −5.7 [-10.6;−0.5] −4.1 [-9.4; 1.5] 3.7 [-1.3; 8.9] Bisphenol S 1.2 [-5.1; 8.0] 4.6 [-2.4; 12.1] 12.4 [5.9; 19.3] 2,4 dichlorophenol −2.0 [-4.6; 0.6] −0.2 [-3.0; 2.6] 1.6 [-0.8; 4.0] 2,5 dichlorophenol −2.2 [-4.8; 0.6] −0.6 [-3.5; 2.4] 2.4 [-0.1; 5.0] Methylparaben 0.5 [-6.1; 7.5] 2.7 [-4.4; 10.4] 4.1 [-2.1; 10.8] Ethylparaben 7.9 [0.9; 15.4] −0.7 [-7.6; 6.6] −1.2 [-7.1; 5.0] Propylparaben 7.5 [-1.8; 17.7] 11.1 [0.9; 22.3] 12.9 [3.9; 22.7] Butylparaben 14.8 [5.9; 24.5] 5.3 [-3.4; 14.7] −3.7 [-10.5; 3.7] Triclosan −0.1 [-9.5; 10.3] 3.2 [-7.1; 14.6] 5.5 [-3.7; 15.5]
Effect estimates are reported as the percent change in phenol urinary concentration for an additional PCP application in the studied time window.
Adjustment factors: woman, specific gravity, hour and day of urine sample collection and use of PCP in other time windows than the window considered (i.e. for the 0–6 h window, we adjusted for PCP use in the 6 to 12 and 12–24 h windows, for the 6–12 h window, we adjusted for use in the 0 to 6 and 12–24 h windows and for the 12–24 h window, we adjusted for use in 0–6 and 6–12 h windows).
aN: Including urine samples collected after thefirst report of PCP use.
D. Nakiwala, et al. International Journal of Hygiene and Environmental Health 227 (2020) 113518
by time window across parabens (Table 4). In the 0 to 6 time window, the concentrations of ethylparaben and butylparaben increased by 7.9% (95%CI = 0.9; 15.4) and 14.84% (95%CI = 5.9; 24.5) for each addi-tional PCP application, respectively, while the propylparaben con-centration increased by 11.1% (95%CI = 0.9; 22.3) and 12.9% (95%CI = 3.9; 22.7) for each additional PCP application in the 6–12 h and 12–24 h time windows respectively. No clear association was ob-served for methylparaben in all considered time windows (lowest p-value = 0.2) nor for ethylparaben and butylparaben in the longer time windows (6–12 and 12–24 h, lowest p-value = 0.24).
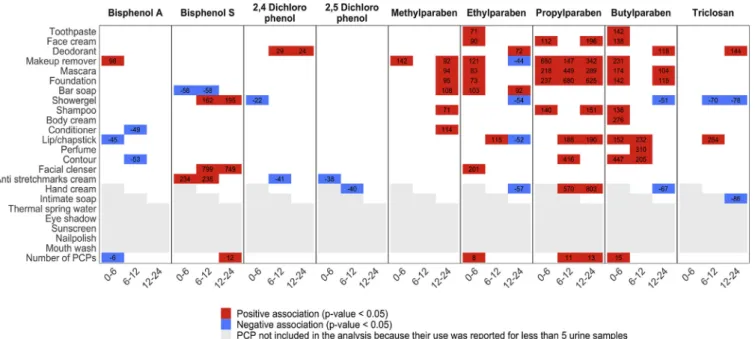
Among the 18 different PCPs considered in the specific PCP ana-lysis, 12 were associated with increased urinary concentrations of one paraben or more in at least one time window. These corresponded to 48 positive associations (25%) out of the 192 tests performed in our main analysis for parabens (17 PCPs * 4 parabens in 0–6 h time window, 16 PCPs * 4 parabens in 6–12 h time window and 18 PCPs * 4 parabens in 12–24 h time window,Fig. 1, Table S6). These PCPs included tooth-paste (ethylparaben, butylparaben), face cream (ethylparaben, pro-pylparaben, butylparaben), hand cream (propro-pylparaben, butylpar-aben), makeup-remover (all parabens), colored cosmetics: mascara (all parabens), foundation (methylparaben, propylparaben, butylparaben), contour and lip/chap stick (ethylparaben, propylparaben, butylpar-aben), bar soap (methylparaben, ethylparbutylpar-aben), shampoo (propylpar-aben), facial cleanser (ethylparaben) and perfume (propylparaben, butylparaben). As observed with the total number of PCP applications, the positive associations for ethylparaben and butylparaben were mostly observed in the 0–6 h window. Most of the positive associations for methylparaben were observed in the 12–24 h window.
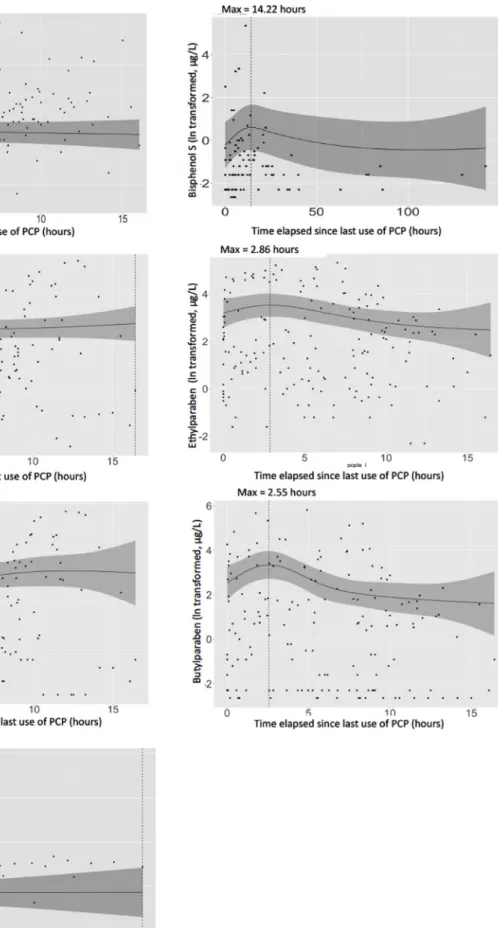
Relying on the time elapsed since last PCP use, we observed a peak in urinary concentration of ethylparaben, butylparaben and pro-pylparaben at 2.86, 2.55 and 2.67 h since last use of a PCP respectively. No peak was observed for methylparaben, for which concentrations tended to remain constant with the time elapsed since last PCP use (Fig. 2).
3.5. Other phenols and PCP use
Bisphenol S concentrations increased by 12.4% (95% CI = 5.9; 19.3,Table 4) for each additional PCP use in the past 12–24 h. No
as-sociation was seen in the earlier time windows. In line with these re-sults, in the analysis relying on time since last PCP use, we observed a peak in bisphenol S urinary concentration at 14.2 h since last PCP use (Fig. 2). Specific PCPs such as anti-stretchmarks cream (in the 0 to 6
and 6–12 h windows), facial cleanser and shower gel (in the 6 to 12 and 12–24 h windows) were positively associated with bisphenol S (Fig. 1,
Table S6).
No positive associations were observed with bisphenol A and the number of PCP applications, in all three time windows considered. In the single PCP use models, the only positive association observed for this compound was with makeup remover use in the 0 to 6 time window (Fig. 1,Table S6). The concentration of bisphenol A tended to remain constant with the time elapsed since last PCP use (Fig. 2).
Null associations were obsevered with the number of PCP applica-tions and concentraapplica-tions of triclosan, benzophenone-3, 2,4 and 2,5 di-chlorophenol. Regarding use of specific PCPs, triclosan concentrations increased with use of deodorant in the 12–24 h window and lip/chap-stick in the 6–12 h window, but remained constant with time elapsed since last PCP use. Use of deodorant was associated with an increase in the 2,4-dichlorophenol urinary concentration (Fig. 1,Table S6).
Benzophenone-3 was excluded from the specific PCP use analysis because of the non-convergence of the Tobit model, probably in relation to the relatively high percentage of samples with non-detectable con-centrations of this phenol (65%).
3.6. Sensitivity analysis
Adjusting for time since last meal and gestational age at urine sampling did not change our main results (Tables S4 and S5, andFig. S2). For comparison with previous studies, results for the 0–24 h time window are displayed in the Supporting InformationFig. S3.
Fig. 1. Adjusted percent change in phenol urinary concentrations with specific PCP use (yes/no) and the total number of PCP applications in the past 0 to 6, 6 to 12 and 12 to 24 h.
Adjustment factors were woman (fixed effect), specific gravity, day and hour of urine sample collection and use of PCP in other windows than the window considered.
Fig. 2. Adjusted associations between the time elapsed since last use of PCP, modeled using restricted cubic splines with 5 knots, and phenol urinary concentrations. Max: time since last use of PCP (in hours) at which highest predicted concentration was observed.
Adjustment factors were woman (fixed effect), specific gravity, time and day of urine collection.
D. Nakiwala, et al. International Journal of Hygiene and Environmental Health 227 (2020) 113518
4. Discussion
This study relying on detailed information on intra-individual var-iations in PCP use and phenol concentrations of eight women in which 178 urine samples were analyzed, suggested that use of many PCPs were positively associated with urinary concentrations of ethylparaben, butylparaben, propylparaben and bisphenol S. These increases in ur-inary concentrations were observed within 0–6 h for ethylparaben and butylparaben, or 12–24 h for bisphenol S after PCP use. Results were unclear for propylparaben, with the analysis relying on time since last use suggesting that the maximal value was attained at approximately 3 h after PCP use (Fig. 2), while the analysis relying on the total number of applications (Table 4) suggested associations in the 6 to 12 and 12–24 h time windows.
4.1. Strengths and limitations
We relied on repeated urine samples to quantify urinary phenol concentrations and we simultaneously collected information on the type of PCP used and the exact time of use. This allowed us to precisely characterize temporal relations between PCP use and phenol urinary concentrations, and to consider shorter time windows of exposure to PCPs (0–6 and 6–12 h prior to urination) than those considered in previous studies which were usually longer than 24 or 48 h prior to urination (Ashrap et al., 2018;Berger et al., 2018;Braun et al., 2014;
Ferguson et al., 2017;Meeker et al., 2013;Nassan et al., 2017;Philippat et al., 2015;Stacy et al., 2017).
Previous studies relying on these longer time windows may have missed the rise in phenol urinary concentrations reported in tox-icokinetic studies within a few hours following PCP use (between 2 and 11 h depending on the compounds and the routes of exposure) (Moos et al., 2016;Queckenberg et al., 2010;Sandborgh-Englund et al., 2006;
Völkel et al., 2002). In addition, for two of the eight women included, we assessed phenol concentrations in all of the urine samples of a week (n = 114). Although restricted to two subjects, this design is ideal if one seeks to detect a rise in urinary concentrations of short-lived com-pounds after a given exposure (e.g., use of PCPs) because all the urine samples produced after the given exposure are available.
Our small sample size (eight pregnant women) is a result of the tradeoff between building on within-subject (temporal) contrasts than between-subject contrasts. Generally, studies like ours, relying on within-subject contrasts are less prone to confounding bias (for example due to differences between subjects using and those not using specific PCPs). The downside is the limited between-subject variability both in terms of metabolism and pattern of use of PCPs, that limits general-izability offindings. For comparison, to our knowledge, one of the two previous studies with such detailed information on both urinary phenol concentrations and PCP use, was also restricted to eight participants (Koch et al., 2014). Furthermore, we cannot rule out residual con-founding arising from other factors not extensively assessed in our study such as use of pharmaceuticals (Dodge et al., 2015;Soni et al., 2005), exposure to thermal receipts’ ink (Liao and Kannan, 2011) and diet, which are sources of some of the studied phenols.
4.2. Associations between use of PCPs and parabens’ urinary concentrations Parabens are commonly used as preservatives in a wide range of PCPs, alone or in combination (Dodson et al., 2012;Guo et al., 2014). The total number of PCP applications was associated with higher ur-inary concentrations of ethylparaben, propylparaben and butylparaben; thesefindings are in line with former findings of studies among preg-nant women (Braun et al., 2014;Fisher et al., 2017) and non-pregnant adults and children (Nassan et al., 2017; Philippat et al., 2015). For these three parabens, we observed a peak in the urinary concentration at approximately 3 h after the last PCP use. This timing is in between what was reported following oral (about 2 h for butylparaben and
proplyparaben among non pregnant individuals (Moos et al., 2016;
Shin et al., 2019)) and dermal exposure (8 h for butylparaben in men (Janjua et al., 2008)), suggesting that urinary concentrations may result from a combination of exposure sources and routes.
Ethylparaben, propylparaben and butylparaben were positively as-sociated with various specific PCPs. Some of these associations were consitent with previous studies; this was in particular the case of as-sociations of these three parabens with creams, colored cosmetics (mascara, foundation and contour) and hair care products (shampoo and conditioner) (Ashrap et al., 2018;Berger et al., 2018;Braun et al., 2014; Fisher et al., 2017; Kim et al., 2018; Meeker et al., 2013;
Philippat et al., 2015); of ethylparaben with cleansers (Fisher et al., 2017); and of butylparaben with deodorant (Fisher et al., 2017;
Philippat et al., 2015), perfume and toothpaste (Fisher et al., 2017). Other associations were highlighted for thefirst time by our study; for all three parabens with makeup remover and for ethylparaben with bar soap, deodorant and toothpaste. Compared to previous studies of pregnant women that assessed associations between PCP use and ur-inary concentrations, the median concentration of ethylparaben and butylparaben were higher in our study (Ashrap et al., 2018; Braun et al., 2014; Fisher et al., 2017; Larsson et al., 2017) while the pro-pylparaben median was similar to that reported in Sweden and Puerto Rico (Ashrap et al., 2018; Larsson et al., 2017) but lower than those reported in the USA (Braun et al., 2014).
Similar to other parabens, methylparaben has been detected in a wide range of PCPs in the USA (Dodson et al., 2012;Guo et al., 2014). In our study this paraben was not clearly associated with the number of PCP applications in all three time window considered, nor with the time elapsed since last PCP use. This could relate to having other pre-dominant sources than PCP use, such as diet (Liao et al., 2013) or pharmaceuticals use (Dodge et al., 2015;Soni et al., 2005) that were not extensively considered in this study. When PCPs were considered separately, methylparaben exhibited positive associations with four, including makeup-remover, colored cosmetics, conditioner and bar soap. Our results for colored cosmetics and soap were in line with previous studies of pregnant women (Ashrap et al., 2018;Braun et al., 2014;Fisher et al., 2017;Meeker et al., 2013), adolescent girls (Berger et al., 2018) and non-pregnant adult women (Fillol et al., 2019;
Philippat et al., 2015). The median concentration of methylparaben in our study was higher than that reported in three of these studies (Ashrap et al., 2018;Braun et al., 2014;Fisher et al., 2017) and lower than that inBraun et al. (2014).
In summary, the associations between the paraben concentrations and PCPs were observed in varying time windows. For a given route of exposure, half-life and excretion time are expected to be relatively si-milar across the four parabens studied (Janjua et al., 2008;Moos et al., 2016; Shin et al., 2019). The differences in time windows could
therefore be due to difference in routes of exposure across parabens. 4.3. Other phenols and PCP use
Studies assessing phenols in PCPs from the USA and China reported presence of bisphenol A and S in lotions, shampoo, conditioner, facial cleansers, sunscreens, lipsticks and toothpaste (Dodson et al., 2012;
Liao and Kannan, 2014;Lu et al., 2018).
In our study, bisphenol S urinary concentration increased with total number of PCP applications in the 12–24 h time window. We observed a peak in urinary concentration 14.2 h after last PCP use. Specific PCPs attributed to this increase were anti-stretchmarks cream, facial cleanser and shower gel, similar to PCPs in which bisphenol S was previously detected in other regions. Two previous studies among Puerto Rican pregnant women (Ashrap et al., 2018) and Norwegian female and male adults (Husøy et al., 2019) did not highlight any associations with PCP use within 24 h prior to urine collection for this phenol, thus our results should be interpreted with caution.
positive associations with mouthwash use have been previously re-ported (Meeker et al., 2013). Bisphenol A has recently been recognized as a substance of very high concern in the EU (ECHA, 2017).
Our results did not strongly support associations between triclosan and the number of PCP applications. In the analysis of specific PCPs analysis, two of the observed associations for triclosan were positive (i.e., increased triclosan concentration following use of deodorant and lip/chap stick) while the other two were negative (i.e. decreasing tri-closan concentration in relation to intimate soap and shower gel). Contrary to a previous publication (Philippat et al., 2015), no sig-nificant association between toothpaste use and triclosan concentration was observed. In the EU, triclosan concentration in toothpaste is limited to a concentration of 0.3% of product weight. We were limited in studying previously reported positive associations between triclosan concentrations and liquid soap, hair spray and sunscreen (Ashrap et al., 2018;Berger et al., 2018;Meeker et al., 2013;Stacy et al., 2017) be-cause of low use of such PCPs in our study population. Concentrations of triclosan in our study were lower than those recorded among preg-nant women from Puerto Rico (Ashrap et al., 2018; Meeker et al., 2013).
We observed no association between aggregated PCP use and ben-zophenone-3 concentrations. Unfortunately we did not have enough variability for both use of sunscreen (reported less than 5 times) and benzophenone-3 concentrations (only 35% of detection) to study this association.
5. Conclusion
Among eight French pregnant women, we observed that the use of PCPs was associated with a short-term increase in urinary concentration of ethylparaben, butylparaben and propylparaben and to some extend (for specific PCP use only) with methylparaben. This was consistent with previous studies conducted among pregnant women and non-pregnant individuals in America and Sweden. This study also reported that use of various PCPs was associated with increased bisphenol S concentrations, a possible substitute of bisphenol A with suspected endocrine disrupting capacity (Qiu et al., 2019). This finding needs replication in further studies.
Disclaimer
Thefindings and conclusions in this report are those of the authors and do not necessarily represent the views of the Centers for Disease Control and Prevention (CDC). Use of trade names is for identification only and does not imply endorsement by the CDC, the Public Health Service, or the US Department of Health and Human Services.
Funding
This project was supported by ANSES (EST-2010-2-130), INSERM, ANR (Shalcoh, ANR-14-CE21-0007; EDeN, 19-CE36-0003-01); Fonds Agir Pour les Maladies Chroniques 2011 (APMC, CDMR R13076CC); AGIRàdom. Dorothy Nakiwala was supported by a doctoral grant from Université Grenoble Alpes.
Acknowledgements
We thank Mrs. A. Benlakhryfa, Mrs. L. Borges, clinical research as-sistants, and the staff from Grenoble Center for Clinical Investigation (CIC): Prof. J.-L. Cracowski, Dr. C. Cracowski, Dr. E. Hodaj, Mrs. D. Abry, Mr. N. Gonnet and Mrs. A. Tournier.
We are grateful for the support of Dr. M. Althuser, Mr. S.Althuser, Dr. F. Camus-Chauvet, Mr. P. Dusonchet, Mrs. S. Dusonchet, Dr. L. Emery, Mrs. P. Fabbrizio, Prof. P. Hoffmann, Dr. D. Marchal André, Dr. X. Morin, Dr. E. Opoix, Dr. L. Pacteau, Dr. P. Rivoire, Mrs. A. Royannais, Dr. C. Tomasella, Dr. T. Tomasella, Dr. D. Tournadre, Mr. P. Viossat,
Mrs. E. Volpi, Mrs. S. Rey, Dr. E. Warembourg, and clinicians from the Grenoble University Hospital in the recruitment of the study volunteers. We also thank Mrs. A. Buchet, Mrs. SF. Caraby, Dr. J-N. Canonica, Mrs. J. Dujourdil, Dr. E. Eyriey, Prof. P. Hoffmann, Mrs. M. Jeannin,Mrs. A. Licina, Dr. X. Morin, Mrs. A. Nicolas, and all midwives from the four maternity wards of Grenoble urban areas.
We also acknowledge the technical assistance of P. Dwivedi, X. Zhou, J. Tao, T. Powell, P. Olive, and the late X. Ye (CDC, Atlanta, GA) in measuring the urinary concentrations of phenol biomarkers and creatinine. We would also like to give our sincere thanks to participants of the SEPAGES feasibility study.
Appendix A. Supplementary data
Supplementary data to this article can be found online athttps:// doi.org/10.1016/j.ijheh.2020.113518.
References
Ali, E.H.A., Elgoly, A.H.M., 2013. Combined prenatal and postnatal butyl paraben ex-posure produces autism-like symptoms in offspring: comparison with valproic acid autistic model. Pharmacol. Biochem. Behav. 111, 102–110.https://doi.org/10.1016/ j.pbb.2013.08.016.
Ashrap, P., Watkins, D.J., Calafat, A.M., Ye, X., Rosario, Z., Brown, P., Vélez-Vega, C.M., Alshawabkeh, A., Cordero, J.F., Meeker, J.D., 2018. Elevated concentrations of ur-inary triclocarban, phenol and paraben among pregnant women in Northern Puerto Rico: predictors and trends. Environ. Int. 121, 990–1002.https://doi.org/10.1016/j. envint.2018.08.020.
Berger, K.P., Kogut, K.R., Bradman, A., She, J., Gavin, Q., Zahedi, R., Parra, K.L., Harley, K.G., 2018. Personal care product use as a predictor of urinary concentrations of certain phthalates, parabens, and phenols in the HERMOSA study. J. Expo. Sci. Environ. Epidemiol.https://doi.org/10.1038/s41370-017-0003-z.
Boberg, J., Taxvig, C., Christiansen, S., Hass, U., 2010. Possible endocrine disrupting effects of parabens and their metabolites. Reprod. Toxicol. Elmsford N 30, 301–312.
https://doi.org/10.1016/j.reprotox.2010.03.011.
Braun, J.M., Just, A.C., Williams, P.L., Smith, K.W., Calafat, A.M., Hauser, R., 2014. Personal care product use and urinary phthalate metabolite and paraben con-centrations during pregnancy among women from a fertility clinic. J. Expo. Sci. Environ. Epidemiol. 24, 459–466.https://doi.org/10.1038/jes.2013.69. Dodge, L.E., Kelley, K.E., Williams, P.L., Williams, M.A., Hernández-Díaz, S., Missmer,
S.A., Hauser, R., 2015. Medications as a source of paraben exposure. Reprod. Toxicol. Elmsford N 52, 93–100.https://doi.org/10.1016/j.reprotox.2015.02.002. Dodson, R.E., Nishioka, M., Standley, L.J., Perovich, L.J., Brody, J.G., Rudel, R.A., 2012.
Endocrine disruptors and asthma-associated chemicals in consumer products. Environ. Health Perspect. 120, 935–943.https://doi.org/10.1289/ehp.1104052.
EC Regulation, C., 2014. Amending annexes II and V to regulation (EC) No 1223/2009 of the European parliament and of the council on cosmetic products. In 358/2014. Off. J. Eur. Union.
ECHA, 2017. 4,4’-isopropylidenediphenol - candidate List of substances of very high concern for Authorisation - ECHA [WWW Document]. accessed 10.29.19..https:// echa.europa.eu/candidate-list-table/-/dislist/details/0b0236e180e22414. Ferguson, K.K., Colacino, J.A., Lewis, R.C., Meeker, J.D., 2017. Personal care product use
among adults in NHANES: associations between urinary phthalate metabolites and phenols and use of mouthwash and sunscreen. J. Expo. Sci. Environ. Epidemiol. 27, 326–332.https://doi.org/10.1038/jes.2016.27.
Fillol, C., Balicco, A., Bidondo, M.-L., Gane, J., Oleko, A., Saoudi, A., Zeghnoun, A., 2019. Imprégnation de la population française par les parabènes; Programme national de biosurveillance. Santé publique France, France Esteban 2014-2016 (No. ISSN: 2609-2174).
Fisher, M., MacPherson, S., Braun, J.M., Hauser, R., Walker, M., Feeley, M., Mallick, R., Bérubé, R., Arbuckle, T.E., 2017. Paraben concentrations in maternal urine and breast milk and its association with personal care product use. Environ. Sci. Technol. 51, 4009–4017.https://doi.org/10.1021/acs.est.6b04302.
Guo, Y., Wang, L., Kannan, K., 2014. Phthalates and parabens in personal care products from China: concentrations and human exposure. Arch. Environ. Contam. Toxicol. 66, 113–119.https://doi.org/10.1007/s00244-013-9937-x.
Halden, R.U., Lindeman, A.E., Aiello, A.E., Andrews, D., Arnold, W.A., Fair, P., Fuoco, R.E., Geer, L.A., Johnson, P.I., Lohmann, R., McNeill, K., Sacks, V.P., Schettler, T., Weber, R., Zoeller, R.T., Blum, A., 2017. Theflorence statement on triclosan and triclocarban. Environ. Health Perspect. 125, 064501.https://doi.org/10.1289/ EHP1788.
Helsel, D.R., 2011. Statistics for Censored Environmental Data Using Minitab and R. John Wiley & Sons.
Huang, H., Du, G., Zhang, W., Hu, J., Wu, D., Song, L., Xia, Y., Wang, X., 2014. The in vitro estrogenic activities of triclosan and triclocarban. J. Appl. Toxicol. JAT 34, 1060–1067.https://doi.org/10.1002/jat.3012.
Husøy, T., Andreassen, M., Hjertholm, H., Carlsen, M.H., Norberg, N., Sprong, C., Papadopoulou, E., Sakhi, A.K., Sabaredzovic, A., Dirven, H.a. a.M., 2019. The Norwegian biomonitoring study from the EU project EuroMix: levels of phenols and phthalates in 24-hour urine samples and exposure sources from food and personal D. Nakiwala, et al. International Journal of Hygiene and Environmental Health 227 (2020) 113518
care products. Environ. Int. 132, 105103.https://doi.org/10.1016/j.envint.2019. 105103.
Janjua, N.R., Frederiksen, H., Skakkebaek, N.E., Wulf, H.C., Andersson, A.-M., 2008. Urinary excretion of phthalates and paraben after repeated whole-body topical ap-plication in humans. Int. J. Androl. 31, 118–130. https://doi.org/10.1111/j.1365-2605.2007.00841.x.
Kim, Sujin, Lee, S., Shin, C., Lee, J., Kim, Sunmi, Lee, A., Park, J., Kho, Y., Moos, R.K., Koch, H.M., Kim, Sungkyoon, Choi, K., 2018. Urinary parabens and triclosan con-centrations and associated exposure characteristics in a Korean population—a com-parison between night-time andfirst-morning urine. Int. J. Hyg Environ. Health 221, 632–641.https://doi.org/10.1016/j.ijheh.2018.03.009.
Koch, H.M., Aylward, L.L., Hays, S.M., Smolders, R., Moos, R.K., Cocker, J., Jones, K., Warren, N., Levy, L., Bevan, R., 2014. Inter- and intra-individual variation in urinary biomarker concentrations over a 6-day sampling period. Part 2: personal care product ingredients. Toxicol. Lett., Adv. Biol. Monit. Occup. Environ. Health - II 231, 261–269.https://doi.org/10.1016/j.toxlet.2014.06.023.
Krause, M., Klit, A., Blomberg Jensen, M., Søeborg, T., Frederiksen, H., Schlumpf, M., Lichtensteiger, W., Skakkebaek, N.E., Drzewiecki, K.T., 2012. Sunscreens: are they beneficial for health? An overview of endocrine disrupting properties of UV-filters. Int. J. Androl. 35, 424–436.https://doi.org/10.1111/j.1365-2605.2012.01280.x. Larsson, K., Lindh, C.H., Jönsson, B.A., Giovanoulis, G., Bibi, M., Bottai, M., Bergström,
A., Berglund, M., 2017. Phthalates, non-phthalate plasticizers and bisphenols in Swedish preschool dust in relation to children's exposure. Environ. Int. 102, 114–124.
https://doi.org/10.1016/j.envint.2017.02.006.
Le, H.H., Carlson, E.M., Chua, J.P., Belcher, S.M., 2008. Bisphenol A is released from polycarbonate drinking bottles and mimics the neurotoxic actions of estrogen in developing cerebellar neurons. Toxicol. Lett. 176, 149–156.https://doi.org/10. 1016/j.toxlet.2007.11.001.
Liao, C., Kannan, K., 2014. A survey of alkylphenols, bisphenols, and triclosan in personal care products from China and the United States. Arch. Environ. Contam. Toxicol. 67, 50–59.https://doi.org/10.1007/s00244-014-0016-8.
Liao, C., Kannan, K., 2011. Widespread occurrence of bisphenol A in paper and paper products: implications for human exposure. Environ. Sci. Technol. 45, 9372–9379.
https://doi.org/10.1021/es202507f.
Liao, C., Liu, F., Kannan, K., 2013. Occurrence of and dietary exposure to parabens in foodstuffs from the United States. Environ. Sci. Technol. 47, 3918–3925.https://doi. org/10.1021/es400724s.
Liu, J., Wattar, N., Field, C.J., Dinu, I., Dewey, D., Martin, J.W., APrON study team, 2018. Exposure and dietary sources of bisphenol A (BPA) and BPA-alternatives among mothers in the APrON cohort study. Environ. Int. 119, 319–326.https://doi.org/10. 1016/j.envint.2018.07.001.
Lu, S., Yu, Yuling, Ren, L., Zhang, X., Liu, G., Yu, Yingxin, 2018. Estimation of intake and uptake of bisphenols and triclosan from personal care products by dermal contact. Sci. Total Environ. 621, 1389–1396.https://doi.org/10.1016/j.scitotenv.2017.10. 088.
Lubin, J.H., Colt, J.S., Camann, D., Davis, S., Cerhan, J.R., Severson, R.K., Bernstein, L., Hartge, P., 2004. Epidemiologic evaluation of measurement data in the presence of detection limits. Environ. Health Perspect. 112, 1691–1696.https://doi.org/10. 1289/ehp.7199.
Meeker, J.D., Cantonwine, D.E., Rivera-González, L.O., Ferguson, K.K., Mukherjee, B., Calafat, A.M., Ye, X., Anzalota Del Toro, L.V., Crespo-Hernández, N., Jiménez-Vélez, B., Alshawabkeh, A.N., Cordero, J.F., 2013. Distribution, variability, and predictors of urinary concentrations of phenols and parabens among pregnant women in Puerto Rico. Environ. Sci. Technol. 47, 3439–3447.https://doi.org/10.1021/es400510g. Moos, R.K., Angerer, J., Dierkes, G., Brüning, T., Koch, H.M., 2016. Metabolism and
elimination of methyl, iso- and n-butyl paraben in human urine after single oral dosage. Arch. Toxicol. 90, 2699–2709.https://doi.org/10.1007/s00204-015-1636-0. Morrison, G.C., Bekö, G., Weschler, C.J., Schripp, T., Salthammer, T., Hill, J., Andersson, A.-M., Toftum, J., Clausen, G., Frederiksen, H., 2017. Dermal uptake of benzophe-none-3 from clothing. Environ. Sci. Technol. 51, 11371–11379.https://doi.org/10. 1021/acs.est.7b02623.
Nassan, F.L., Coull, B.A., Gaskins, A.J., Williams, M.A., Skakkebaek, N.E., Ford, J.B., Ye, X., Calafat, A.M., Braun, J.M., Hauser, R., 2017. Personal care product use in men and urinary concentrations of select phthalate metabolites and parabens: results from the environment and reproductive health (EARTH) study. Environ. Health Perspect. 125.
https://doi.org/10.1289/EHP1374.
Ouidir, M., Giorgis-Allemand, L., Lyon-Caen, S., Morelli, X., Cracowski, C., Pontet, S., Pin, I., Lepeule, J., Siroux, V., Slama, R., 2015. Estimation of exposure to atmospheric pollutants during pregnancy integrating space-time activity and indoor air levels: does it make a difference? Environ. Int. 84, 161–173.https://doi.org/10.1016/j. envint.2015.07.021.
Philippat, C., Bennett, D., Calafat, A.M., Picciotto, I.H., 2015. Exposure to select phtha-lates and phenols through use of personal care products among Californian adults and their children. Environ. Res. 140, 369–376.https://doi.org/10.1016/j.envres.2015. 04.009.
Qiu, W., Zhan, H., Hu, J., Zhang, T., Xu, H., Wong, M., Xu, B., Zheng, C., 2019. The occurrence, potential toxicity, and toxicity mechanism of bisphenol S, a substitute of bisphenol A: a critical review of recent progress. Ecotoxicol. Environ. Saf. 173, 192–202.https://doi.org/10.1016/j.ecoenv.2019.01.114.
Queckenberg, C., Meins, J., Wachall, B., Doroshyenko, O., Tomalik-Scharte, D., Bastian, B., Abdel-Tawab, M., Fuhr, U., 2010. Absorption, pharmacokinetics, and safety of triclosan after dermal administration. Antimicrob. Agents Chemother. 54, 570–572.
https://doi.org/10.1128/AAC.00615-09.
Rancière, F., Rémy, Slama, Lacroix Marlène, Z., Debrauwer, Laurent, Charles, Marie Aline, Roussel, Ronan, Balkau, Beverley, Magliano, Dianna J., 2019. Exposure to bisphenol A and bisphenol S and incident type 2 diabetes: a case–cohort study in the French cohort D.E.S.I.R. Environ. Health Perspect. 127, 107013.https://doi.org/10. 1289/EHP5159.null null.
Rochester, J.R., 2013. Bisphenol A and human health: a review of the literature. Reprod. Toxicol. Elmsford N 42, 132–155.https://doi.org/10.1016/j.reprotox.2013.08.008.
Rothman, K.J., 1990. No adjustments are needed for multiple comparisons. Epidemiol. Camb. Mass 1, 43–46.
Rudel Ruthann, A., Gray Janet, M., Engel Connie, L., Rawsthorne Teresa, W., Dodson Robin, E., Ackerman Janet, M., Rizzo, Jeanne, Nudelman Janet, L., Green, Brody Julia, 2011. Food packaging and bisphenol A and bis(2-ethyhexyl) phthalate ex-posure:findings from a dietary intervention. Environ. Health Perspect. 119, 914–920.
https://doi.org/10.1289/ehp.1003170.
Ruszkiewicz, J.A., Pinkas, A., Ferrer, B., Peres, T.V., Tsatsakis, A., Aschner, M., 2017. Neurotoxic effect of active ingredients in sunscreen products, a contemporary review. Toxicol. Rep. 4, 245–259.https://doi.org/10.1016/j.toxrep.2017.05.006. Sandborgh-Englund, G., Adolfsson-Erici, M., Odham, G., Ekstrand, J., 2006.
Pharmacokinetics of triclosan following oral ingestion in humans. J. Toxicol. Environ. Health A 69, 1861–1873.https://doi.org/10.1080/15287390600631706. Shin, M.-Y., Shin, C., Choi, J.W., Lee, J., Lee, S., Kim, S., 2019. Pharmacokinetic profile of
propyl paraben in humans after oral administration. Environ. Int. 130, 104917.
https://doi.org/10.1016/j.envint.2019.104917.
Soni, M.G., Carabin, I.G., Burdock, G.A., 2005. Safety assessment of esters of p-hydro-xybenzoic acid (parabens). Food Chem. Toxicol. Int. J. Publ. Br. Ind. Biol. Res. Assoc. 43, 985–1015.https://doi.org/10.1016/j.fct.2005.01.020.
Stacy, S.L., Eliot, M., Etzel, T., Papandonatos, G., Calafat, A.M., Chen, A., Hauser, R., Lanphear, B.P., Sathyanarayana, S., Ye, X., Yolton, K., Braun, J.M., 2017. Patterns, variability, and predictors of urinary triclosan concentrations during pregnancy and childhood. Environ. Sci. Technol. 51, 6404–6413.https://doi.org/10.1021/acs.est. 7b00325.
Vernet, C., Philippat, C., Calafat, A.M., Ye, X., Lyon-Caen, S., Siroux, V., Schisterman, E.F., Slama, R., 2018. Within-day, between-day, and between-week variability of urinary concentrations of phenol biomarkers in pregnant women. Environ. Health Perspect. 126, 037005.https://doi.org/10.1289/EHP1994.
Völkel, W., Colnot, T., Csanády, G.A., Filser, J.G., Dekant, W., 2002. Metabolism and kinetics of bisphenol A in humans at low doses following oral administration. Chem. Res. Toxicol. 15, 1281–1287.https://doi.org/10.1021/tx025548t.
Wetherill, Y.B., Akingbemi, B.T., Kanno, J., McLachlan, J.A., Nadal, A., Sonnenschein, C., Watson, C.S., Zoeller, R.T., Belcher, S.M., 2007. In vitro molecular mechanisms of bisphenol A action. Reprod. Toxicol. Elmsford N 24, 178–198.https://doi.org/10. 1016/j.reprotox.2007.05.010.
Zhou, X., Kramer, J.P., Calafat, A.M., Ye, X., 2014. Automated on-line column-switching high performance liquid chromatography isotope dilution tandem mass spectrometry method for the quantification of bisphenol A, bisphenol F, bisphenol S, and 11 other phenols in urine. J. Chromatogr. B Analyt. Technol. Biomed. Life. Sci. 944, 152–156.