MUSCULOSKELETAL
Dixon-based MRI for assessment of muscle-fat content
in phantoms, healthy volunteers and patients with achillodynia:
comparison to visual assessment of calf muscle quality
Michael. A. Fischer&Christian W. A. Pfirrmann&
Norman Espinosa&Dimitri A. Raptis&Florian M. Buck
Received: 26 November 2013 / Revised: 24 January 2014 / Accepted: 11 February 2014 / Published online: 7 March 2014 # European Society of Radiology 2014
Abstract
Objectives To quantify the muscle fat-content (MFC) in phan-toms, volunteers and patients with achillodynia using two-point Dixon-based magnetic resonance imaging (2pt-MRIDIXON) in comparison to MR spectroscopy (MRS) and
visual assessment of MFC.
Methods Two-point Dixon-based MRI was used to measure the MFC of 15 phantoms containing 0-100 % fat-content and calf muscles in 30 patients (13 women; 57±15 years) with achillodynia and in 20 volunteers (10 women; 30±14 years) at 1.5 T. The accuracy of 2pt-MRIDIXON in quantification of
MFC was assessed in vitro using phantoms and in vivo using MRS as the standard of reference. Fat-fractions derived from 2pt-MRIDIXON(FFDIXON) and MRS (FFMRS) were related to
visual assessment of MFC (Goutallier grades 0–4) and Achilles-tendon quality (grade 0-4).
Results Excellent linear correlation was demonstrated for FFDIXON with phantoms and with FFMRS in patients (pc=
0.997/0.995; p<0.001). FFDIXONof the gastrocnemius muscle
was significantly higher (p=0.002) in patients (7.0 %±4.7 %) compared with volunteers (3.6 %±0.7 %), whereas visual-grading showed no difference between both groups (p>0.05). FFMRSand FFDIXONwere significantly higher in subjects with
(>grade 1) structural damage of the Achilles-tendon (p= 0.01).
Conclusions Two-point Dixon-based MRI allows for accurate quantification of MFC, outperforming visual assessment of calf muscle fat. Structural damage of the Achilles tendon is associated with a significantly higher MFC.
Key points
• Two-point Dixon-based MRI allows accurate quantification of muscular fat content (MFC).
• Quantitative analysis outperforms visual analysis in the detection of elevated MFC.
• Achillodynia results in an increased MFC of the gastrocne-mius muscles.
• Structural damage of the Achilles tendon further increases the MFC.
Keywords Achilles tendon . Muscle . Fat quantification . Two-point Dixon technique . Magnetic resonance imaging Abbreviations
MFC Muscle fat content
2pt-MRIDIXON Two-point Dixon-based MRI
FF Fat fraction
Introduction
Magnetic resonance imaging (MRI) is considered a reliable technique for evaluating muscle quality by monitoring mor-phological changes like muscular atrophy and fatty degener-ation [1]. MR spectroscopy (MRS), which provides the refer-ence standard of non-invasive quantification of fat, has been challenged by two-point Dixon-based MRI (2pt-MRIDIXON)
with chemical shift selective reconstruction of fat- and water-signal only image series [2]. Two-point Dixon-based MRI promises significant advantages over MRS including fast volumetric coverage of muscular anatomy with the possibility M. A. Fischer (*)
:
C. W. A. Pfirrmann:
F. M. BuckRadiology, University Hospital Balgrist, Forchstrasse 340, 8008 Zurich, Switzerland
e-mail: michaelalexander.fischer@usz.ch N. Espinosa
Department of Orthopedic Surgery, University Hospital Balgrist, Forchstrasse 340, 8008 Zurich, Switzerland
D. A. Raptis
Clinic of Visceral and Transplant Surgery, University Hospital Zurich, Raemistrasse 100, 8091 Zurich, Switzerland
of postprocessing capabilities such as multiplanar reforma-tions [3]. Moreover, muscular fat content (MFC) can be assessed retrospectively by determining a region of interest (ROI) to eliminate sampling errors, which could result from inadequate positioning of the MRS voxel or inadequate site of biopsy [4].
Achillodynia is the most common pain-related disability in sport and either caused by an injury of the Achilles tendon itself or by an inflammatory process occurring in the sur-rounding tissues [5]. Concerning pathophysiology, a series of mechanisms reducing tissue perfusion and mechanical irritation lead to degeneration of the tendon [6]. Fatty degen-eration of the calf muscles is a common finding in patients with tendinosis [7] and is probably the result of altered mus-culoskeletal function. Vice versa, abnormal muscle function is speculated to be a risk factor for Achilles tendinopathy [8]. Similar to the rotator cuff in the shoulder, the quality of the soleus and gastrocnemius muscles may be a predictive factor for the outcome after treatment of the Achilles tendon [9,10]. Accurate quantification of the calf muscle fat content in pa-tients with achillodynia could therefore aid assessment of muscular function prior to surgery or prior to rehabilitation programs and serve as a biomarker for disease progress.
Thus, the objectives of this prospective study were: (1) to evaluate the accuracy of a standard 2pt-MRIDIXON product
sequence for quantification of MFC and (2) to quantify the MFC of the gastrocnemius and the tibialis anterior muscle in patients with achillodynia and healthy volunteers using 2pt-MRIDIXONand MRS in comparison to visual assessment of
calf muscle quality.
Material and methods Phantom study Phantoms
The in vitro study included 15 polypropylene test tubes (Fal-con; Becton Dickinson, Franklin Lakes, NJ, USA) containing 10 ml of homogenised mixtures of muscle tissue (veal meat) and fat (goose fat) at concentrations of 0, 2, 4, 6, 8, 10, 20, 30, 40, 50, 60, 70, 80, 90 and 100 % as well as one control test tube (C) containing pure and untreated muscle tissue. All test tubes were placed in a plastic box (22×30×40 cm) filled with a solution of water and gadolinium-based contrast medium (0.25 %) (Fig.1).
Sample preparation was performed according to a previous study evaluating liver fat [11]: muscle tissue was cleaned from extracellular fat and blood remnants using a heparin/water (1/10) solution (heparin, 25,000 IU/5 ml), homogenised me-chanically in a commercially available mixer (Braun PowerBlend MX 2000; Braun, Pfungstadt, Germany) and
quantitatively titrated (volume %) using a 5-ml multi-sampler (Multipett plus; Eppendorf, Hamburg, Germany). Liquid goose fat was titrated up to 10 ml using a 1-ml pipette and both components were homogenised and centrifuged thereafter.
Veal meat was chosen as a target matrix since it closely matches human muscle tissue and does not contain significant intracellular fat [12], whereas goose fat was chosen due to its low melting point (approx. 35 °C) and high percentage of organic fat (approx. 99 %) allowing for good sample homog-enisation and accurate fat titration.
Data acquisition
Two-point Dixon gradient-echo MRI with an automatic chemical-shift selective reconstruction algorithm was per-formed on a 1.5-T MRI system (Avanto; Siemens Medical Healthcare, Erlangen, Germany) using a dedicated body-array coil. This algorithm was shown to provide stable water- and fat-signal separation for dual-echo imaging using phase infor-mation to resolve the ambiguity of fat and water signal in chemical-shift imaging [3,13]. Sequence specifications and imaging parameters are given in Table1.
Data analysis
Data analysis was performed using Osirix (version 5.5.1; OsiriX Imaging Software, open-source DICOM viewer,
www.osirix-viewer.com). Fat- and water-image sets (Fig.1)
were loaded and automatically co-registered in the viewer function of OsiriX. One musculoskeletal radiologist (M.A.F., 5 years of experience), who was blinded to the known MFC of the phantoms, evaluated both image sets by placing an ROI along the coronal plane of each phantom. ROIs were copied to the corresponding image set and carefully adjusted to cover the entire volume of the phantom without integrating external structures.
For each phantom, the fat fraction (FFDIXON) was
calculat-ed from signal intensities derivcalculat-ed from fat-only images (SIFAT)
and water-only images (SIWATER) according to the following
algorithm:
FFDIXON¼ SIFAT ðSIFATþ SIWATERÞ ð1Þ
In vivo study
This was a prospective study with local ethics committee approval. Written informed consent was obtained from all study subjects.
Patients
The patient group consisted of 30 consecutive patients (12 women, 18 men; mean age, 57±15 years; age range, 27-86 years) who underwent MRI of the Achilles tendon due to achillodynia. Inclusion criteria were a clinical diagnosis of achillodynia by the referring clinician, which was defined as Achilles tendon pain of more than 2 months in duration. Exclusion criteria were general contraindication for MRI, prior surgery, neurological disorders, systemic inflammatory disease, acute trauma and disorders of the ankle other than Achilles tendon disease.
Healthy volunteers
The control group consisted of 20 asymptomatic volun-teers (9 women, 11 men; mean age, 49 ± 14 years; age range, 30-76 years) matched to the patient group ac-cording to sex. Inclusion criteria were absence of achillodynia within the past 2 years. Professional and semi-professional athletes were excluded from the con-trol group and volunteers were asked to rest for at least 24 h before examination, as exercise might potentially bias Dixon-based measurements [14]. All other exclu-sion criteria equalled the patient group.
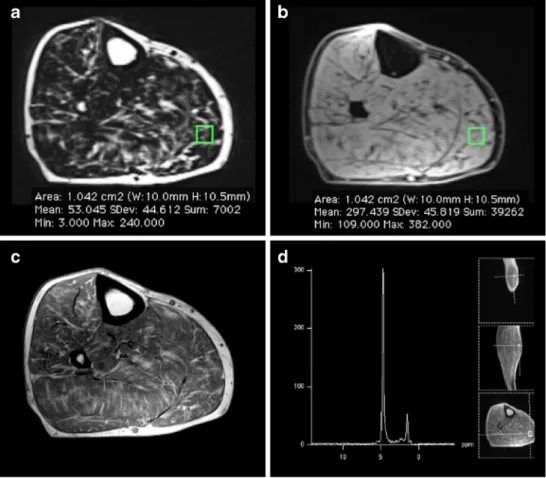
Fig. 1 In vitro measurement of Dixon-based MRI fat fractions. a Muscle/fat phantoms and corresponding MR image sets derived from a 2-point Dixon gradient-echo MRI sequence with automatic reconstruction of (b) water- and (c) fat-only images in the axial plane (muscle fat content: 0, 2, 4, 6, 8, 10, 20, 30, 40, 50, 60, 70, 80, 90 and 100%; C, control)
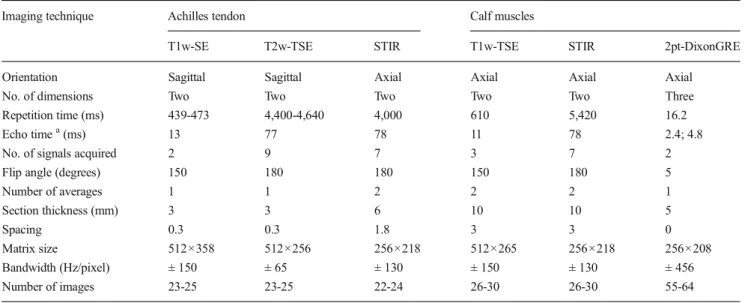
Table 1 MRI protocol and corresponding imaging parameters
Imaging technique Achilles tendon Calf muscles
T1w-SE T2w-TSE STIR T1w-TSE STIR 2pt-DixonGRE
Orientation Sagittal Sagittal Axial Axial Axial Axial
No. of dimensions Two Two Two Two Two Three
Repetition time (ms) 439-473 4,400-4,640 4,000 610 5,420 16.2
Echo timea(ms) 13 77 78 11 78 2.4; 4.8
No. of signals acquired 2 9 7 3 7 2
Flip angle (degrees) 150 180 180 150 180 5
Number of averages 1 1 2 2 2 1 Section thickness (mm) 3 3 6 10 10 5 Spacing 0.3 0.3 1.8 3 3 0 Matrix size 512×358 512×256 256×218 512×265 256×218 256×208 Bandwidth (Hz/pixel) ± 150 ± 65 ± 130 ± 150 ± 130 ± 456 Number of images 23-25 23-25 22-24 26-30 26-30 55-64
2pt-Dixon two-point Dixon-based reconstruction of fat- and water-only images, 3pt-Dixon three-point Dixon-based reconstruction of fat- and water-only images, GRE gradient-echo sequence, SE spin-echo sequence, STIR short TI inversion recovery sequence, TSE turbo spin-echo sequence, T1w T1-weighted imaging, T2w T2-T1-weighted imaging
a
Data acquisition
All study subjects underwent standard clinical MRI of the Achilles tendon and additional Dixon-based MRI as well as MRS using the same 1.5-T MR system (Avanto; Siemens Medical Solutions, Erlangen, Germany) as in the phantom study (Fig.2). Patients and volunteers were examined in the supine position with a dedicated transmit-receive extremity coil for the Achilles tendon and phased-array body coil (both from Siemens Medical Solutions, Erlangen, Germany) for imaging the calf muscles.
The study protocol consisted of the standard clinical MRI protocol at our department for the examination of patients with achillodynia as well as the previously mentioned 2pt-MRIDixonsequence. Imaging parameters are displayed in
Ta-ble1. In addition we performed a high-speed T2-corrected multi-echo1H MRS, serving as the standard of reference [15]. Spectra were obtained in two different locations by placing an 8-cm3voxel (20×20×20 mm) in the medial or lateral head of the gastrocnemius muscle and in the centre of the tibialis anterior muscle. Voxel placement was performed on transver-sal standard clinical T1-weighted MR images avoiding muscle fascia and vessels and position of the voxel was saved as DICOM file along with the corresponding spectral analysis. The MRS sequence applied is based on a single-voxel
stimulated-echo acquisition mode (STEAM) using the follow-ing parameters: repetition time, 3,000 ms; echo times, 12/24/ 36/48/72 ms; acquired points, 1,024; bandwidth, 1,200 Hz; mixing time, 10 ms. The algorithm integrated the water (from 3.6 to 5.8 ppm) and lipid (methylene and methyl signals of α-CH2, (CH2)n-2, and CH3from 0 to 3.6 ppm) signals for each
TE and spectral integrals (S) were measured at each TE. Monoexponential curve fits were automatically performed with least-squares approximation by using the equation S = M0 exp(-R2 × TE) to estimate R2 and M0 (the equilibrium magnetisation) for water and lipid signals individually [15]. Data analysis
Quantitative analysis The quantitative analysis was per-formed by the same radiologist (M.A.F.) doing the ex vivo measurement, blinded to the results of the qualitative image analysis.
For image-based assessment of the MFC, the fat- and water-image sets derived from 2pt-Dixon of each patient were loaded simultaneously with the reference images of spectro-scopic ROI positioning into the viewer function of OsiriX (Fig. 2). An ROI with in-plane dimensions matching those of the MRS voxel was placed in the reference image (over-laying the MRS voxel) and copied to the corresponding
fat-Fig. 2 In vivo measurement of fat-fractions derived from 2-point Dixon gradient-echo MRI (FFDIXON) and MR-spectroscopy
(FFMRS) in a 77-year-old male
patient with achillodynia. FFDIXON(15 %) were calculated
by placing an ROI in the gastrocnemius muscle on both the fat- (a) and water- (b) only image corresponding to the
spectroscopic voxel (d). FFMRS
(16 %) integrated the water (from 3.6 to 5.8 ppm) and lipid (methylene and methyl signals of α-CH2, (CH2)n-2, and CH3from 0
to 3.6 ppm) signals of the spectral analysis (d). In comparison, T1-weighted images (c) were evaluated semi-quantitatively for fatty infiltration according to Goutallier (grade 2)
and water-signal only images. Fat fractions (FFDIXON) were
then calculated separately for both muscles according to the previously mentioned algorithm (Eq.1).
Spectroscopic assessment of MFC was performed automat-ically by an integrated post-processing algorithm yielding T2 corrected spectroscopic fat fractions (FFMRS) of both muscles
as well as R2 of water- and fat- signal. FFMRSwas calculated
equally to the Dixon-based algorithm (Eq.1).
Qualitative analysis Two independent musculoskeletal radi-ologists (F.M.B. with 9 years of experience and C.W.P. with 14 years of experience), who were blinded to all other findings but the clinical MRI protocol, performed the qualitative anal-ysis. Both readers visually assessed the quality of the Achilles tendon as well as the quality of the gastrocnemius and the tibialis anterior muscle in two reading sessions with a gap of 6 weeks between both sessions. All images were interpreted on a standard workstation using an integrated picture archiv-ing and communication system (IMPAX 6; Agfa HealthCare, Bonn, Germany) and were presented to the readers with the minimum of annotations allowed by the software.
The quality of the Achilles tendon was rated on a five-point scale [5] with the following specifications: 0, “normal ten-don”, concave shape and no T1-/T2- signal alterations; 1, “paratendinosis”, hyperintense signal of the paratendinous soft tissue on STIR-images; 2, “tendinosis”, tendon thickening, convex spindle-shape, normal signal or hy-perintense areas on T1-weighted images; 3, “partial tear”, tendon thickening, hyperintense on T1- and T2-weighted images; 4, “complete tear”, discontinuity of the Achilles tendon.
Extent of fatty degeneration of the gastrocnemius muscle and the tibialis anterior muscle was estimated on T1-weighted images using the five-point scale according to Goutallier et al. [16]: 0, none; 1, subtle fatty degeneration; 2, muscle tissue > fatty degeneration; 3, muscle tissue≈ fatty degeneration; 4, fatty degeneration > muscle tissue.
Statistical analysis
The data was descriptively reviewed and statistically tested for normality with the Kolmogorov-Smirnov test. All results were expressed as means ± standard deviations; pvalues <0.05 were considered statistically significant. All statistical analyses were performed using commercially available software (re-lease 20.0; SPSS, Chicago, IL USA).
Quantitative analysis (continues variables, normal distribution)
Correlations between FFDIXONand titrated MFC of the
phan-tom study as well as FFMRSof the in-vivo study were assessed
using Lin’s concordance correlation coefficient (pc) with 95 %
confidence interval (CI) [17], whereas correlation between FFDIXON and study subjects’ gender and age was assessed
with the Spearman's rank correlation coefficient (ρ). Linear regression analysis was used to evaluate the goodness of fit of the linear regression model.
Student’s t-test was used to test for significant differences between patients and volunteers as well as between different groups of tendinosis.
Qualitative analysis (ordinal variables)
Inter-observer agreement was assessed by using kappa-statistics (κ) and interpreted as follows: a κ value greater than 0.81 corresponded to excellent agreement, aκ value of 0.61-0.80 corresponded to good interobserver agreement, aκ value of 0.41-0.60 corresponded to moderate interobserver agree-ment, and a κ value of 0.21- 0.40 corresponded to poor interobserver agreement. Data of the consensus readings was used for further analysis.
The Mann-Whitney U test was used to evaluate significant differences in visual grading of fatty muscle infiltration be-tween patients and healthy volunteers.
Results
Quantitative analysis Phantom study
FFDIXONshowed excellent correlation with titrated MFC from
0 to 100 % (pc, 0.997; 95 % CI, 0.993–0.999; p<0.001).
Linear regression analysis revealed a slope of 0.95 and an intercept with the y-axis of 1.84, with a corresponding stan-dard error of the estimated parameters of 0.02 and 0.80 re-spectively (both, p<0.05).
FFDIXON showed a good correlation with titrated
MFC in a clinically relevant range from 0 to 30 % (pc, 0.971; 95 % CI, 0.918–0.990; p<0.001). Linear
regression analysis revealed a slope of 0.84 and an intercept with the y-axis of 2.73, with a corresponding standard error of the estimated parameters of 0.04 and 0.56 respectively (both, p < 0.01) (Fig. 3).
In vivo study
FFDIXONand FFMRSwere obtained in 30 patients and 20
volunteers within the gastrocnemius muscle and tibialis ante-rior muscle. Results of quantitative MFC analysis using MRS and 2pt-DixonGREare given in Table2.
Good correlation was observed between FFDIXON and
FFMRS (pc, 0.951; 95 % CI, 0.927–0.973; p<0.001). There
(p>0.05) with a mean measurement bias of +0.4 % (limits of agreement, -2.8 % to +3.7 %). Linear regression analysis revealed a slope of 0.85 and an intercept with the y-axis of 0.68, with a corresponding standard error of 0.04 and 0.23 (both, p<0.01) (Fig.3).
Student’s t-test revealed a significantly higher FFDIXONof
the gastrocnemius muscle in patients compared with volun-teers (p=0.002), whereas no difference was identified for FFDIXONof the tibialis anterior muscle between both groups
(p>0.05) (Fig.4). There was no significant correlation be-tween FFDIXON of the gastrocnemius and tibialis anterior
muscles, visual-grading of the Achilles tendon quality and characteristics of study subjects (gender and age) for all con-stellations (ρ, 0.05-0.32; p>0.05), except FFDIXONand age of
patients and volunteers (p=0.02; p=0.006). However, the latter showed poor correlation coefficients (ρ) for both of 0.49 and 0.50 respectively.
Qualitative analysis
Inter-observer agreement was excellent for visual assessment of Achilles tendon quality (κ=0.811; p<0.001); good for visual grading of the fatty degeneration of the gastrocnemius muscle (κ=0.633; p<0.001); and moderate for visual grading of the tibialis anterior muscle (κ=0.542; p<0.001).
Achilles tendon quality
A “normal” Achilles tendon (grade 0) was present in 5/30 (17 %) of patients and 16/20 (80 %) of volunteers. Paratendinosis (grade 1) was identified in 4/30 (13 %) of patients and 4/20 (20 %) of volunteers. Tendinosis (grade 2) , partial tear (grade 3) and complete tear (grade 4) were identi-fied in 10/30 (33 %), 7/30 (23 %) and 4/30 (13 %) of patients, respectively, but in none of the volunteers.
Fig. 3 Correlation of fat-fractions derived from 2-point Dixon gradient-echo MRI (FFDIXON) with known muscle fat content (MFC) of the
phantoms (a) and MFC of the in vivo study (b) derived from MRS (FFMRS). Data are displayed as scatterplots with linear regression lines
(bold line) and corresponding reference lines (dotted line). FFDIXON
showed excellent and good correlation with titrated MFC of the ex vivo study from 0 to 100 % (pc, 0.997; 95 % CI, 0.993–0.999) and from 0 to
30 % MFC (pc, 0.971; 95 % CI, 0.918–0.990; p<0.001) respectively, as
well as with the FFMRS(pc, 0.951; 95 % CI, 0.927–0.973; p<0.001) of the
in vivo study. Linear regression analysis revealed a slope of (a) 0.95 (black line; MFC 100 %) and 0.84 (black semi-dotted line; MFC 0-30 %) in the ex vivo study and (b) 0.85 (black line; MFC 1.1-22.6 %) in the in vivo study respectively
Table 2 Mean fat fractions as derived from MRS (FFMRS) and Dixon-based MRI (FFDIXON) in comparison with mean values of visual grading and
transverse relaxation rate (R2) of fat derived from MRS
Gastrocnemius muscle Tibialis anterior muscle
Patients Volunteers p value Patients Volunteers p value
FFMRS 7.9±5.2 4.9±2.9 0.002 3.9±1.2 3.1±1.3 >0.05
FFDIXON 7.0±4.7 5.0±2.3 0.002 3.6±0.7 3.6±0.5 >0.05
Visual gradea 0.9±0.8 0.6±0.5 >0.05 0.6±0.9 0.3±0.5 >0.05
R2 (fat) 27.3±4.3 31.7±2.7 <0.001 32.3±3.0 34.5±1.3 0.014
Mean values are displayed as averages with corresponding standard deviations
a
Distribution of MFC in respect to Achilles tendon quality is displayed in Fig.5. Student’s t-test revealed a significantly higher FFMRSand FFDIXONin study subjects with (> grade 1)
than without (≤ grade 1) structural damage of the Achilles tendon (p=0.01), whereas no significant difference was seen between study subjects with paratendinosis (grade 1) and normal (grade 0) Achilles tendon (p>0.05).
Fatty muscle degeneration
Subtle fatty degeneration (Goutallier grade 1) of the gastrocnemius/tibialis anterior muscle was detected in 15/30
(50 %) / 10/30 (33 %) of patients and 12/20 (60 %) / 6/20 (30 %) of volunteers respectively. Goutallier grade 2 was identified in 5/30 (17 %) / 3/30 (10 %) of patients, whereas Goutallier grade 3 was identified in 1/30 (3 %) and 0/30 (0 %) patients. None of the volunteers showed > grade 1 and none of the patients showed grade 4 fatty degeneration of muscle tissue. In total 9/30 (30 %) / 17/30 (57 %) of patients and 8/20 (40 %) / 14/20 (70 %) of volunteers showed no signs of fatty degeneration. The Mann-Whitney U test showed no significant differences of visual grading between patients and volunteers (p>0.05). FFMRS and FFDIXONwere significantly
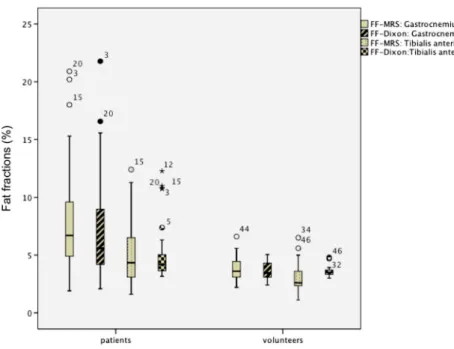
different between Goutallier grades 0, 1 and 2 respectively (all, Fig. 4 Muscle fat content (MFC)
as determined by 2-point Dixon gradient-echo MRI (FFDIXON)
and MRS (FFMRS). FFDIXONand
FFMRSof the gastrocnemius
muscle were significantly higher in (0) patients compared with (1) volunteers (p=0.002 / p=0.001), whereas no difference was identified for FFDIXONand FFMRS
of the tibialis anterior muscle between both groups (both, p>0.05). Data are displayed as box-and-whisker plots. Boundary of boxes closest to zero 25th percentile, line within box median, boundary of boxes farthest from zero 75th percentile; error bars smallest and largest values within 1.5 box lengths of 25th and 75th percentiles
Fig. 5 Distribution of muscle fat content as determined by 2-point Dixon gradient-echo MRI (FFDIXON) along the y-axis in respect to Achilles
tendon quality (grade 0-4) along the x-axis. FFDIXONof the gastrocnemius
muscle (a) was significantly higher in study subjects with (> grade 1) compared to without (≤ grade 1) structural damage of the Achilles tendon (p=0.01), whereas no significant differences were seen for FFDIXONof
the tibialis anterior muscle (b) between same groups (p>0.05). Data are displayed as box-and-whisker plots. Boundary of boxes closest to zero 25th percentile, line within box median, boundary of boxes farthest from zero 75th percentile; error bars smallest and largest values within 1.5 box lengths of 25th and 75th percentiles
p<0.05). Distribution of MFC in respect to visual grading of fatty degeneration is displayed in Table3and Fig.6.
Discussion
Our results show that 2pt-MRIDIXONallows accurate
quanti-fication of MFC in a phantom study, as well as in patients and healthy volunteers.
Fat fractions derived from 2pt-MRIDIXON(FFDIXON) and
MRS (FFMRS) were significantly higher in the gastrocnemius
muscle of patients with achillodynia compared with healthy volunteers. In contrast, visual assessment of fatty degeneration showed no significant difference between both groups. MFC was also significantly higher in study subjects with structural
damage of the Achilles tendon (> grade 1), compared with study subjects with an intact tendon.
Several studies have suggested that assessment of MFC may serve as a biomarker for detection of muscular insuffi-ciency and prediction of post-surgical outcome in degenera-tive musculoskeletal disease [2,7,9,10,16,18].
Recently, 2pt-MRIDIXONwith water/fat separation has been
proposed for fat quantification in patients with lower back pain [2], as well as in neuromuscular and metabolic disease [14,19–21]. Advantages over MRS include a fast and volu-metric data acquisition with both visualisation of anatomical structures and quantification of MFC in an ROI [22]. Howev-er, 2pt-MRIDIXONshows measurement bias, e.g. T2* and T1
bias [23], which may degrade accuracy of fat quantification. We therefore evaluated the accuracy of a 2pt-MRIDIXON
prod-uct sequence for quantification of MFC both in a controlled ex vivo setting and in patients and volunteers. Comparable to previous studies, the muscle/fat phantom provided a standard curve to validate the ex vivo measurements [23], whereas MRS served as the standard of reference for in vivo measure-ments of the MFC [24].
Our ex vivo results show that FFDIXONcorrelated linearly
and highly with the actual fat content in the phantom in a range from 0 to 100 % MFC (Fig.3), which is consistent with previous studies evaluating 2pt-MRIDIXON using fat/water
phantoms [25, 26]. However, comparable to another study using fat/liver phantoms there was an overestimation of very small fat contents (0-4 %), which might be caused by the magnitude calculation of water-/fat-only images (noise bias) [3] affecting fat estimates according to the previously de-scribed algorithm (Eq. 1). Accordingly the correlation be-tween FFDIXONand the titrated fat content was worse within
a clinical range of MCF from 0 to 30 % (slope, 0.84). Our in vivo results show that FFDIXONclosely and
signif-icantly matched FFMRS, which is consistent with results from
a recent study comparing different Dixon-based fat quantifi-cation methods using MRS as the standard of reference (Table2). In contrast to the latter study, T1 bias of the 2pt-DixonGREsequence was additionally addressed in our study
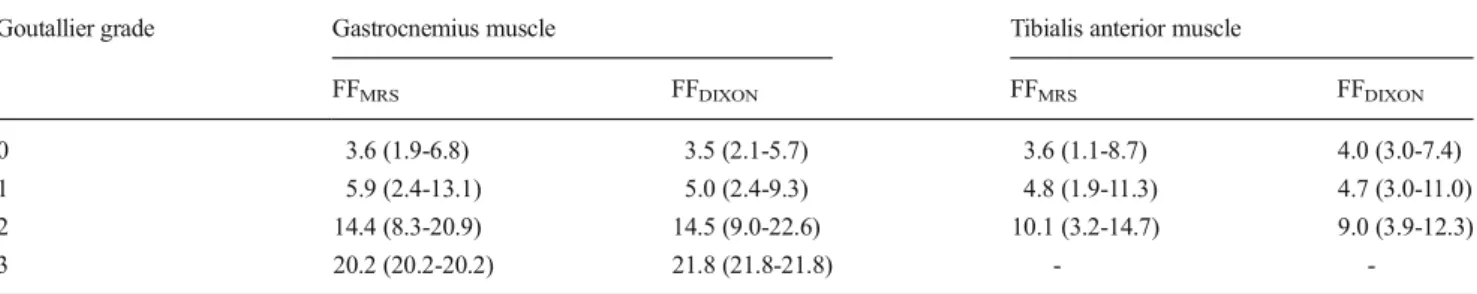
by lowering the flip-angle to 5° (proton-density weighting), Table 3 Mean fat fractions as derived from MRS (FFMRS) and Dixon-based MRI (FFDIXON) in regards to Goutallier grades derived from visual grading
of muscle fat content
Goutallier grade Gastrocnemius muscle Tibialis anterior muscle
FFMRS FFDIXON FFMRS FFDIXON
0 3.6 (1.9-6.8) 3.5 (2.1-5.7) 3.6 (1.1-8.7) 4.0 (3.0-7.4)
1 5.9 (2.4-13.1) 5.0 (2.4-9.3) 4.8 (1.9-11.3) 4.7 (3.0-11.0)
2 14.4 (8.3-20.9) 14.5 (9.0-22.6) 10.1 (3.2-14.7) 9.0 (3.9-12.3)
3 20.2 (20.2-20.2) 21.8 (21.8-21.8) -
-Values are displayed as averages with corresponding minimum to maximum
Fig. 6 Distribution of muscle fat content (MFC) as determined by 2-point Dixon gradient-echo MRI (FFDIXON) and MRS (FFMRS) along the
y-axis in respect to visual grading of fatty degeneration according to Goutallier (grade 0-4) along the x-axis. None of the study subjects showed grade 4 fatty degeneration of muscle tissue. Data are displayed as box-and-whisker plots. Boundary of boxes closest to zero 25th percen-tile, line within box median, boundary of boxes farthest from zero 75th percentile; error bars smallest and largest values within 1.5 box lengths of 25th and 75th percentiles
resulting in a significant reduction of the mean measurement bias from +1.6 % to +0.4 % [27]. However, our in vivo results show—similar to the ex vivo study—a measurement bias of 2pt-MRIDixonfor very small and high FFDIXON, probably due
to noise bias [3] and single-peak modelling of fat [28,29] respectively, resulting in a slope of 0.85 using linear regres-sion analysis. Interestingly, MRS revealed a small inter-individual range of T2 values in our study, which might explain the little importance of a T2* correction in estimations of MFC (FFDIXONare not corrected for T2*-bias), e.g.
com-pared with liver-fat content. Moreover, noise bias of in vivo FFDIXON was less prominent compared with the phantom
study, which might be explained by signal contribution to in vivo fat-only images from surrounding subcutaneous and intramuscular fat.
The range of fat fractions described in the literature is highly variable, depending among others on factors like fat quantification technique, muscle type and disease. We dem-onstrate a range of MFC from 2.1 % to 21.8 % and from 3.0 % to 11.0 % for the gastrocnemius and tibialis anterior muscle respectively (Fig.4), which is consistent with other studies using two-/multi-point Dixon techniques for quantification of MFC [2,14,19–21,30]. Moreover, mean MFC values of our study were highly matching MFC values of a recent study evaluating MFC of calf muscles in respect to visual grading of fatty degeneration according to Goutallier (Fig.6).
Our results show that FFDIXON and FFMRS were
signifi-cantly higher in the gastrocnemius muscle of patients with achillodynia compared with healthy volunteers (Fig. 4). In contrast, visual assessment showed no significant difference between both groups, which is consistent with another study comparing quantitative with visual assessment of MFC in patients with lower back pain [31]. In our study, most study subjects showed no or only a subtle fatty muscle infiltration and significant overlap of quantitative MFC estimates was identified between Goutallier grade 0 and grade 1. Consistent with a recent study [19], inter-observer agreement of visual assessment of fatty degeneration was good for all calf mus-cles. Our results show that agreement depends on MFC and were lower in the tibialis anterior muscle (mean MFC, 3.6± 0.6) compared with the gastrocnemius muscle (mean MFC, 6.0±3.5). This indicates that visual assessment hampers tection of subtle fatty muscle infiltration, whereas MFC de-rived from 2pt-MRIDIXONmight serve as a biomarker for early
stages of muscle disease.
In our study (Fig.5), MFC was significantly higher in study subjects with structural damage of the Achilles tendon (grade >1), compared with study subjects with intact Achilles tendon (grade≤1), which is consistent to a previously men-tioned study performing a qualitative assessment of MFC and Achilles tendon quality [7]. However, we expand the results of the latter study by demonstrating a poor correlation between age and both the condition of the Achilles tendon and fatty
muscle degeneration. Moreover, compared with the gastroc-nemius muscle, no differences were identified between pa-tients and healthy volunteers regarding MFC estimates of the tibialis anterior muscle, indicating that tendon integrity is an important factor of fatty muscle degeneration, more important than age.
Several limitations of our study have to be addressed. We performed Dixon-based fat quantification using a proton-weighted two-point Dixon sequence but not a recently intro-duced multi-point Dixon MRI sequence with correction of chemical-shift inherited measurement bias, including T2* de-cay, multi-peak fat spectrum modelling and eddy currents [6]. However, we could not find those 2pt-MRIDixonrelated errors
to significantly derogate the MFC estimates in both the ex vivo and in vivo analysis, which is consistent with a previous in vivo study evaluating both two-point and multi-point Dixon MRI for quantification of MFC [2]. On the other hand, the study cohort demonstrates only a small range of MFC (5.2 %±3.5 %) and the MRS technique used in this study did not consider an unsaturated lipids peak >3.6 ppm, resulting in an underestimation of MRS based fat fractions similar to FFDIXON. The use of multi-point Dixon sequences
addressing these confounding factors might therefore further increase the accuracy for muscle fat quantification once inte-grated into clinical routine. Moreover, the patient cohort has a wide age range. Whereas the control group (healthy volun-teers) was matched according to sex, we were not able to accurately match the age of both groups. However, correlation of MFC with gender and age of study subjects revealed no significant or only a poor correlation indicating that the dif-ference in age of both groups are of minor concern for the accuracy of our findings.
In summary, 2pt-MRIDIXONallows for accurate
quantifica-tion of MFC, outperforming visual assessment of calf muscle fat. Structural damage of the Achilles tendon is associated with a significantly higher MFC.
Acknowledgements The scientific guarantor of this publication is Pro-fessor Christian W. A. Pfirrmann. The authors of this manuscript declare no relationships with any companies, whose products or services may be related to the subject matter of the article. The authors state that this work has not received any funding. One of the authors has significant statistical expertise. No complex statistical methods were necessary for this paper. Institutional Review Board approval was obtained. Written informed consent was obtained from all subjects (patients) in this study. None of the study subjects or cohorts have been previously reported. Methodolo-gy: prospective, case-control study, performed at one institution.
References
1. Theodorou DJ, Theodorou SJ, Kakitsubata Y (2012) Skeletal muscle disease: patterns of MRI appearances. Br J Radiol 85:e1298–e1308 2. Fischer MA, Nanz D, Shimakawa A et al (2013) Quantification of
MR imaging with single-voxel MR spectroscopy. Radiology 266: 555–563
3. Ma J (2008) Dixon techniques for water and fat imaging. J Magn Reson Imaging 28:543–558
4. Fischer MA, Nanz D, Reiner CS et al (2010) Diagnostic performance and accuracy of 3-D spoiled gradient-dual-echo MRI with water- and fat-signal separation in liver-fat quantification: comparison to liver biopsy. Investig Radiol 45:465–470
5. Schweitzer ME, Karasick D (2000) MR imaging of disorders of the Achilles tendon. AJR Am J Roentgenol 175:613–625
6. Sharma P, Maffulli N (2005) Tendon injury and tendinopathy: healing and repair. J Bone Joint Surg Am 87:187–202
7. Hoffmann A, Mamisch N, Buck FM et al (2011) Oedema and fatty degeneration of the soleus and gastrocnemius muscles on MR images in patients with Achilles tendon abnormalities. Eur Radiol 21:1996– 2003
8. Munteanu SE, Barton CJ (2011) Lower limb biomechanics during running in individuals with achilles tendinopathy: a systematic re-view. J Foot Ankle Res 4:15
9. Bartolozzi A, Andreychik D, Ahmad S (1994) Determinants of outcome in the treatment of rotator cuff disease. Clin Orthop Relat Res 308:90–97
10. Gerber C, Schneeberger AG, Hoppeler H et al (2007) Correlation of atrophy and fatty infiltration on strength and integrity of rotator cuff repairs: a study in thirteen patients. J Shoulder Elbow Surg 16:691– 696
11. Raptis DA, Fischer MA, Graf R et al (2012) MRI: the new reference standard in quantifying hepatic steatosis? Gut 61:117–127
12. Dickson LC, Costain R, McKenzie D et al (2009) Quantitative screening of stilbenes and zeranol and its related residues and natural precursors in veal liver by gas chromatography-mass spectrometry. J Agric Food Chem 57:6536–6542
13. Dixon WT (1984) Simple proton spectroscopic imaging. Radiology 153:189–194
14. Fischmann A, Kaspar S, Reinhardt J et al (2012) Exercise might bias skeletal-muscle fat fraction calculation from Dixon images. Neuromuscul Disord 22:S107–S110
15. Pineda N, Sharma P, Xu Q et al (2009) Measurement of hepatic lipid: high-speed T2-corrected multiecho acquisition at 1H MR spectros-copy—a rapid and accurate technique. Radiology 252:568–576 16. Goutallier D, Postel JM, Bernageau J et al (1994) Fatty muscle
degeneration in cuff ruptures. Pre- and postoperative evaluation by CT scan. Clin Orthop Relat Res 304:78–83
17. Lin L, Torbeck LD (1998) Coefficient of accuracy and concordance correlation coefficient: new statistics for methods comparison. PDA J Pharm Sci Technol 52:55–59
18. Gladstone JN, Bishop JY, Lo IK et al (2007) Fatty infiltration and atrophy of the rotator cuff do not improve after rotator cuff repair and correlate with poor functional outcome. Am J Sports Med 35:719–728 19. Alizai H, Nardo L, Karampinos DC et al (2012) Comparison of clinical semi-quantitative assessment of muscle fat infiltration with quantitative assessment using chemical shift-based water/fat separa-tion in MR studies of the calf of post-menopausal women. Eur Radiol 22:1592–1600
20. Fischmann A, Hafner P, Gloor M et al (2012) Quantitative MRI and loss of free ambulation in Duchenne muscular dystrophy. J Neurol 260:969–974
21. Karampinos DC, Baum T, Nardo L et al (2012) Characterization of the regional distribution of skeletal muscle adipose tissue in type 2 diabetes using chemical shift-based water/fat separation. J Magn Reson Imaging 35:899–907
22. Rofsky NM, Lee VS, Laub G et al (1999) Abdominal MR imaging with a volumetric interpolated breath-hold examination. Radiology 212:876–884
23. Cassidy FH, Yokoo T, Aganovic L et al (2009) Fatty liver disease: MR imaging techniques for the detection and quantification of liver steatosis. Radiographics 29:231–260
24. Reeder SB, Robson PM, Yu H et al (2009) Quantification of hepatic steatosis with MRI: the effects of accurate fat spectral modeling. J Magn Reson Imaging 29:1332–1339
25. Kovanlikaya A, Guclu C, Desai C et al (2005) Fat quantification using three-point dixon technique: in vitro validation. Acad Radiol 12:636–639
26. Bernard CP, Liney GP, Manton DJ et al (2008) Comparison of fat quantification methods: a phantom study at 3.0T. J Magn Reson Imaging 27:192–197
27. Karampinos DC, Yu H, Shimakawa A et al (2011) T-corrected fat quantification using chemical shift-based water/fat separation: appli-cation to skeletal muscle. Magn Reson Med 66:1312–1326 28. Yu H, Shimakawa A, McKenzie CA et al (2008) Multiecho water-fat
separation and simultaneous R2* estimation with multifrequency fat spectrum modeling. Magn Reson Med 60:1122–1134
29. Bydder M, Yokoo T, Hamilton G et al (2008) Relaxation effects in the quantification of fat using gradient echo imaging. Magn Reson Imaging 26:347–359
30. Gloor M, Fasler S, Fischmann A et al (2011) Quantification of fat infiltration in oculopharyngeal muscular dystrophy: comparison of three MR imaging methods. J Magn Reson Imaging 33:203–210 31. Mengiardi B, Schmid MR, Boos N et al (2006) Fat content of lumbar
paraspinal muscles in patients with chronic low back pain and in asymptomatic volunteers: quantification with MR spectroscopy. Radiology 240:786–792