HAL Id: hal-02130692
https://hal.archives-ouvertes.fr/hal-02130692
Submitted on 24 May 2019
HAL is a multi-disciplinary open access
archive for the deposit and dissemination of
sci-entific research documents, whether they are
pub-lished or not. The documents may come from
teaching and research institutions in France or
abroad, or from public or private research centers.
L’archive ouverte pluridisciplinaire HAL, est
destinée au dépôt et à la diffusion de documents
scientifiques de niveau recherche, publiés ou non,
émanant des établissements d’enseignement et de
recherche français ou étrangers, des laboratoires
publics ou privés.
Clutter and Map Legibility in Automated Cartography:
A Research Agenda
Guillaume Touya, Charlotte Hoarau, Sidonie Christophe
To cite this version:
Guillaume Touya, Charlotte Hoarau, Sidonie Christophe. Clutter and Map Legibility in Automated
Cartography: A Research Agenda. Cartographica, University of Toronto Press, 2016, 51 (4),
pp.198-207. �10.3138/cart.51.4.3132�. �hal-02130692�
ARTICLE
Clutter and Map Legibility in Automated Cartography:
A Research Agenda
Guillaume Touya
IGN – COGIT Team / Saint-Mande´ / France
Charlotte Hoarau
IGN – COGIT Team / Saint-Mande´ / France
Sidonie Christophe
IGN – COGIT Team / Saint-Mande´ / France
ABSTRACT
The clutter effect occurs when there is an excessive amount of information in a map or when this information is dis-organized. Measurement of clutter is essential to improve the quality of outputs produced using automated cartographic systems. This paper reviews some existing methods for measuring clutter from different research communities, highlight-ing the lack of suitable methods for use in automated map design. Three use cases are presented to show what kind of clutter measures are needed to go further with the automation of map design, particularly in generalization, in symbol/ style specification, and in heterogeneous data integration and visualization. One measure cannot capture all the aspects of clutter, and combination of clutter measures at each step of the whole map design process should be investigated for automated cartography. A research agenda for clutter assessment regarding some specific cartographic processes is provided.
Keywords: clutter, complexity, legibility, cartography
RE´SUME´
L’effet de clutter intervient lorsqu’une carte comporte une quantite´ excessive d’informations ou, que les informations qu’elle comporte manquent d’organisation. Il est indispensable de savoir mieux mesurer la complexite´ qui en re´sulte, afin de controˆler la qualite´ des cartes produites graˆce a` des processus automatiques. Dans cet article, nous pre´sentons des me´thodes de mesure de cette complexite´ qui sont actuellement utilise´es par diffe´rents chercheurs, et nous montrons qu’elles ne sont pas adapte´es a` la conception automatique de cartes. Nous pre´sentons trois cas d’utilisation pour illustrer le type de mesures requis pour ame´liorer la conception des cartes, particulie`rement en matie`re de ge´ne´ralisation, de spe´cification du style cartographique et d’inte´gration et de visualisation de donne´es disparates. Il en ressort notamment qu’une seule mesure ne peut pas saisir tous les aspects de la complexite´ des cartes, et qu’il faudrait donc envisager d’utiliser la combinaison de diffe´rentes mesures a` chaque e´tape de la conception automatise´e d’une carte. Nous sugge´rons des recherches qui permettraient d’e´tablir des moyens de mesurer la complexite´ lie´e a` certains processus cartographiques.
Mots cle´s : clutter, complexite´, lisibilite´, cartographie
Introduction
Geographical data and maps are now supporting more and more everyday tasks of citizens, and cartographers are aware that the ever-growing amount of information in maps alters their comprehension. Researchers have long been concerned about the complexity of maps and its impact on map legibility (MacEachren 1982; Kno¨pfli 1983). However, it is still difficult to measure the
correla-tion between map complexity and map legibility or map efficiency: for instance, to determine when a map becomes too complex to be efficient for a given task such as finding a point of interest or designing an itinerary.
Our long-term research aims at controlling indicators to evaluate map quality: automated cartographic techniques require metrics to enable auto-evaluations (Stoter and others 2014), and visual complexity requires additional study to
qualify maps as suitable visualizations for users’ purposes or perceptual and cognitive capacities. Map complexity is one of the factors that would help in assessing if a map is legible, effective, and suitable for some uses. In fact, it would be an indicator of map quality to preserve a re-quired level of visual complexity, as well as an indicator of noise or cognitive overload in a map implying the un-usability of such a map. As a consequence, it is interesting to study if existing complexity measures can help us improve automated cartographic processes to fit users’ requirements (preferences, uses, tasks, etc.) well. The map complexity issue has been addressed in several research communities, often with different terms to describe it, and there is a lack of research focused on unifying the pro-posals. For instance, computer vision scientists (Rosenholtz, Li, and Nakano 2007) use ‘‘clutter’’ to describe images with too much information. In addition to that, it is inter-esting to investigate the profusion of clutter measures in computer vision (Moacdieh and Sarter 2015) to identify techniques transposable to mapping complexity assess-ment: to what extent would these methods mostly intended for images be useful for our particular images, maps? What is distinctive in our images that requires adaptation of existing clutter methods? The goal of the research presented in this paper is thus to define a research agenda related to the assessment of existing clutter methods for current issues regarding the quality of some automated cartographic pro-cesses, such as generalization, symbol specification, and heterogeneous data integration and visualization. Map design would benefit from clutter measure methods that have metrics for improving underlying processes or for provision to users manipulating those processes.
To achieve this goal, this paper reviews past proposals for measuring map complexity or clutter and analyzes what is
suitable or lacking to tackle existing automated cartography scenarios that require some kind of complexity measure-ment. The next part of the paper reviews existing defini-tions and methods, comparing them from several carto-graphic perspectives to identify persistent issues regarding map complexity, and clutter in particular, in automated cartographic processes. The third part details how three specific cartographic processes, generalization, symbol speci-fication, and heterogeneous data integration and visualiza-tion, may be better controlled with the help of clutter metrics. Finally, the fourth part details a research agenda on clutter in map design, addressing research leads to be followed.
Existing Methods of Measuring Clutter complexity, entropy, legibility, and clutter
Many researchers have studied the complexity of maps, using different words whose definitions partly overlap: complexity, entropy, clutter, or simply legibility.
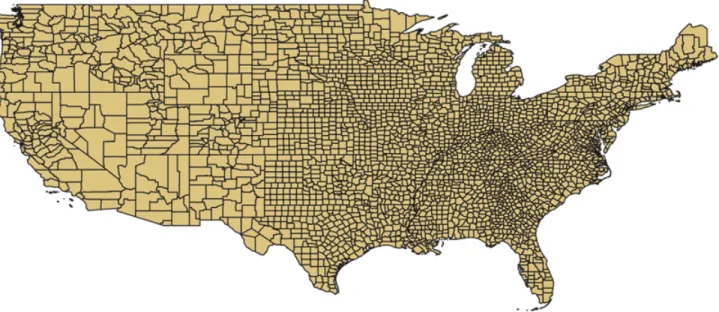
First, map complexity is a term often used in the carto-graphy research community. Most proposed definitions for map complexity agree with the distinction between visual or graphical complexity and intellectual complexity (MacEachren 1982; Fairbairn 2006; Je´gou and Deblonde 2012; Ciolkosz-Styk and Styk 2013), even if both are still ill-defined (Figure 1). Graphical complexity relates to the way all map objects are visually perceived by the user, while intellectual complexity relates to the cognitive pro-cess of understanding the map (Fairbairn 2006). Fairbairn (2006) explains that intellectual complexity has been less studied in cartography because it is closely related to the user of the map and the task performed with the map. Figure 1. This map of US county boundaries has a high visual complexity but a low intellectual complexity
Source: US TIGER data
Clutter and Map Legibility in Automated Cartography: A Research Agenda
Je´gou and Deblonde (2012) introduce a third level of complexity, namely semiological complexity, interfacing with both graphical and intellectual complexity. The three levels are related to cognitive functions: graphical com-plexity is related to pre-attentive visual perception of shapes, textures, and colours; semiological complexity is related to attentive and conscious perception of the graphical signs; and cognitive complexity is related to the understanding of the spatial structures of the geographical space. One way to combine visual and intellectual complexity is to measure the entropy of the map (Kno¨pfli 1983; Bjørke 1996, 2012; Li and Huang 2002). The entropy refers to Shannon and Weaver’s (1949) theory of communication and characterizes the uncertainty of a source of informa-tion, that is, the map: the more a map conveys different information, the greater the entropy. In other words, entropy indicates the quantity and organization of informa-tion required to convey informainforma-tion without ambiguity. In the computer vision research community, the concept of clutter refers to an excessive amount of information in an image and/or to disorganization of the information (Rosenholtz and others 2005; Rosenholtz, Li, and Nakano 2007). According to Rosenholtz, entropy is related to clutter, as when entropy is low, more information can be interpreted by the human brain. In most clutter-related research, clutter is task-oriented (Moacdieh and Sarter 2015), which explains the profusion of measures in this domain: often the measures actually assess clutter for a given visual task, such as visual search.
Some research also focuses on map legibility, or readability (Chesneau 2007; Stigmar and Harrie 2011; Harrie, Mustie`re, and Stigmar 2011; Olsson and others 2011; Touya 2012, among others). This concept is quite close to graphical complexity, as it uses visual perception limits to define rules that map symbols should follow to be legible. In cartography, those rules rely mainly on rules coming from visual perception or from the conceptual framework provided by Bertin (1967) about the use of visual variables and their related properties. A first example is that two similar symbols should be separated by 0.1 mm on the map to be distinguishable. Another example is that the set of graphic signs in the map should be represented with a particular colour palette, such as one with constraints on colour contrasts, to preserve the relationships between the depicted data (association, order, difference) and thus the legibility of the map (Chesneau 2007; Christophe 2012). Among these concepts, we use clutter in this paper because we believe that its definition covers all the others. Using clutter measures should be considered according to the various types of complexity. At this time, it is difficult to discriminate the influences of those levels of complexity in clutter. Studies have to be conducted first to determine thresholds of clutter in various contexts (data, processes, devices, etc.), second to discriminate which type of com-plexity is involved in clutter, and third to control how
clutter is perceived, influences cartographic task perform-ances, causes crowding effects and occlusions, can impair visual search performance, or finally even stretches the limits of short-term memory (Miller 1956).
main characteristics of existing clutter measure methods
The main characteristics of existing clutter measures are that they mainly come from image processing (i.e., clutter is measured mainly on images, not on vector data) and that their scope may be global, that is, the whole image is assessed, or local, that is, clutter is interpolated all over the image to identify more or less cluttered areas.
Most clutter measure methods come from image process-ing (see Ciolkosz-Styk and Styk 2013 or Moacdieh and Sarter 2015 for the detailed state of the art) and are mostly based on edge detection or compression methods (Da Silva, Courboulay, and Estraillier 2011). Fairbairn (2006) reviews various compression methods for varying param-eterization to find relations between quantity of informa-tion and complexity in the context of map design. Those methods raise two issues. First, they are very sensitive to image resolution, in other words, image size and pixel density, whereas resolution does not influence the percep-tion of complexity (Je´gou and Deblonde 2012). Image compression methods imply artifacts in clutter computa-tion and thus visualizacomputa-tion and interpretacomputa-tion of causes of clutter. Few vector methods exist (e.g., MacEachren 1982; Bjørke 1996; Olsson and others 2011), but they would be useful to handle occlusions and overlaps between vector data.
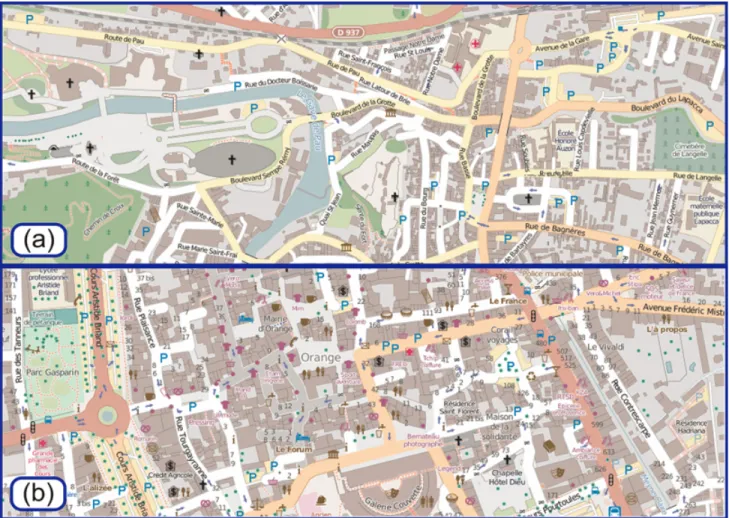
Global measures are the most frequent in the literature. For instance, entropy-based measures (Bjørke 1996, 2012; Li and Huang 2002) evaluate the global disorder in the information conveyed by the map. Bjørke (1996) evaluates so-called topological entropy by analyzing regularities in the neighbourhoods of the map symbols. Topological entropy is low when similar symbols are close to each other and high when all symbols are randomly located all across the map (Bjørke 1996). For instance, in Figure 2a, the symbols are grouped by category (e.g., religious symbols are in the same location of the map), while all symbols are randomly distributed in Figure 2b. In this case, topo-logical entropy is due to geography rather than to any cartographic process.
Local measures were also proposed in the literature. For instance, Je´gou and Deblonde (2012) use a quad-tree struc-ture based on colour changes in the image, which is denser in the cluttered areas of the maps. The feature congestion measure from Rosenholtz, Li, and Nakano (2007) uses the desktop metaphor to assess clutter: a desktop is clean and organized if a new item can be added saliently to the desk. The feature congestion measure analyzes local saliency (Itti, Koch, and Niebur 1998) according to three criteria
Guillaume Touya et al.
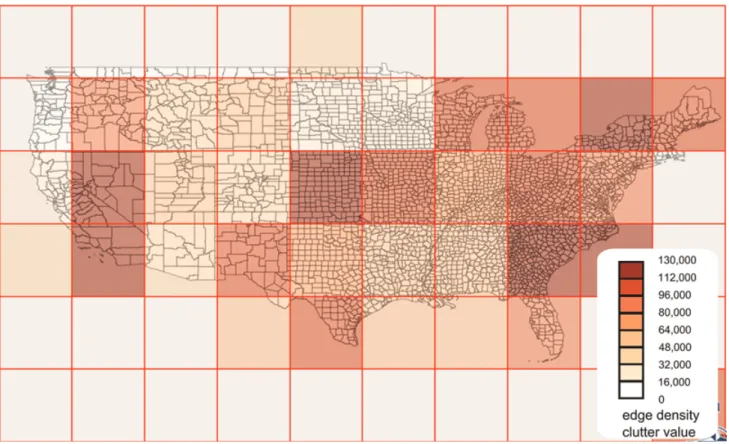
(luminance, contrast, and orientation) and combines across neighbourhood scales and criteria to assess local clutter. Both types of measures can be useful, depending on the need for evaluation of clutter. Local measures identify the parts of the map that are cluttered and the parts that are not cluttered. On the other hand, global measures give a broad value of map legibility. The problem is still the determination of thresholds according to map purposes. When a global measure is required, local measures can be aggregated. Rosenholtz, Li, and Nakano (2007) aggregate the feature congestion measure across the image. Je´gou and Deblonde (2012) propose simple methods to locally visualize a global measure, partitioning the map and mea-suring clutter in each portion, or using a sliding window that measures clutter in an area plus its neighbourhood. Figure 3 shows how we partitioned US county boundaries to visualize the local ‘‘number of edges’’ measure proposed by Rosenholtz, Li, and Nakano (2007). But this is not a perfect solution, as the measure is very sensitive to the size of the window.
persistent legibility issues in cartography
We do have some legibility criteria and methods in cartog-raphy, but sometimes they are very specific to a particular process (generalization or symbol specification, for in-stance), to data (image or vector), or to spatial structures of related geographic spaces. We face the problem of methods that often apply only to the global map or a related global image of the map, and not to local parts of the map. The resulting information on global legibility of the map is difficult to interpret. The origin(s) of a low legibility value for a whole map may come from various factors difficult to disambiguate. Therefore, it remains difficult to automate global clutter measure methods for decision making and to apply a suitable process to manage and improve legibility. As a result, it is difficult to help users of automated cartographic systems make the same decisions. To improve automatic cartographic processes, local clutter measures would be useful to manage the local clutter of information to
Figure 2. (a) Low topological entropy for POI symbols (e.g., religious buildings are close to each other); (b) high topological entropy as POI symbols are distributed all across the map
Source: @OpenStreetMap
Clutter and Map Legibility in Automated Cartography: A Research Agenda
f identify dense areas, to better generalize areas or some
themes or to modify/optimize symbol specification and contrasts;
f identify less dense areas, to move topographic
infor-mation into these areas (e.g., toponyms) or to add external information.
Clutter measures may be very useful in automated systems for identifying dense and less dense areas to improve the selection of a process and the geographical area we aim to manage. Clutter measures would be more efficient if we could apply them not only to the image of the map, but also between an image and vector data, between vector data, between background and foreground regardless of the data type, and between text and other data (Raposo and Brewer 2013, 2014). Finally, we need to manage the following constraints related to the issue of graphically representing a geographical space: to preserve the initial amount of information at a global level, to preserve spatial structures, and to control the level of detail.
Use Cases in Automated Cartography
In this section, three use cases of automated cartography are presented, with their specific needs for clutter mea-surement. The issues are illustrated by a common basic clutter measure from Rosenholtz, Li, and Nakano (2007): edge density. This measure is a raster global measure that
counts the edges in an image, that is, the pixel couples with sharp changes of brightness. Rosenholtz, Li, and Nakano (2007) state that edge density is a simple but fair proxy for image clutter.
clutter and map generalization
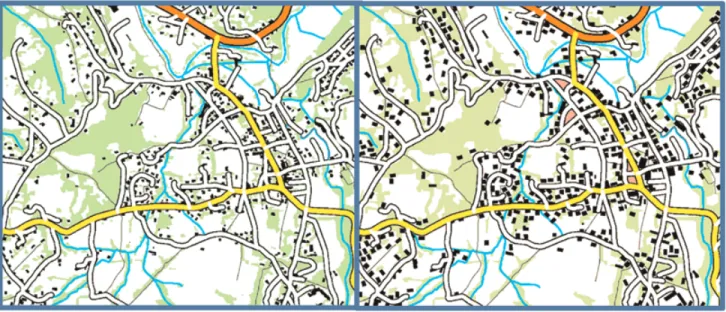
Automated map generalization processes often rely on a map legibility evaluation to optimize the generalized output (Bard 2004). Generalized map evaluation techniques use a large number of local and targeted measures (e.g., to check if each building is big enough to be legible) to infer the global legibility of the map (Stigmar and Harrie 2011; Touya 2012). Stigmar and Harrie (2011) state that mea-suring clutter should help identify excessively dense areas, but also help check that the amount of information in the map has been preserved by generalization. Applying the edge density measure to the generalized maps from Touya (2012) shows that generalization always increases clutter. The clutter is mainly due to the enlargement of buildings to make them legible (Figure 4), which leaves fewer ‘‘white’’ or ‘‘green’’ pixels in the image. Generalization clearly re-quires a local measure of clutter to identify locations where it failed to simplify the map, but also requires a better measure of the occlusions and overlaps that the process is trying to avoid, rather than a measure of the reduction of total white spaces.
Figure 3. Visualization of local clutter using a grid partition on the map of US county boundaries Source: US TIGER data
Guillaume Touya et al.
clutter for heterogeneous data integration and visualization
We face a quantity of various heterogeneous geographic data that users can now integrate for spatial analysis or visualization. The heterogeneity of those data in terms of data types (imagery, vector, maps, 3D models, etc.), initial data schemas for vector data, levels of detail, amount of information, and global visual properties (colour contrasts and frequencies, textures, etc.) requires specific prepro-cessing methods for integration and visualization. Two main purposes are considered: mapping volunteered geographic information (VGI) and accomplishing hybrid visualization with orthoimagery and vector data.
VGI Map Design
Mapping volunteered geographic information (VGI) can be complex because data compiled by different users are often very heterogeneous in terms of level of detail (Touya and Reimer 2015), quantity of information, and symbol specification. Knowing the level of detail of map features is necessary to infer at which scale the object can be de-picted. Touya and Brando (2013) assume that measuring clutter would help to assess the level of detail of VGI when geometry or semantics was not informative enough. For instance, Figure 5 shows OpenStreetMap paths in a mountain area, with symbol sizes corresponding to 1:20k scale and 1:50k scale. Geometry and semantics used in the scale inference method tell us that the paths are adapted to 1:50k scale, but the right part of the figure shows that the paths clutter at this scale because of a high local density and the use of symbols not suitable for that scale. The edge density measure previously used finds that the 1:50k image is twice as cluttered as that at the 1:20k scale. The measured difference should be bigger, but the other map themes are not cluttered. Here, a good clutter measure should be local and able to disregard the other map themes.
Hybrid Visualizations Based on Orthoimagery and Vector Data
Integrating and combining heterogeneous geographical data such as orthoimagery and vector data as a kind of hybrid visualization leads to illegibility problems: the quan-tity and overlap of data and the number of graphic signs make the visualization difficult to read. Hoarau and others Figure 4. Un-generalized (left) and generalized (right) 1:50k topographic map (429 and 1459 measured values for edge density
Source: IGN
Figure 5. The paths on the left are geometrically adapted to 1:50k scale but the density of paths makes them more adapted to larger scales such as 1:20k
Clutter and Map Legibility in Automated Cartography: A Research Agenda
(2- 01-3) and H- oa-rau and Ch- ris- to-phe (2- 01-5)
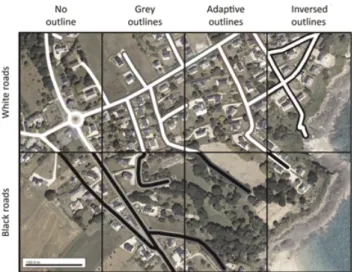
propose a geovisualization system to manage a continuum between an orthoimage and a topographic map, to mix them homogeneously based on colour and texture inter-polations and on local colour adaptation. Their purpose is to attain better legibility of the hybrid visualization, such as better visual integration of various data, in partic-ular road networks, to render a homogeneous visualiza-tion. Figure 6 presents various types of outlines for roads, including none, grey, adaptive, and inverse, for white and black road fillings. The ‘‘no outline’’ option for black roads (bottom left) and inverse outlines for white roads (top right) are generally used with orthoimagery back-grounds, but are much too salient and not homogeneous with the background. The ‘‘no outline’’ option for white roads (top left) is the favourite solution for several exist-ing geoportals, but is not legible, especially for the repre-sented traffic circle, and when surrounding colours are light. The grey outlines are an attempt to better manage the visual effects of high or low colour contrast. The pro-posal ‘‘adaptive colors’’ for white roads is to adapt the col-our of the outlines all along the roads according to the dominant colour of the background image in managing complementary colours: a better homogeneous rendering of the roads is automatically determined in locally adapt-ing the colour contrast (Hoarau, Christophe, and Mustie`re, 2013).
A local clutter measure would be useful in such a context for two reasons:
f The clutter measure applied to the orthoimage before
any visual hybridization with other data may lead to the detection of highly cluttered areas, in fact very heterogeneous areas, in the image, such as wooded areas. A specific process could be applied there to lower the clutter effect by processing the wooded area in the image (generalization, for instance) or to preserve the clutter effect coming from a particular
texture in the image that conveys some photorealism, for instance. Another type of local process would be to enrich the proposed local colour adaptation method, for these specific areas, by considering not only the dominant colour of the background but also the level of clutter, related structure, or texture in the image, to better control the selection of adap-tive colours for roads.
f The clutter measure applied to the final hybrid
visual-ization would be a relevant indicator to assess the local colour adaptation method. Managing it as an indicator would be useful for assessing the local and global legibility of the hybrid visualization.
We observe that edge density measures are too sensitive to the structure and texture in the background image, mainly to the heterogeneity of wooded areas and to the black colours used by the road styles. In this context, these methods are unusable at present to detect the areas to manage particularly in the image and/or to assess the adaptive method.
clutter in topographic styles design
Formalizing, designing, and interpolating topographic styles to enhance photorealism, level of detail, or artistic stylization (Christophe 2012; Hoarau, Christophe, and Mustie`re 2013; Hoarau and Christophe 2015; Ory and others 2015, among others) rely on cartographic constraints to preserve data legibility, relations, and spatial structures. In the context of personalized map design, as in the context of tradi-tional map series production, providing and applying styles to existing maps tends to add visual information by adding unusual graphical signs or visual effects, and runs the risk of making the cartographic message confusing. Therefore, stylization implies visual, semiological, and cognitive complexities. Two purposes are considered for style interpolation:
f We would aim at preserving a certain level of visual
complexity between two topographic styles, while considering that their level of visual complexity is related to their quality. For instance, the integration of French and Swiss styles requires management of clutter effects during the process without lowering their initial level of visual complexity (Ory and others 2015).
f We would aim at decreasing clutter effects when
applying some artistic styles, such as watercolour rendering, where map objects are symbolized as if they were painted with watercolour. The visual com-plexity will be lower, because the water-colourization requires a step of simplification, but some cluttered areas may appear due to the dilution effect and imply some overlying/occlusion between objects or some misunderstandings about visual effects of colour dilution and edge darkening.
Figure 6. Adaptive colour contrasts between roads and orthoimagery
Guillaume Touya et al.
Clutter measures could be considered as indicators to guide the symbol/style specification process, to maintain a level of complexity, or to identify areas requiring specific preprocessing.
Local clutter measures could be used to detect areas with a specific level of clutter, according to thresholds to be determined empirically or by user tests. Local clutter measures may be computed on the images of such areas using image processing, but also on some specific data, for example, between two vector data layers or between an image and a vector data layer, by developing vector processing tools, such as the ones proposed in (Harrie and others 2015).
If local clutter is low in some areas, these detected areas could be used to add or displace overlapping information during the combination of maps and images or the styliza-tion of map design. For instance, in classical topographic maps, toponyms are often placed on the sea, because it is represented by an empty clear blue space: but if the sea is expressively rendered by wave textures to make it more realistic or by transparency with orthoimagery to render immersed rocks, toponyms have to be displaced to other areas that are less cluttered.
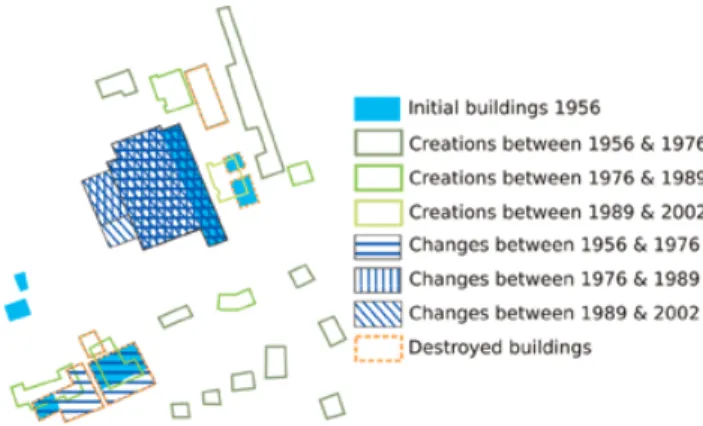
If local clutter is too high, it can be lowered by locally optimizing symbol specification, such as colour contrasts between background and overlaid vectors (Figure 6) or overlaps between objects resulting in occlusions (Figure 7). In this situation, symbol specification may differ in differ-ent areas of the map to improve its global legibility. Figure 7 presents the result of the optimization of graphic sign choices (hatching) to render the historical dynamics of buildings, thus minimizing the overlap of graphic signs. In both examples, to manage background/layers and layer occlusion effects, local clutter measures would allow initial detection of cluttered areas in which we could apply a suitable process, instead of analyzing an entire image or map and all possible contrasts or overlaps.
If we consider that high clutter does not always create a legibility problem and that complexity does not always need to be lower but may need to be preserved, clutter measures can also be used as a quality indicator. Standard topographic maps may be considered as cluttered regard-ing the quantity of information they may contain and convey, which is not something to lower but to preserve. If we try to make some transformations on a topographic map, such as watercolour painting stylization, we face the problem of preserving the amount of information related to the quality of the map. For instance, if a user tries to apply a topographic style, such as French or Swiss style (see Ory, Christophe, and Fabrikant 2013), or an artistic style, such as a watercolour or painter style, to his or her own data, a measure could evaluate if the level of clutter was similar before and after the style application. The hypothesis here is that the level of clutter is representative of the visual and semantic complexity of a topographic style that we want to preserve or an artistic style that we want to achieve.
Research Agenda on Clutter
The use cases presented in the preceding section demon-strate several issues related to clutter measurement for automated map design. These issues can be reformulated into research questions that researchers in cartography need to address.
First, the literature review shows a high prominence of image-based clutter measures, from both the geographical information science and computer vision research com-munities. The use cases show the importance of layer-based legibility evaluation, so is it useful to base legibility evaluation on image-based methods? With the large set of existing clutter measures, presented for instance by Moacdieh and Sarter (2015), identifying the best clutter measure method for a given automatic mapping process is another issue that needs to be addressed. Automated map design processes may contain auto-evaluation mech-anisms, so we also question how to integrate image-based clutter measures into such vector-based systems. The different definitions of clutter and complexity presented in the paper highlight different aspects of clutter and the existing measures cover only part of these aspects. A next step would be to combine several clutter measures to make complex decisions on map legibility. Is this com-bination possible using multiple-criterion decision techni-ques (Figueira, Greco, and Ehrogott 2005)? Moacdieh and Sarter (2015) collected several methods where clutter is related to a given user task, such as clutter on a plane pilot screen. Are there clutter methods adapted to common map use tasks?
To investigate such research questions, several actions can be carried out. First, a sample of the existing clutter measures should be tested on maps extracted from the Figure 7. Optimized overlaps between historical dynamics
of buildings Source: IGN
Clutter and Map Legibility in Automated Cartography: A Research Agenda
use cases presented in this paper, and of course from additional use cases requiring clutter measures. Then, we have to compare the way clutter is measured automati-cally with expert/user experiments involving map-based tasks to check if clutter measures correlate with the diffi-culty experienced by a user for a given task. Stigmar and Harrie (2011) did this to correlate map metrics (number of features, number of layers, etc.) and evaluate map legi-bility. Finally, experiments on combinations of clutter measures using machine learning techniques, such as Support Vector Machine as proposed by Harrie, Stigmar and Djordjevic (2015), or using multiple-criterion decision techniques such as the one used in Touya and Brando (2013), will be useful to determine how clutter measures can best be combined.
Conclusion
To conclude, this paper shows that clutter in maps has been addressed from different points of view, but the question of efficiently measuring it in real maps remains open. Different use cases of automated mapping were pre-sented, where basic clutter measures are unsuccessful in capturing the excessive amount of information or its lack of visual order or legibility. Research questions have been derived from the study of the use cases, for instance, the usability of image-based measures for map legibility or the possibility of combining several clutter measures to assess map legibility or efficiency.
The first step would be to test more of the existing clutter measures on maps from the presented use cases and from other use cases of automated mapping (label placement, for instance). Next, we would relate clutter metrics to effective map legibility. User tests should be carried out, which could help to identify the best clutter measures, or at least the best for a given type of map or a given task. Finally, the combination of several metrics should be investigated, using techniques from machine learning or multiple-criterion decision domains.
Author Information
Guillaume Touya is a senior researcher on the COGIT team, IGN France, the French mapping agency. He holds a PhD in GI science from Paris-Est University. His research interests focus on automated cartography, map general-ization, and volunteered geographic information. E-mail: [email protected].
Charlotte Hoarau is a senior researcher on the COGIT team, IGN France, the French mapping agency. She holds a PhD in GI science from Paris-Est University. Her research interests focus on the geovisualization of heterogeneous geospatial data and on the interactions with such visual-izations. E-mail: [email protected].
Sidonie Christophe is a senior researcher on the COGIT team, IGN France, the French mapping agency. She holds a PhD in GI science from Paris-Est University. Her research interests focus on knowledge modelling and tools im-plementation for geovisualization design and on the evaluation of cartographic rendering quality and usability. E-mail: [email protected].
References
Bard, S. 2004. ‘‘Quality Assessment of Cartographic Generalisation.’’ Transactions in GIS 8(1): 63–81. http:// dx.doi.org/10.1111/j.1467-9671.2004.00168.x.
Bertin, J. 1967. Se´miologie graphique. Paris, France: Mouton, Gauthier-Villars.
Bjørke, J.T. 1996. ‘‘Framework for Entropy-Based Map Evaluation.’’ Cartography and Geographic Information Science 23(2): 78–95. http://dx.doi.org/10.1559/152304096782562136.
Bjørke, J.T. 2012. ‘‘Exploration of Information Theoretic Arguments for the Limited Amount of Information in a Map.’’ Cartography and Geographic Information Science 39(2): 88–97. http://dx.doi.org/10.1559/1523040639288.
Chesneau, E. 2007. ‘‘Improvement of Colour Contrasts in Maps: Application to Risk Maps.’’ In Proceedings of 10th AGILE International Conference on Geographic Information Science, 8–11 May, Aalborg, Denmark.
Christophe, S. 2012. Cartographic Styles between Traditional and Original (Towards a Cartographic Style Model). In Proceedings of AutoCarto Conference 2012, 16–18 September, Columbus, Ohio, USA.
Ciolkosz-Styk, A., and A. Styk. 2013. ‘‘Advanced Image Processing for Maps Graphical Complexity Estimation.’’ In Proceedings of 26th International Cartographic Conference, 25–30 August, Dresden, Germany.
Da Silva, M.P., V. Courboulay, and P. Estraillier. 2011. ‘‘Image Complexity Measure Based on Visual Attention.’’ In Proceedings of 18th IEEE International Conference on Image Processing (ICIP), 11–14 September, Brussels, Belgium, 3281–84. http:// dx.doi.org/10.1109/ICIP.2011.6116371.
Fairbairn, D. 2006. ‘‘Measuring Map Complexity.’’ Cartographic Journal 43(3): 224–38. http://dx.doi.org/10.1179/
000870406X169883.
Figueira, J., S. Greco, and M. Ehrogott, eds. 2005. Multiple Criteria Decision Analysis: State of the Art Surveys. Vol. 78 of International Series in Operations Research & Management Science. Springer.
Harrie, L.E., S. Mustie`re, and H. Stigmar. 2011. ‘‘Cartographic Quality Issues for View Services in Geoportals.’’ Cartographica 46(2): 92–100. http://dx.doi.org/10.3138/carto.46.2.92. Harrie, L., H. Stigmar, and M. Djordjevic. 2015. ‘‘Analytical Estimation of Map Readability.’’ ISPRS International Journal of Geo-Information 4(2): 418–46. http://dx.doi.org/10.3390/ ijgi4020418.
Hoarau, C. and S. Christophe. 2015, October. ‘‘Color and Texture Interpolation between Orthoimagery and Vector Data.’’ In ISPRS Annals of Photogrammetry, Remote Sensing and the Spatial Information Sciences II-3/W5.
Guillaume Touya et al.
Hoarau, C., S. Christophe, and S. Mustie`re. 2013. Mixing, Blending, Merging or Scrambling Topographic Maps and Orthoimagery in Geovisualizations? In Proceedings of 26th International Cartographic Conference, 25–30 August, Dresden, Germany.
Itti, L., C. Koch, and E. Niebur. 1998. ‘‘A Model of Saliency-Based Visual Attention for Rapid Scene Analysis.’’ IEEE Transactions on Pattern Analysis and Machine Intelligence 20(11): 1254–59. http://dx.doi.org/10.1109/34.730558.
Je´gou, L., and J.P. Deblonde. 2012. ‘‘Vers une visualisation de la complexite´ de l’image cartographique.’’ Cybergeo: European Journal of Geography. http://dx.doi.org/10.4000/cybergeo.25271. http://cybergeo.revues.org/25271.
Kno¨pfli, R. 1983. ‘‘Communication Theory and Generalization.’’ In Graphic Communication and Design in Contemporary
Cartography, ed. D.R.F. Taylor, 177–218. New York: Wiley. Li, Z., and P. Huang. 2002. ‘‘Quantitative Measures for Spatial Information of Maps.’’ International Journal of Geographical Information Science 16(7): 699–709. http://dx.doi.org/10.1080/ 13658810210149416.
MacEachren, A.M. 1982. ‘‘Map Complexity: Comparison and Measurement.’’ American Cartographer 9(1): 31–46. http:// dx.doi.org/10.1559/152304082783948286.
Miller, G A. 1956. ‘‘The magical number seven plus or minus two: some limits on our capacity for processing information.’’ Psychological Review 63 (2): 81–97.http://dx.doi.org/10.1037/ h0043158 Medline:13310704
Moacdieh, Nadine, and Nadine Sarter. 2015. ‘‘Display clutter: a review of definitions and measurement techniques.’’ Human Factors: The Journal of the Human Factors and Ergonomics Society 57 (1): 61–100. Medline:25790571
Olsson, P.O., K. Pippig, L.E. Harrie, and H. Stigmar. 2011. ‘‘Identifying Map Regions That Are Difficult to Read.’’ Mapping and Image Science 3:22–29.
Ory, J., S. Christophe, and S. Fabrikant. 2013. Identification of Styles in Topographic Maps. In Poster Proceedings, 26th International Cartographic Conference (ICC 2013), 25–30 August, Dresden, Germany.
Ory, J., S. Christophe, S.I. Fabrikant, and B. Bucher. 2015. How do map readers recognize a topographic mapping style?
Cartographic Journal 52(2): 193–203. http://dx.doi.org/10.1080/ 00087041.2015.1119459.
Raposo, P., and C.A. Brewer. 2013. ‘‘Guidelines for Consistently Readable Topographic Vectors and Labels with Toggling
Backgrounds.’’ In Proceedings of 26th International Cartographic Conference, 25–30 August, Dresden, Germany.
Raposo, P., and C.A. Brewer. 2014. ‘‘Landscape Preference and Map Readability in Design Evaluation of Topographic Maps with an Orthoimage Background.’’ Cartographic Journal 51(1): 25–37. http://dx.doi.org/10.1179/1743277412Y.0000000027.
Rosenholtz, R., Y. Li, J. Mansfield, and Z. Jin. 2005. ‘‘Feature Congestion: A Measure of Display Clutter.’’ In Proceedings of the SIGCHI Conference on Human Factors in Computing Systems, CHI ’05, 2–7 April, New York, NY, USA, 761–70. ACM. http:// dx.doi.org/10.1145/1054972.1055078.
Rosenholtz, Ruth, Yuanzhen Li, and Lisa Nakano. 2007. ‘‘Measuring visual clutter.’’ Journal of Vision 7 (2): 1–22.http:// dx.doi.org/10.1167/7.2.17 Medline:18217832
Shannon, C.E., and W. Weaver. 1949. The Mathematical Theory of Communication. Champaign, IL: University of Illinois Press. Stigmar, H., and L.E. Harrie. 2011. ‘‘Evaluation of Analytical Measures of Map Legibility.’’ Cartographic Journal 48(1): 41–53. http://dx.doi.org/10.1179/1743277410Y.0000000002.
Stoter, J., X. Zhang, H. Stigmar, and L. Harrie. 2014. ‘‘Evaluation in Generalisation.’’ In Abstracting Geographic Information in a Data Rich World, ed. D. Burghardt, C. Ducheˆne, and W. Mackaness, 259–97. Springer International Publishing. http:// dx.doi.org/10.1007/978-3-319-00203-3_9.
Touya, G. 2012. ‘‘Social Welfare to Assess the Global Legibility of a Generalized Map.’’ In Geographic Information Science 7th International Conference, GIScience 2012, ed. N. Xiao, M.-P. Kwan, M.F. Goodchild, and S. Shekhar, 198–211. Berlin: Springer. Touya, G., and C. Brando. 2013. ‘‘Detecting Level-of-Detail Inconsistencies in Volunteered Geographic Information Data Sets.’’ Cartographica 48(2): 134–43. http://dx.doi.org/10.3138/ carto.48.2.1836.
Touya, G., and A. Reimer. 2015. ‘‘Inferring the Scale of
OpenStreetMap Features.’’ In OpenStreetMap in GIScience, ed. J. Jokar Arsanjani, A. Zipf, P. Mooney, and M. Helbich, 81–99. Cham, Switzerland: Springer International Publishing.
Clutter and Map Legibility in Automated Cartography: A Research Agenda