f
MITLibraries
Document Services Room 14-0551 77 Massachusetts Avenue Cambridge, MA 02139 Ph: 617.253.5668 Fax: 617.253.1690 Email: docs@mit.edu http://libraries.mit.edu/docsDISCLAIMER OF QUALITY
Due to the condition of the original material, there are unavoidable
flaws in this reproduction. We have made every effort possible to provide you with the best copy available. If you are dissatisfied with this product and find it unusable, please contact Document Services as soon as possible.
Thank you.
Pages are missing from the original document.
Or
-l5
-
twbev-ee
I
CONSOLIDATION BEHAVIOR OF AN EMBANKMENT ON BOSTON BLUE CLAY
by
JOSEPH FRANCIS WHITTLE, JR. BS, Rensselaer Polytechnic Institute
(1967)
Submitted in partial fulfillment of the requirements for the degree of Master of Science in Civil Engineering
at the
Massachusetts Institute of Technology June, 1974
Signature of Author.
Depa • nt f Civil Engineer4i, May 10, 1974
Certified by... .. ... . ...
Thesis Supervisor Accepted by ...
Chairman, Departmental Committee on Graduate Studehts of the Department of Civil Engineering
ABSTRACT
CONSOLIDATION BEHAVIOR OF AN EMBANKMENT ON BOSTON BLUE CLAY
by
JOSEPH FRANCIS WHITTLE,JR.
Submitted to the Department of Civil Engineering on May 10, 1974 in partial fulfillment of the requirements for the de-gree of Master of Science in Civil Engineering.
Since August, 1967, data have been collected from a heavily instrumented section of an embankment for the pro-posed Route -95 near Boston, Massachusetts. The embankment is
40 feet high, with crest and base widths of 90 and 260 feet respectively, and is underlain by 10 feet of fine sand and 135 feet of CL clay. The-field data, and laboratory test results are presented graphically and in tabular form
The finite element program FEECON was used to determine undrained deformations and stresses. When used with hyperbolic stress-strain parameters from CKoUDSS tests on laboratory pre-pared samples of Boston Blue Clay, FEECON gives good results.
The selection of appropriate hyperbolic parameters is dis-cussed. Based on comparisons with field data, the initial ex-cess pore pressures beneath the embankment are best represen-ted by the modified Henkel equation, Au = Act + aAT t. Hen-kel's a parameter is related to Skempton's A parameer or the appropriate stress history and stress conditions (plane strain
or direct-simple shear).
Pore pressure and settlement data were used to deter-mine the rates of consolidation within the clay. In the top 30
feet of clay where the overconsolidation ratio exceeds 2.5, the consolidation settlement occurs more rapidly than pore pressure dissipation, but the reverse is true in the lower 105 feet. Field compression parameters were computed from the
field data. The field RR's are 0.034 to 0.039, and the field CR's are 0.28 to 0.39. These values are 50% and85% greater than the laboratory values. Based on the field compression parameters, the predicted final consolidation settlement at the top of the clay beneath the embankment centerline is 7.8
feet.
Field coefficients of consolidation were computed by Gray's transformation for a two-layer system considering la-teral drainage with an isotropic permeability. The values
which gave the best prediction of settlement versus depth at several times were based on incremental time analysis of pore pressure data. These values are cvl = 0.71 ft2/day (top
30 feet) and cv2 = 0.24 ft2/day (lower 105 feet) and they
ex-ceed laboratory values by a factor of three.
Thesis Supervisor
Title
Charles C. Ladd
ACKNOWLEDGEMENT
This thesis would not have been possible without the support of my wonderful wife, E'Lyse. She has freely given
her ILxve, patience and encouragement, and spent endless hours
reducing and tabulating data.
In addition, the financial assistance I have re-ceived through the Haley and Aldrich, Inc. Professional De-velopment Program has greatly facilitated the achievement of my educational goal.
Finally, my thanks to Professor Charles C. Ladd, who so skillfully directed all my efforts in the preparation of
TABLE OF CONTENTS Page Title Page 1 Abstract 2 Acknowledgement 4 Table of Contents 5 List of Tables 8 List of Figures 10 1. Introduction 13 1.1 Background 13 1.2 Purpose 13 1.3 Scope 14
2. Subsurface Conditions and Soil 17
Properties 2.1 General Geology 17 2.2 Soil Profile 18 2.3 Soil Properties 19 2.3.1 Index Properties 19 2.3.2 Stress History 19
2.3.3 Compression and Consoli- 20 dation Data
2.3.4 Undrained Shear Strength 21
3. Construction History 32
3.1 General 32
3.3 Instrumentation Page 4. Embankment Performance 38 4.1 General 38 4.2 Settlement 38 4.3 Pore Pressures 41 4.4 Horizontal Deflection 43
4.5 Internal Embankment Stress 45
5. Parameters for Undrained Deformation and 69 Stress Finite Element Analysis
5.1 General 69 5.2 Granular Soils 69 5.3 Cohesive Soils 72 5.3.1 General 72 5.3.2 Hyperbolic Parameters 72 5.3.3 Shear Modulus 75 5.3.4 Poisson's Ratio 76 5.3.5 Bulk Modulus 77
5.3.6 Undrained Shear Strength 77 5.3.7 Initial Stress Level and Ko 77 5.3.8 Pore Pressure Parameters 78
5.3.9 Peat Parameters 78
6. Comparison of Predicted and Measured Un- 95 drained Deformation and Stresses
6.1 Yielding 95
6.2 Horizontal Deflection 95
Page
6.4 Foundation Stresses I
6.5 Pore Pressures 100
7. Analysis of Consolidation Behavior 123
7.1 Pore Pressure 123
7.2 Consolidation Settlement 125
7.2.1 General 125
7.2.2 Laboratory Compression Para-127 meters and Predicted Pcf
7.2.3 Field Compression Parametersl27 7.2.4 Predicted Final Consolidationl29
Settlement
7.2.5 Consolidation 130
7.3 Field Coefficients of Consolidationl32
7.3.1 General 132
7.3.2 Full Clay Thickness 132
7.3.3 Reduced Clay Thickness 134 7.3.4 Predicted Consolidation Set-13 5
tlement
8. Conclusions and Recommendations 163
9. References Appendix A-1 Appendix A-2 Appendix A-3 Appendix A-4 Appendix A-5 Appendix A-6 Appendix A-7 166
Date-Day Conversion Chart16 9
Instrumentation 170
Construction History 173
Settlement Data 176
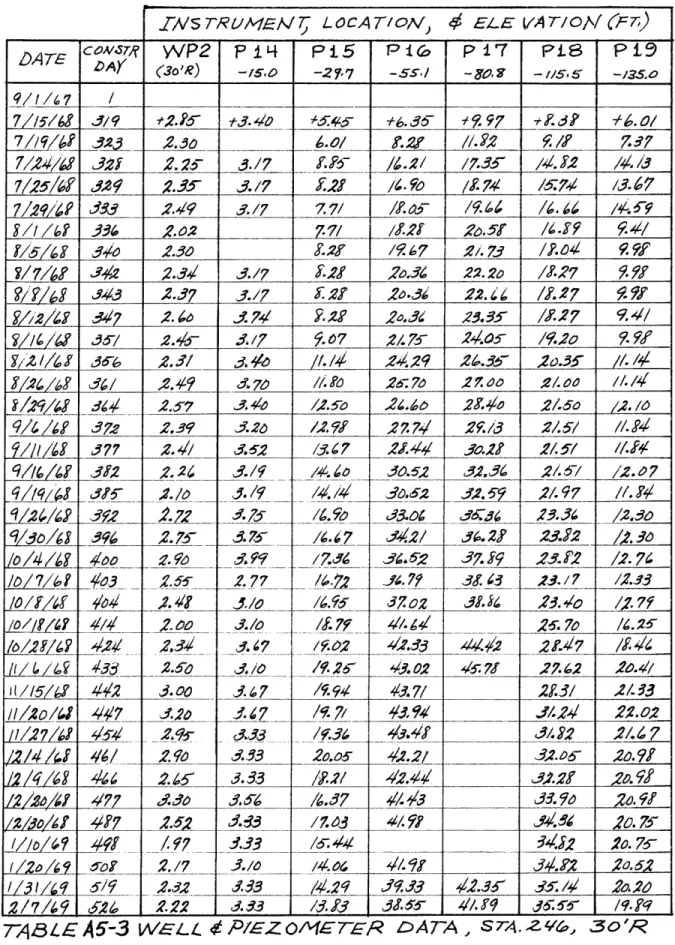
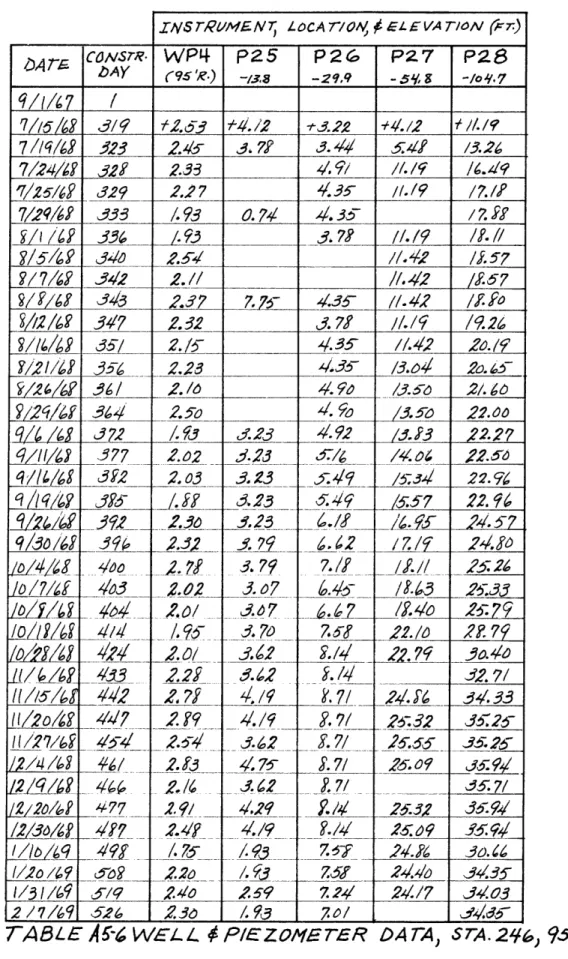
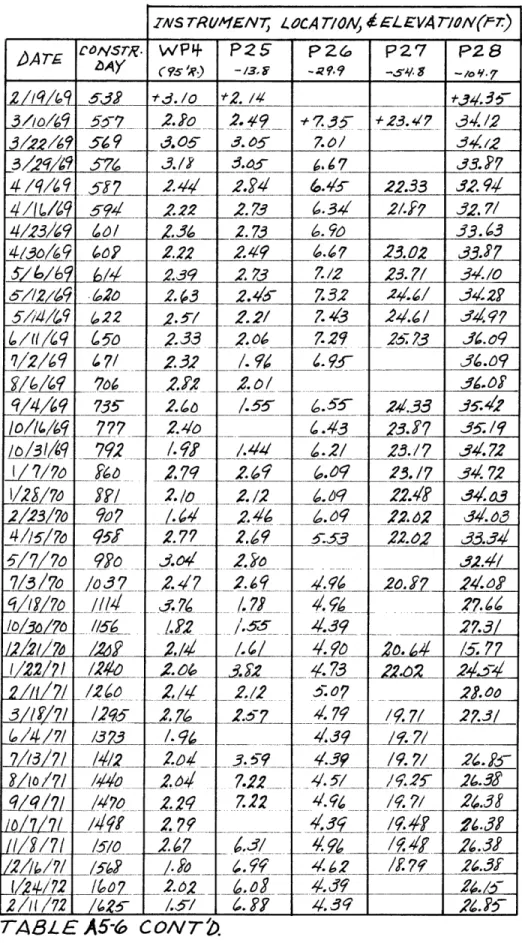
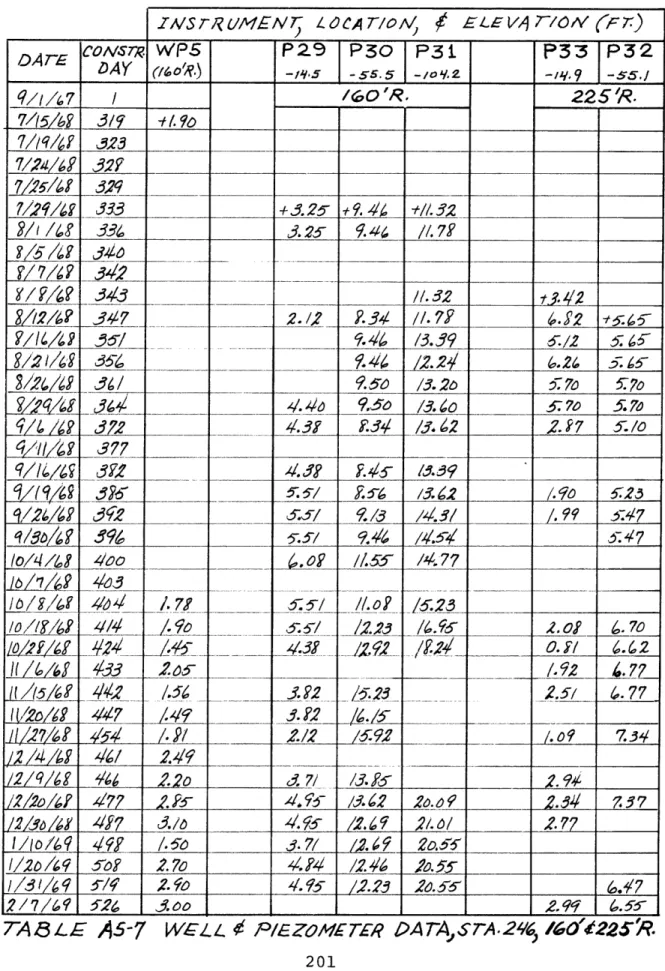
Well and Piezometer Data 184
Inclinometer Data 204
LIST OF TABLES
Page 4-1 Maximum Measured Excess Head, Sta. 246 46
5-1 Hyperbolic Axial Stress-Strain Parameters 79 for Granular Materials
5-2 FEECON Parameters, Hyperbolic Axial 80 Stress-Strain Materials
5-3 FEECON Parameters, Hyperbolic Shear 81 Stress-Strain Materials
6-1 FEECON Predicted Horizontal Deflections 104 6-2 FEECON Predicted Initial Settlements 105 6-3 FEECON Settlement Correction Factors 106
and Corrected Initial Settlements
6-4 Change in FEECON Vertical and Hori- 107 zontal Stresses
6-5 Change in FEECON Principal Total Stress 108 6-6 Change in FEECON Octrahedral Total 109
Stress
6-7 FEECON Predicted Initial Excess Head 110 7-1 Pore Pressure Dissipation at , Sta.246 137 7-2 Average Degree of Consolidation on 138 7-3 Incremental Consolidation (Pore Pres- 139
sure)
7-4 Final Consolidation Settlement (-D) 140 With Corrected Laboratory RR and CR
7-5 Final Consolidation Settlement 141
(Modified Skempton-Bjerrum) With Cor-rected Laboratory RR and CR
7-6 Field RR Values 142
7-8 Final Consolidation Settlement (1-D) Page With Field RR and CR
7-9 Final Consolidation Settlement 145
(Modified Skempton-Bjerrum) With Field RR and CR
7-10 Composite Final Consolidation 146
Settlement With Field RR and CR
7-11 Incremental Consolidation (Settlement) 147
7-12 Computed Field Cv's - Full Thickness 148 7-13 Calculation of Field Cv2 From Pore 149
Pressure, Full Clay Thickness
7-14 Calculation of Field Cv2 from 150
Settlement, Full Clay Thickness
7-15 Computed Field Cv's - Reduced 151
Thickness
7-16 Calculation of Field Cv2 (Pore 152
Pressure) Reduced Clay Thickness
7-17 Calculation fo Field Cv2 (Settlement) 153
Reduced Clay Thickness
LIST OF FIGURES
Page
2-1 Site Location Plan 24
2-2 Nearest Borings 25
2-3 Average Profile Sta. 246 27
2-4 Atterberg Limits and Stress History 28
2-5 Compression and Consolidation Data 29
2-6 Su/uvc vs. OCR from Triaxial Tests 30
on Sta. 246 Samples
2-7 Undrained Shear Strength, Sta. 246 31
3-1 Construction History 34
3-2 Embankment Density 35
3-3 Embankment Profile and Instrumentation, 36
Sta. 245
3-4 Embankment Profile and Instrumentation, 37
Sta. 246
4-1 Lateral Distribution of Measured 47
Settlement
4-2 Measured Settlement, Sta. 245 48
4-3 Measured Settlement, Sta. 246,V 49
4-4 Measured Settlement, Sta. 246,90'R 50
4-5 Differential Settlement, Sta. 246, 51
4-6 Differential Settlement, Sta. 246, 90'R 52
4-7 Excess Head, Sta. 245 53
4-8 Excess Head, Sta. 246, 54
4-9 Excess Head, Sta. 246, 30'R 55
Page
4-11 Excess Head, Sta. 246, 60'R 56
4-12 Excess Head, Sta. 246, 95'R 57
4-13 Excess Head, Sta.246, 160'R 58
4-14 Excess Head, Sta. 246, 225'R 59
4-15 Horizontal Deflection vs. Elevation 60
4-16 I-3 Movement, Sta. 246, 45'R 61
4-17 I-4 Movement, Sta. 246, 9'R 63
4-18 I-5 Movement, Sta. 246, 160'R 65
4-19 I-6 Movement, Sta. 246, 225'R 67
5-1 Non-linear Stress-Strain Model by 82
Incremental Method
5-2 Finite Element Mesh 83
5-3 Adjusted FEECON Unit Weights 84
5-4 Hyperbolic Transformation of CKoUDSS 85
Test Data
5-5 Resedimented Clay, CKoUDSS Data, OCR = 1 86
5-6 Resedimented Clay, CKoUDSS Data, OCR = 2 87
5-7 Resedimented Clay, CKoUDSS Data, OCR = 4 88
5-8 Resedimented Clay, CKoUDSS Data, OCR = 8 89
5-9 Normalized Shear Modulus and Rf Factor, 91 Resedimented Clay
5-10 Shear Strength of Resedimented Boston 92 Blue Clay
5-11 Strength Anisotropy of Boston Blue Clay 93
5-12 Ko for Boston Blue Clay 94
6-1 Finite Element Yielding 111
6-2 Predicted and Measured Horizontal Deflection1 1 2
Page
6-3 Predicted and Measured Initial 114
Settlement (CD 620) Sta. 246
6-4 Predicted and Measured Initial 115
Settlement (CD 329) Sta. 245
6-5 Corrected Initial Settlement 116
Predictions
6-6 Drained Vertical Stresses in Clay 117
Sta. 246,
6-7 Initial Excess Pore Pressures Under 119
Embankment Top, C and 30'R
6-8 Initial Excess Pore Pressures Under 120
Embankment Slope 60'R and 95'R
6-9 Initial Excess Pore Pressures Outside 121 Embankment Toe, 160'R and 225'R
6-10 Skempton's and Henkle's Parameters 122
7-1 Pore Pressure Dissipation Beneath 154
Centerline
7-2 Centerline Consolidation 155
7-3 Differential Consolidation Settlement, 156
Sta. 246,
7-4 Differential Consolidation Settlement, 157 Sta. 246, 90'R
7-5 Predicted Final Consolidation Settlement, 158
7-6 Centerline Consolidation (Settlement) 159 7-7 2-D Consolidation, Permeable Top and 160
Base
7-8 2 - D Consolidation, Impermeable Top 161 and Base
7-9 Predicted Consolidation Settlement, 162
Sta. 246, C
1. INTRODUCTION
1.1 BACKGROUND
In August 1967 construction began on an embankment for Interstate highway -95 across the Revere-Saugus tidal marsh northeast of Boston, Massachusetts. This involved a large em-bankment, 25 to 40 feet high and 2.4 miles long, constructed over a 40 to 160 feet thick deposit of medium to stiff clay, known as the Boston BlueClay (BBC).
The embankment design called for staged construction with a surcharge to minimize post-pavement settlements. Be-cause of uncertainties in the amount and rate of settlement, and also end of construction stability, instrumentation was
installed at numerous stations along the embankment. One sta-tion in particular, Stasta-tion 246 + 00, known as the M.I.T.
-Massachusetts Department of Public Works (MIT-MDPW) Test Sec-tion, was heavily instrumented. The instrumentation included
settlement platforms, settlement rods, peizometers, slope in-dicators and total stress cells. Considerable performance data have been collected during the seven years since the
start of construction.
1.2 PURPOSE
Various researchers have dealt with different aspects of the embankment performance. However most of the analyses
to date have dealt with perfo
polonia, et. al., 1971). In
and Lambe (1973) have discuss
struction in a general way, b made.
One purpose of this re usable format all data pertai foundation clay at the test s encourage further analyses o the M.I.T. finite-element pro after-the-fact prediction of mitted an evaluation of this plane strain loading in Bosto evaluation of the input param and of main interest, an anal
ior beneath the embankment ce
sion parameters and the coeff in-situ plane strain condition ta. Measured and predicted cons compared.
1.3 SCOPE
Chapter 2 summarizes t the Test Section. The soil pr
sults for samples obtained nea
14
-mance during construction
(D'Ap-tddition, Recker et. al., (1973)
~d the performance after
con-it no analyses of the data were
)ort is to present in a readily Ling to the performance of the
!ction. This will simplify and the field data. In addition, rran FEECON was used to make an Lndrained performance. This per-)rograms's applicability to
Blue Clay. It also allowed an !ters used for FEECON. Finally, 7sis of the consolidation behav-Lterline was performed.
Compres-cients of consolidation for the qere determined from the field da-)lidation settlements were alsQ
Le initial in-situ conditions at
ifile, boring data, and test
Chapter 3 summarizes the construction history of the Test Section, including embankment construction and instrument in-stallation. Field data for the foundation clay, including settlement, inclinometer and piezometer data, are presented in Chapter 4. In addition, problems encountered with data collection are discussed. The application of the FEECON pro-gram is presented in Chapter 5. This section includes a dis-cussion of the appropriate stress-strain parameters based on model footing tests, and lab stress-strain-strength data. In Chapter 6, the FEECON predictions arecompared with other pre-dictions andmeasured data. Chapter 7 presents the consolida-tion analysis beneath the centerline, based on both pore pres-sure and settlement data. Various methods of back figuring field values for the coefficient of consolidation are dis-cussed and the results compared to field data. Conclusions and recommendations for further study are given in Chapter 8.
2. SUBSURFACE CONDITIONS AND SOIL PROPERTIES
2.1 GENERAL GEOLOGY
The following discussion is based on D.E. Reed's
summary of the geology of the Boston area (Reed, 1971). Bed-rock at the site is the Cambridge Argillite, which has been subjected to varying degrees of alteration and weathering. Diabase dikes and sills, from less than a foot to hundreds of feet in thickness, are common in the bedrock of the Boston area. The lowest soil unit is usually till, a heterogeneous mixture of soil sizes deposited beneath the ice sheet. The till is frequently covered by outwash sand and gravels, de-posited by meltwater from the ice front during retreat of the ice sheet 14,000 to 15,000 years ago.
Depression of the bedrock due to the weight of the glacier, and rising sea level due to melting of the retreat-ing ice sheet, formed the Boston Basin - an innundated trough. Vast quantities of silt and clay size particles settled out of suspension, forming the marine illitic clay called the Boston Blue Clay. In places, the thickness of this deposit
exceeds 200 feet.
Sea level lowering associated with a minor readvance of the ice 12,000 years ago (the Lexington Substagei re-sulted in desication and weathering of the top of the clay.
In addition, meltwater streams often covered the clay sur-face with outwash sands and gravels. The uppermost layer at the site is peat, which has accumulated since a relative sta-bilization of the sea level some 2,000 to 3,000 years ago.
2.2 SOIL PROFILE
Figure 2-1 shows boring location and the general site plan. Available boring data are reproduced in Figure 2-2. The assumed soil profile is shown in Figure 2-3. This profile is based not only on boring data, but also on instrument ele-vations and installation records.
The assumed average profile at Sta. 246 show the
na-tural ground surface (top of the Peat) at elevation (El.) of +5 (U.S.G.S.). The groundwater elevation is +2.5. The
sur-face of the gray shale bedrock (Cambridge Argillite) is at a
depth of 168 ft. or El. -163. This is overlain by 8 ft. of
silty, clayey sand and gravel which is glacial Till. Standard Penetration Test values (N values) in the Till range from 24
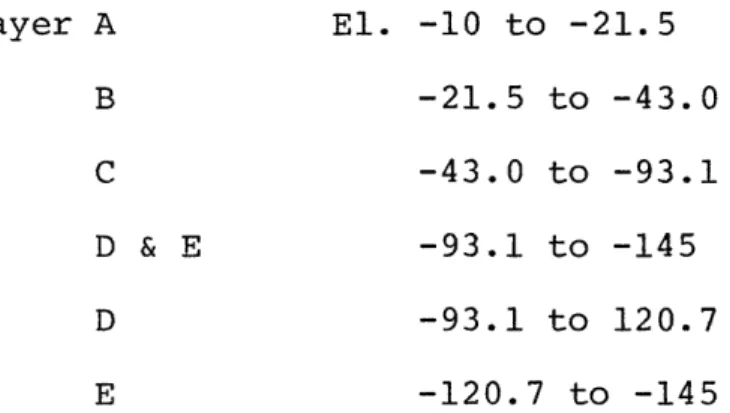
to 171 blows/ft. Above the till, between El. -10 and -145, is
135 feet of gray CL silty Clay (Boston Blue Clay). Lenses and thin layers of silt or very fine silty sand occur within the top 30 ft. of clay, but apparently are discontinuous. The top
10 ft. of clay is a medium-stiff desiccated crust with N = 10,
and a bouyant weight of 59 pcf (Guertin, 1967). Below this,
the clay is "soft" (N = 2-4) with a lower bouyant weight of
52 pcf (Guertin, 1967). However, fieldvane values for un-drained shear strength (su) of 700 - 1200 psf indicate medium
to stiff consistency. Immediately above the clay, between
El. 0 and -10, is 10 ft. of fine to medium poorlygraded sand.
N values average about 20 blows/ft. The top layer of very soft Peat and Organic Silt has N values of 0 to 2.
2.3 SOIL PROPERTIES
2.3.1 Index Properties
Figure 2-4 shows the results of Atterberg Limit Tests performed on samples from borings close to Sta. 246. Only
data from D22 and D24 (Storch, 1965) and MIT - P11 (Guertin,
1967) are plotted. The average values are: plastic limit,
22%; liquid limit, 44.4%; plasticity index, 22.4%; natural
water content, 40.6%. There is consistent increase in natur-al water content with depth to El. -45, where it becomes roughly constant with depth. There is a similar, but less well defined relation between liquidity index and depth.
2.3.2 Stress History
The stress history, also based on tests from samples from the three nearest borings, is depicted in Figure 2-4.
The upper 60 ft. of clay, between El. -10 and -70, is
11 at the top. The data from the MIT - Pll boring agrees
very closely with the initial vertical effective stress (vo). The commonly-encountered correlation between liquidity index and stress history (LI > 100% for OCR = 1) does not occur. However, the boundary between over- and normally consolidated clay of El. -70 is supported by field vane and UC and UUC data.
2.3.3 Compression and Consolidation Data
Figure 2-5 summarizes the compression and consolida-tion data from Storch (D22, D24) and M.I.T. (MIT - Pll) oedo-meter testing. Values of the recompression ratio (RR lCr )
1+eo show a great deal of scatter, but the average RR is 0.024. The virgin compression ratio (CR = Ccl+e ) increases roughly
1+eo
linearly from the top of the clay to El. -70, where it be-comes constant with increasing depth. Average CR lab values
are 0.15 from El. -10 to -40, 0.19 between El. -40 and -70, and 0.21 below El. -70.
Values for the rate of secondary compression (Ca) Aev
at the insitu stress are depicted as plots of C (Ca= Alog t)
versus depth. These values are for MIT - Pll data only. C is a stress-dependent parameter, and exhibits expected variation with depth (Ladd, 1971). In the over-consolidated region, Ca increases with increasing depth (as the ratio of initial to maximum past vertical effective stress vo/Ovm approaches 1)
and is roughly constant with depth in the normally consoli-dated zone
Coefficients of consolidation (Cv) versus depth, at the insitu stress, are also shown. In addition, estimated Cv values at the final effective vertical stresses, vF (from the program FEECON) are shown. These were taken from Guertin's (1967) plots of Cv versus vc, on the basis of the ratio
vF/ vm. It is reasonable to assume that the effective Cv ver-sus depth is represented by the average of both sets of Cv values. This approach results in the following average values:
Cvl (above El. -70 for OCR > 1) = 0.27 ft2/DAY, Cv2 (below El. -70, for OCR = 1) = 0.09 ft2/DAY, Cvl/Cv2 = 3.0.
2.3.4 Undrained Shear Strength
Based on comsolidated-undrained triaxial compression test, CIUC (undrained shear after isotropic consolidation) and CKoUC (undrained shear after K consolidation), on samples form MIT - Pll, the normalized Su (Su/avo) vs. OCR relation is plotted in Figure 2-6. These tests were performed according to the SHANSEP procedures (Ladd, 1971). They were consolidated to 2-3 times vm and rebounded to av which gave the
appro-priate OCR, followed by shear.
Figure 2-7 showsvarious Su vs. depth relationships
from field and lab data. The strength relationship of Figure 2-6 was used to compute Su vs. depth at the Test Section
(solid line in Figure 2-7). In a similar fashion, Su for
plane strain active and passive (PSA and PSP) and direct sim-ple shear (DSS) conditions are shown as dashed lines. However, these values are based on tests of laboratory prepared samples of resedimented Boston Blue Clay. These techniques and data are extensively covered in Kinner and Ladd (1970) and Ladd and Edgers (1972) among others. Unconfined (UC) and Unconsol-idated-Undrained (UUC) test results from all three borings are also presented. Finally, Geonor Field Vane (FV) test re-sults are shown for two tests performed prior to construction
at Sta. 244 + 85.
The strength data shown in Figure 2-7 lead to the fol-lowing observations:
(1) There is a significant difference between Su with the major compressive stress in the vertical rection (SuV from CKoUPSA data) and the horizontal di-rection (SuH from CKoUPSP data). This indicates the importance of accounting for strength anisotropy.
(2) U and UU tests give much more scattered results and lower strengths than other test methods.
(3) The FV data are quite consistent below El. -50. Scattered data above this level could be due to sand or silt lenses or varying avm due to varying degrees ofdesiccation. FV data coincides closely with SH from CKoUPSP tests in the NC zone.
(4) CIUC and CKoUC test data, the most sophisticated data an engineering firm may have, may be slightly con-servative or very unsafe, depending upon location. Be-neath the centerline where olF is vertical, it may be safe , but away from the centerline, as O1F tends toward the horizontal, this type of data is unsafe.
0
VD V) JOEiWh -Jo LIZ V9 I-0 10 C2
z
0
u-0
.1w
F-LI) w LI (: rlf"" IF/BRoUS P£EAT alD. r. . _D. . A,. A 34., Sdrh. r., C. SA:, f. 8,'r. F. SA '/-, S,-t
P//
4.3,9
r
4S.otCe.Y
/ F/8RoVS p7 .XT -O F Jt S -a D- fVAL. S bj &vi G'.. Sri. - f A .
S.
SfyE-&
.r
o *'. w. SO . ,y. 9"1 ;a~g*i 4)v, m, Fr .. c;4y 3 etr. .,. '0.. 0'#,e -20,/ ·~~~~~~~~~~
.Sof I.V. CL. w/f-I/I LSAyer:
*
f. $,4.SoF'r 6Y. CL*y
V. PA.4$7rl
GF,4,V,17'14' C r Cl,_
XZh~V4T/' v- _ M'?
V. coFT RCAy
C;AYj V. PLAST,C
sPT7
zow;/Fr_,.E/lV47o ~/4v ,37R,9r/I6, J9P# l -o,/ ?./f /9 4 3p/4f)rOM rV8. I'VeHs s PAESED ,/BROUS PRA V SCLA ,,,'Ot T' -240 1 ..EPb oF
Vs
SOR/6-GY. e- ASh. f. SA. 4 d-. Gqv'L.. /
£NGR3..~ tqo 5')
S7o0 C-F/6a4Rk
2-2
NAI? --
'S T
Bo lk/M5
D22
v*q. oq 22 2S '3 i2 -zY.9 /0 Li-20
-30
- 4'0 5'0k
<,
I -/6o BoTi kPssk -I/o -/-I0
-ID~lJ_,,_w!ZC q - 570/1-5 hl.<e _ 'kP7f0, /V0 / 41@ '/5 7cP/2
,.¥ /. soor .- . Yc, .SAND 7. - . .. . pAr Irr. C. SAWVP 0 --'.-So~r cry. CtIY, sA7. v. jz1ry 4toaf, pzmrrelr¢) (Alte, pt1957/'Tr SoFT Gry. Cy (V. pI AI) 3 s/zy r
SOPT G-rY. CL.y
6 ry. SA-, F -,M. S/I- Y 'J4cr/zb dIIN C. SAVA N C.CAY (rZ4L)
WARP z4r.,-Y. S.s LAy'
so-r ORA SAL4, (V. WEAt#ZRtE)
nAMOa 6A AR6a
rE--/ ,6S.-l' -IRI,5, oC &. t~ -It
PEAl 7 s/A 7; tr. W'e,2>
2 '. x as -;. S4A,
tr. S.T
G -y, f. sA,
SO7). 51r
Gr. CLA, * of
SA' n a'; red.V
w4jtcD th#Af ,Pn SAAhb}. 6ry C4. it6-VL. G.RAy 'o-IC
/.-l/u
, -3' - A .76 4. A 8 ,7- -a S S 3 3 2 2 3 a 2 27
1'40
% L I -/oo - 1/0 -/24 -qa9 /50 -/70 -/8o -1. 8 40 /7 3IC D -$3. 3 J 3co/r
'D.
-+4 .. 1 --/92-2
F/Gu
7
NArA ROVIO S uRF~qC~
If 5' +2.5 1 v Sk W, X w WIf v.,. 7,3¢,f ,.., ~
PFAT
N-o-2 71: = / I PC¢fpc,. ,b = 52 C F(
GJAy
,SHL
A
LE(CAA18R1DsG9
41/6/L
/
rE)
F//URgE 2-3
AVEgAGE POF/L E o 5'rA, 216
-/O 0o -/O
-20
-30
4/5A4b
(SP) N'2o 'YjOPcI'
N=/o
Y 59pcF I-'-l< I .qI 50- 70
-80-90
-/00
- /o
,80 TOt!
CLA Y-/20
/30
i/o
/50
/60
- /5 CLAyJ S/r /T, S9Nb . &.RAVEL
/V
2/-17
1 - / / _( 77LL)
Y=- 80
- 1-_ _ _ , tI I I I I I I I I I I I I ' 1 V) {X
I
I-i 9.~~~~~~~~~~~~~~~~~~~~~1~~~~~I
(,9 (I) L) L14 Iz IIJ I I I I I I I I I I I I IL EI rv f) ekg 1 ) I \ - $ $ U v - A/O/-L V/A :73'ij
I . it) 1, t" K 14 t4 -4 (I I.-I 0 k 0 To Q 0 Era I .j1 3 *I I I I I I I I I I I I I I
0
0~
_ -,.o
_ o _ ~~~_ o__0
'
"
-o
-~~0~~~
i,~~~~~~~~~~~~~~~~~~~~~~~~~~~~~~~~~~~~~~~.
-~ ¢>? * - ° -- O~~~~-- - - -H~t -- '-0
-
',.
~~~~~~~~~~~~~~~~~~~~~~~~~~CJ.1 0 0 i 0 0% oo-00
0 *
0-1
I I I I I I I I I I IL I
I
I
I
I I
I
I I
I
I I
I
a q g
I2
G
,4
~~~~~~~~~~~~~~~~~aw
] I I I I I'Z/=/
-
NO.Z
I'VA.
a 75
I Q 'I-, Ir) At ut -
0o _el
0 ·*~~~ ~~~~ l;o_
~L
.
__
____
* 0 0 N U' k1 Is a I U1 It (k-) 1<~ 9 "c 0C 0) IN Uj 1,. 'I IZO LQ~14 CN, If
N -- i - ; s
oAS/g IXz Is_
30 V) ~48 4% iJ C,(1% K9 %4IC c 10 (a I'Q A'D /. -j
-b
Y
jJ-
,VO lfr
7
II (o tzk I', '3 N :, LUk
(#) I) '4'3. CONSTRUCTION HISTORY
3.1 GENERAL
Throughout this report, reference is made to time in Construction Days (CD). The date 1 Sept. 1967 was designated as CD 1. It roughly coincides with the completion of the ear-liest instrument installations. A Date - Construction Day conversion chart is given in Appendix A-1.
3.2 EMBANKMENT CONSTRUCTION
The final design embankment grade for the pavement is
El. +18 ft at Sta. 246 (13 ft. above natural grade). To
mini-mize post-contruction settlements, the embankment was
pre-loaded with a surcharge to El. +40 ft. in three stages of filling. (see Figure 3-1).
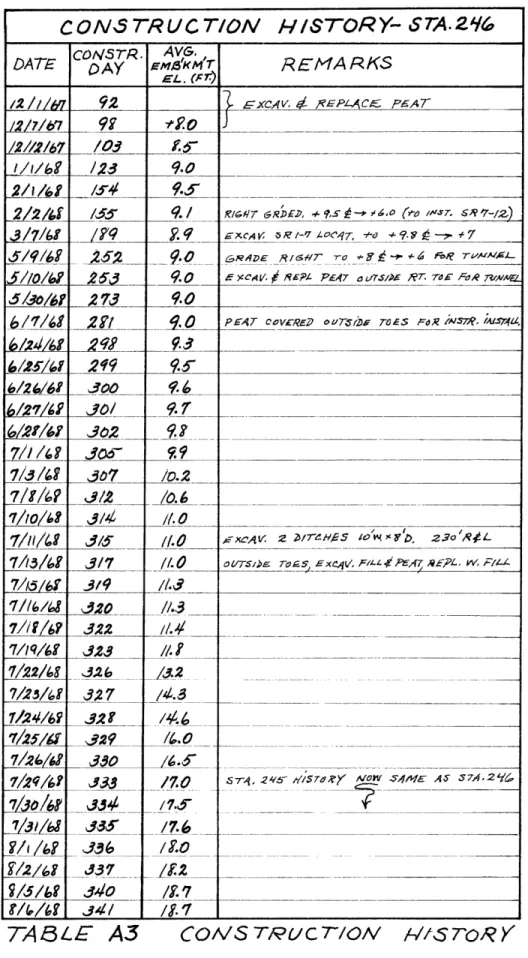
Stage lconsisted of excavation of the 5 ft. peat layer followed by replacement with fill (probably end-dumped to El. +5) and continued filling to the Stage 1 El. of +9. The excavation and replacement to original grade ocurred during
Dec. 1-7 1967 (CD 92-98). The stage 1 El. of +9 was reached on 1 Jan 1968 (CD 123).
Except for minor construction operations (installation of instruments and access tunnel), no further filling ocurred
for almost seven months. Stage 2, which included the placement of about 70% of the final fill height, began on 24 June 1968
(CD 298). This stage continued without interruption until the
fill reached El. +36 of 4 Dec. 1968 (CD 461). The final stage, Stage 3, consisted of the placement of the final 4 ft. of
fill between 20 April and 12 May 1969 (CD 598-620). Embank-ment construction is tabulated in Appendix A-2.
The fill material consisted of a well-graded fine to coarse sand with some fine to medium gravel (SW). Results of field unit weight tests on various lifts above El. +22 are given in Figure 3-2 (Wolfskill and Soydemir, 1971). The fill was compacted with rubber-tired rollers above E +5. Based
on these data, the average total unit weight is 119 pcf.
Since values as low as 102 pcf occur in the compacted fill, a
value of 100 pcf was chosen for the dumped fill between El. 0
and +5.
3.3 INSTRUMENTATION
Figures 3-3 and 3-4 show the embankment profiles and instrumentation at Sta. 245 and Sta. 246. Although the details of the-instrumentation are covered in Wolfskill and Soydemir
(1971), a brief summary is provided here.
There are two groups of instruments. The major group, the "construction instruments", was installed at the Test Sec-tion after Stage 1 (El. +9) was completed. A minor group, the "preconstruction instruments", was installed prior to any con-struction at Sta. 245. These instruments were to provide
per-formance data for the 1st Stage of construction.
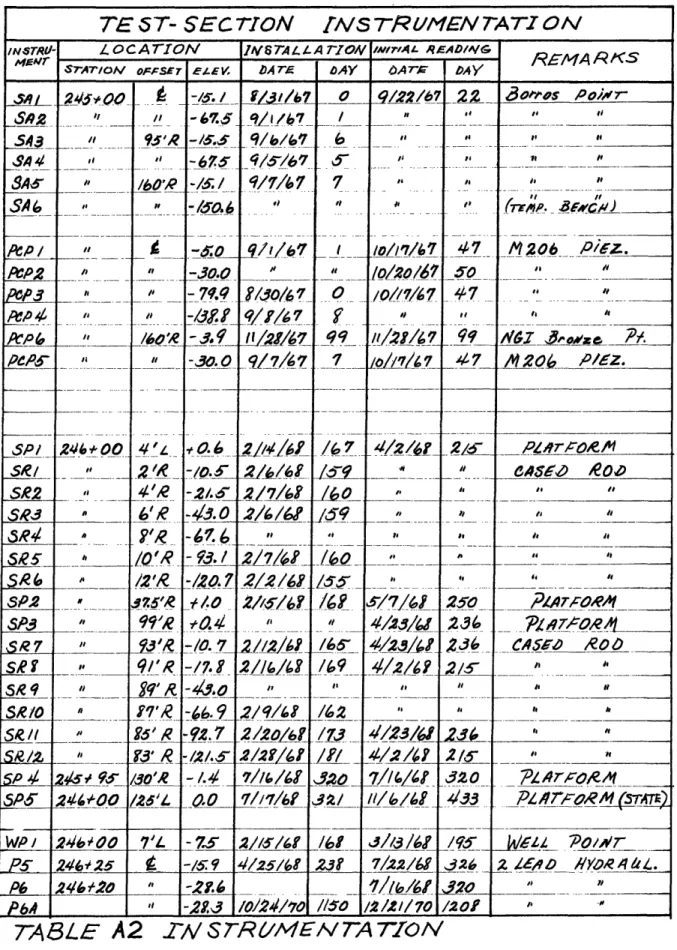
Most of the Test Section instruments are accessible from a tunnel beneath the right (East) side of the embankment. This was to provide protection from vandals and weather. The time of initial readings of the instruments are shown in Fig-ure 3-1. Instrumentation is tabulated in Appendix A-1.
At Sta, 245 the settlement instrumentation consisted of six Borros Points, one of which was installed in the till and used as a temporary benchmark. The only other instruments were six M206 single-tube hydraulic piezomenters.
At Sta. 246, all M.I.T.-monitored instrumentation was located between 30'L and 225'R. There were a few MDPW-moni-tored instruments located further to the left of the center-line. the M.I.T. settlement devices included four settlement platforms at the top of the natural sand. Additionally, deep settlement data were provided by twelve settlement rods in
the clay. These consisted of cased 1" o.d. pipes with round 2 1/2" o.d. plates welded 18" above the tips. A permanent cased benchmark was installed in the till.
M.I.T. pore pressure data was provided by 38 piezometers at various offsets and elevations in the clay and till. In ad-dition, 5 porous-point well points were installed in the bot-tom of the natural sand. Five slope indicators (inclinometers) were also installed beneath the right side of the embankment. Finally, three total-stress cell clusters were installed within the embankment at El. +17.
I I I I I I I I i I I
o
~0
34 a31 N .J E 1 4 f--i 47 VEIn1At
)> 0
l I,
0E
u
Z
t--
I oi D)0
} U T
n
7-o 0 0 0
+
+
t
t
I
(:1.4.)
,
.I,'^
-a -- -a
I
ib
I (Ik
K NU K 1I a ,k
'. tiz
-,
Z-
A2/Z
VA
7
W> zt, % It k W.N - - Q, vi fl W d VC Ia 17 a.
_
~~~//I ! ! ! I __ I
- VI _ § -3 'rn-0 . _q U 1 a. In Q M to -"I 0 N 4 C-I -i Q C q Q -I. -~~~~~~~~Q
Q * 0 U V' < 2 Q4 I . .I
I
I
. ', I , ., , , ..
IC *0 4. I . . I , It $ * I t I I :7 I - - -"
7 -/- A /fn // LfA=7~ IK<
.-.. - - , V I.v'.-. VI I.. ' . -' U K q- K K '-R C, 1--W LU 0 )44 @-Rt J r)< QC%St
-j 4 1 k w m \S I I I 4 : --I-I .V) I · , · , M~~~~~~~~~~~~ - . I I 1 r I I I I I' I I I I · .- lf -. . "'N
>
K
K is
r
1r % 1 D C) I J I I I i I I I I I I I a I I I s , .11 ,1
1. I I I I I I[ I-.2 z/- A'QLLIVA 3-Y 7 J7 L k E.4t 4 -, 4-Q i v) k - LU ad-4,.
.14. EMBANKMENT PERFORMANCE
4.1 GENERAL
Most of the data pertinant to the performance of the foundation clay are presented and utilized in this report. The most important data excluded are the total stress cell mea-surements for the embankment interior(El. +17). In addition, data from the state monitored instruments were not analyzed.
4.2 SETTLEMENT
Figure 4-1 shows the measured settlement at the top of the sand and the top of the clay beneath the right side of the embankment. Settlements are shown for CD 620 (end of con-struction) and several times afterward, and are dish-shaped, indicating elastic loading.
Total measured settlements and fill elevation are plotted versus time (log scale) for Sta. 245 and Sta. 246 in Figures 4-2 to 4-4. At Sta 245, readings were not taken during the entire construction period. They appear very erratic be-cause of the small scale. However, the actual variations are not excessive, being nly + 0.02 ft. It is not clear from
Sta. 245 data if settlement of the clay due to Stage 1 consol-idation was complete prior to Stage 2 filling.
Due to improper installation of some cased settlement rods at Sta. 246, some of the deep settlement data became
unusable. The specifications originally called for a minimum vertical distance of 0.5 ft. between the bottom of the casing and the supporting plate on the settlement rod. As actually installed this distance varied greatly - between 0.17 and 1.27 ft. A combination of insufficient clearance and large settlements invalidated the data for four settlement rods: SR4 and SR6 (centerline), and SR10 and SRll (90' R).
Possible corrected settlements for these rods are shown in Figures 4-2 and 4-3 as dashed lines. Unfortunately, the casing elevations were only monitored twice: upon instal-lation and 8 November 1973 (asanoutcome of this study). As a result, the times when casing settlement actually invalidated the data are unkown. Figures 4-2 and 4-3 indicated that this occurred before the following times: SR4, CD1200; SR6, CD1200; SR10, 1300; Srll, CDllO0.
An attempt was made to determine the earliest day when casing settlement invalidated the four deep settlement points. It was assumed that the ratio of casing settlement (based on top elevation and assuming no compression) and the settlement of the nearest platforms was a constant between the installa-tion date and 8 Nov. 1973. This allowed an estimate of casing settlement versus time. The earliest invalid day is the day on which the casing settlement exceeded the rod settlement by an amount equal to the initial clearance. The resulting earliest invalid days are: SR4, CD382; SR6, CD860; SR10,
CD1470; SRll, CD1037.
Although four rods produced invalid total settlements, seven sets of differential settlement data were invalidated. Casing drag on one rod will result in a reduced apparent dif-ferential settlement (or even heave) in the overlying layer, and increased differential settlment in the underlying layer. The measure differential settlements at Sta. 246 are shown in Figures 4-5 and 4-6. The curves plotted represent the mea-sured differential settlements between adjacent settlement rods. For example, SR1-2 is the difference in total measured settlement between SR1 and SR2. Due to casing drag the follow-ing remarks can be made about the apparent differential
set-tlements in Figures 4-5 and 4-6:
SR 3-4 too low
SR 4-5 too high
SR 5-6 too low (apparent heave)
SR 6 too high
SR 9-10 too low
SR 10-11 probably too low
SR 11-12 too high
The above errors in measured settlements greatly com-plicate analysis of the settlement data. All that is certian is that at the centerline, final consolidation settlement has been reached above SR3 (El. -43). Similarly, at 90 ft. right, final coDnsolidation settlement has been reached above SR8
(El. -18) and it is probably close between SR8 and SR9 (El.
-43). In Chapter 7, only differential settlement data of
known validity is used in consolidation analysis, and the data
is plotted in Figures 7-3 and 7-4.
Although the behavior of the natural sand is not an object of this study, one aspect is interesting. The differen-tial settlement between SP3 and SR7, 90'R, indicates that the natural sand dilates after an initial compression. This occurs
after the fill height is a maximum above SP3 (El. +16), so
that further filling is moving laterally away from SP3.
All settlement data are tabulated in Appendix A-4. The vertical distribution ofsettlement vs. time is discussed in
Chapter 7.
4.3 PORE PRESSURES
Measured excess pore pressures in feet of water are
plotted vs. time (log scale) for Sta. 245 and Sta. 246 in
Fig-ures 4-7 to 4-14. Since readings were generally made every day, only representative data points (except at Sta. 245) are
plotted. The measure excess pressure represents the difference between the measure total head elevation at a piezometer and the "hydrostatic" piezometricelevation at the piezometer.
At Sta. 245, the hydrostatic elevation was assumed
equal to the total head elevation indicated by the piezometers
in the natural sand. At Sta. 246, the hydrostatic elevation
was assumed equal to the water elevation in the nearest well in natural sand. It must be noted that inreality this is not correct. The data for the centerline piezometers indicates that the piezometric water elevations (PWE) in the sand
above the clay and the till below are not equal. As a result of an apparentartesian condition, the PWE is increased by five ft. in the till. For simplicity, however, the PWE in the sand was used for all plots. As a result, the till appears to have
an excess pore pressure of 5 ft. rather than it's true value
of zero (Figure 4-8, P 11)
Readings at Sta. 245 were not made for the entire con-struction period. All of these piezometers consisted of Geonor M206, single-lead, bronze-point hydraulic piezometers. These appear to be fairly reliable, although they are slightly more erratic (+ 2 ft. of head) than the more sophisticated types at Sta. 246. The limited data available for Sta. 245 indicate that at the center of the clay there was essentially no pore pressure dissipation between Stages 1 and 2.
The M.I.T. piezometers at Sta. 246 consisted of two types: Geonor vibrating wire electric piezometers at 30'L, and two-lead, porous-plastic point hydraulic piezometers else-where. Although a reliability analysis has been performed by Wolfskill and Soydemir (1971), an up-dated review is advisable. At Sta. 246, the electric piezometers produced consistent
data (+ 0.5 ft. of head) but only short-term reliability (only 33%, or 2 of 6, were operating at CD 2053). The hydraulic
type generally showed the same degree of consistency, but better long-term reliability (52%, or 16 of 31 installed were operating reliably at CD 2053).
For comparison with predicted values (using FEECON), maximum measured"excess heads were taken as the peak values at the end of Stage 2 filling plus the increase due to Stage 3 filling. It was necessary to estimate excess heads for the inoperative piezometers. For these, an estimated excess head vs. time curve was drawn based on operating piezometers
whose locations indicated a similar performance. The results are shown as dashed lines in the Figures.
The maximum"measured" excess heads are tabulated in Table 4-1. In addition, representative piezometer and well data are tabulated in Appendix A-5. The vertical distribution of excess pressure vs. time is discussed in Chapter 7.
4.4 HORIZONTAL DEFLECTION
No inclinometers were installed with the preconstruc-tion instrumentapreconstruc-tion (Sta. 245), but 6 were installed at Sta.
246. Of these, 5 inclinometers between the centerline and 225'R were read by M.I.T.. The instruments were 3 in. in dia-meter grooved aluminium casings in 5 ft. sections connected by flexible couplings permitting 6 in. of vertical movement.
Figure 4-15 presents standard plots of horizontal de-flection vs. elevation at the end of construction (CD 620) and
several times afterward. It was desired to study the horizon-tal deflections versus time for all depthswithin the clay. Normal methods of portraying inclinometer data do not permit this where deflections are relatively small (as at the MIT-MDPW Test Section). Therefore, the horizontal deflection at various elevations are plotted vs. time (log scale) in Fig-ures 4-16 to 4-19. Data from the centerline inclinometer
(I-2) are not plotted. It indicated a maximum of only 0.8 inches at the end of loading, indicating slightly asymmetri-cal loading
The inclinometer data are somewhat erratic, but not abnormally so (+ 0.5 in.) in view of the great depth of clay and relatively small deflections. The most erratic data, be-tween CD600 and CD900 and after CD1700, are probably due to the interchangeable use of several different Wilson torpedoes. Converely, the most consistent data, between CD1300 and CD 1700, were obtained with the M.I.T. automatic recording
in-strument "Beaver" (Bromwell et. al., 1971).
The data show that the greatest rate of deflection oc-curs during filling operations. Atthe end of the filling
there is a slower but constant rate of outward creep (related to log time). Generally, after the end of filling the slopes
of the deflection-time curvesbetween El. -10 and El. -70 (OC
zone) are approximately parallel. This indicates that there is no creep in this zone, and all outward creep is due to the
normally-consolidated clay between El. -70 and El. -145. A study of the differential creep (analogous to the differen-tial settlement) was not undertaken for this report.
The fact that there is no consistently varying break in the deflection-time curve (with location in the clay) suports the assumption that horizontal deflection is not a consolidation-related phenomena. The maximum deflection occurs beneath the embankment slope ( I-4, 95'R.) rather than at the toe as one might expect.
The inclinometer data are tabulated in Appendix A-6. Elevations were based on the average of the casing elevations at the first and latest readings.
4.5 INTERNAL EMBANKMENT STRESS
When the fill elevation reached +20 ft., three clusters of stress cells were installed in circular pits excavated to El. +17. The clusters were placed at the centerline, 30 ft. R, and 60 ft. R. Each cluster consisted of three Geonor P-100 vi-brating wire total stress cells. The datails of this opera-tion and the results are presented in Wolfskill and Soydemir
(1971). Excellent agreement with embankment stresses predicted
by Perloff's method (Perloff, et. al., 1970) was achieved
with the fill El. at +40. The data agree with total vertical stress based on the weight of the overlying fill for the cen-terline and 60'R and is 85% of that value at 30'.
14J tO Lo ~4i 1 ,4 tO) Lu
,=Ro? o- - f T. 0 4-0 /SD / 50 2S'O
". I . ... X
.... s I ... '
' '"' ' I '.'.'. f
r SS,
~czar
SR-7
C4 III
!
---
|
I| -
{
-t
L ATERAL
E-AsIREl
fls7Rfssur7c2m
OF
/t771.
M/EN0r
47 It 4o0
,4 -20 a A /,0 2.0 14 3.0ToP oF SAND (STTLr4ENr PLArFO"S)
rToP oF 4LAy (SErTIaNT RoDS')
1.
. I . , I . . .. . . I t jI
d/oI
T/M - -C O IS T/ UOC 7 A/ b
AYS
/00 /0 200oo 300 00o 60 I I I 'I A A A.
Ii^:
, I i A A A& i X A X X I X X X i 'C 'C A s4Z X 'C 4 a X41C A A AXI
.
A A A X X s5A 3 I75RI I MAXSqI'
I
f20- i i I IC PEATFILL
I
9-2
6SErE5E
57A.
AE,2SUR9
2'5,Fi=/IVA L -- ,O RF/,L Z-P/£1. Z - / ,SAIx
Ago
x 43 CLAY ~ (e -70OX 5Ag>tXC4
/C
CLAY 1~ - /Y5 TI L 5H4LE 0- ss 95'j. /0 50 0 o,09 0,0 k Lk
LU 0,0 a,o3 0./o *LY6 f30 ! '4 "4 4-/OF/'GRE
I ~ ~ ~ ~ ~ ~ ~~d ~ ~ I~~~~~~~~~~~~~~~~~~~~~~~~~~~~~~~~~~~~~~~~~~~~~ --. l rTI _r _ * T , T I I i I I · I i -- F I I I- II i 4 . I (o4 I I --- iIII v
i,.,I
I I I I I I ITIME
-
C OM$
5RCTO1
DAYS
F/MA L PRO FIL E 4o .A36 L4 rILL L' IIq F0/L T 0 SPI SAAIS-/0 vAX 5b
x SRI K o oS2 aC CM4 Y a S3 -70 SR. S5
TILL V/_,A )"
v R -1,- f~ TI .L - (/6 SHALE9-3
MEASURED SrrELEMENw,
JrA. 2C
k K 14
k
k,
K1o
?/W/v~L-/,LL Z-o ,,*· ,P-R ~AND -/0 A/Vto vT $ SOR 7. R7 AC CLAY S' , SR 11
*
CAy
v SRA2 -/IL IL L -/1,$ .S/4LEFI/GJRE
'-Y
MCA.StRED
srLgE
T4,
zq&, Aoc'.
TI/ME - CON S7RUe C /CV DA
Ys
,
)4
k
'I'K
rT/M />AY- co1Vs r? uc r/ A
200o 300 AoD o w /000 5'oo 2oo 3000
F/NA L
+
3F
cz ,
//.L ffr +9 ~ PAI/t Z 0 ~.
SP/ -/o x SRI o0 SRZ cC C LAY ri SR'3-70 , , s/
No CLAY v 6 -i / T/LL -5HR4LF/(I/R
- 5
D/FFRE
Ar/AL SE
rTZl1MEV
st-A.26
,
IL L ',1 I ~Jk tz N KA
T/ E - CO / ATRIUC
rC A/
300o ao 0o 10 oo /500 2000 3o00 F/A/A L PROFILEz=/
L
z.rs
$
"*1,9
o . sP3 -/o 4N x s 7 o 8 CL A7
-78 / A/C CLA '7--
Z
-/63-SW4L F a SR9 A S1 v Tf 12PIGIRE
9-6
D/FPPFERENr/AL
S
rrz
EAi;
St 4.Z6,
4
9c
',2oo k (.1 'I q -41 '-4 '-4 "I Lk I
TIMtM (OSTrRUCTION DYS5) 40 50 E.L-7 a"
(Pi
B E L oWv EL- 170 ( te 100 150 200 250o 3O 350 AS5U KE D H y D o 5TATI c) P2 · o oi°°ooo-o
0I A5v5UILA D , c ---I¥D D R-fTAT (c) X X , . *. I · 4 e e~~~~~~~~~~~J A5SSUMED y P'ROSTATi ) IC.O' E.L-10 0 ILL I 0 0 o P3 _ 3 _ 0o0 00PIT
,r'
X I' ,x IbdR FILL m 4, FILL r FILL I pi aI ,,No IPL P2 o o P5oc
c~,y
C. .4 P3 x 4C C L AY T1LLEAC-ES5 Toled 5
TL.
245
t 'so'
) 3C 20 10 P-L D di
I
il 20 10 0 30 20 10 0 +Yo PL U. I J VI -J+20
+ 10 0 I I I I I I I I I I I · -W I - I eJ T I . --- (! I . . I . . _ . . . . T . . I .I_ 30 7 I - x X x Ix %Lx. .I . I / rs, . I% i I i i I I 1 P5 0 a a-,, 0 . I 0 I ii i i i i I I i Ii i I ; - I , , iI i i -.. . -. 4 V. I1--ILc p k-di .t -.
FI(GURE
'/-8
ExcESS
P5 P(, 6A P7 P8, SA Pq PlOIOA PL(HEAD
)
r-A..
Z4
.C_TI
-
(CO'l5TUcTIot
DY5)
55 50 40 1.o to 0 V:-LI
4 lU :l dI FINA L PRO FIL E ft I.L D Fi-L L FILL x 5Ao4 ac C LA, x) PIGo ~ -7o 4 C HE., c&Y {L~ oP18 * Pl - is5 -Ir LL 2c0
+to
LI-l -IJ
uJJ
.L 1 +o7-/E
(colvS7Rcc
rosa
P -
URE
-/
0xc- es
50
30 A YS ) 'JNA L tRo FILE -uFlar
I A/LL r(7
Pe/ k. '4,1) %t k K I 14,q -4 -,, /o 0 30 20 /o 0 -A30 i/0 o Ie Z x Pet3 o Pe" &e
5
. Pe'/ x~45 TIC NCLA (Ld - '*A T1I Lt: Ao,
rA.. 24 o, 30 .,
-Z2To,
(coN
TUCTON
'
o
AY,
)
200 300 400 oo i o o t zo0o0oFINAL
PROF/I ,e
.3-t F ILLlC +q r-IL1L I O -10' Po
oc o P21 CLAY A 2. -70 CL- o2.4(-IL5
TILLFI lcURE -/ E XCE 55 HD
5T
2
Lo'f.
I I I I I I I I 0~~0 lo 6 01 e 0i 0 6F O 10 I I I I, II i ' . I .~ . . 0 I 40 50 20 I 10 I 4 o , o
I
0 20 0 O !,1. I -J -JJ
.L -W YO0 ITIA
(`OT2T-uCrT
C\)S DA-§) S3C- 400 500 I I o1000 I I I 1$v0 200Q P27 , C . X iP 4 Xf xx P e. 8a t ! i~~~~~~~~~~~~~~~~~~~~~~~~~~~~~~~~~~ xl D _ I^~~~~~~~~~~~~~I i ii
d'
Lpo
-oeco
2
-.5
.-',
VI
j
3 o I6 D C 031 -) V o --- _ I CI o ' CI o0' C' CI 3 CCI 0 V 0 I I i , a I I II F/I/A L PROFIL E +, F Lu IC - Ft LL I 0OAS
eAN 0 -1o 'P25 oc PG CLAy .PZ7 NC, -10+5CL o p2 T IL.L-12
CE5t
'0 w Lo AP,o./E F~- 10 10 0 U_ I D UjI Of X) ~J I- fL-O\V -, +0 20 -t1-fO ~2'3
4 20 4- 10 F~LI I~FIL
Lr
'
^ II T R, i1/~~~~~~~~~~~~~~~~~~~~~~~~~~~~~~~~~~~
t . . I , , · I ... d "" ' , I -· l . I I II I I I I II I I - - -20 I -i III i L_ M i i i I . . I . . I I I I I-C(
ELD
-T Zylo '15'F
FI~UP-E
TINtA (cO Tr-CuTOlf4 DY) 300 coo 5 .&IoVE EL -70 3E LOW 0 feL -7O 0° 0o0 oo l.___: P30 ,C _K _ K0 E i -
~K
C 'I P . 0. 0 o , i 2.1 P31 150O0 3oo00o 1 w ' I', . KCcA 1 'I.E. L 'Cl~~~~~~
i~~~~~~
; ~~~~i 00clb * 00 I6 _FI/AL
PRoF1L.E
.,.5-
0
5ANDz -10 oc CLAY x p30(
-o
-' NC cLAy o P31 -I45 TLL-FI LURE *9-/3 '>T 24& 58 )0 40 30 20 V-IL D hi 'U d0
40 30 100
P-IJ
IL a)u I t ·, , . · _ ; _ _ _ I I I I I x I wso
-- --il .I ·oTI aE (CONSTaUcTiOQ DAy5)
%4oo 50a 1000 150Q ioo -Q,
PRF/AL
FJIoF7LE 45 ~±. 911 -Ic · "C NC CLA-1- q5L T LFiURE
Y//
EXCE5g pl:)
_A
Zf(
225' R
oo 00oo 20 2o I I I I A130VE ~L. '7O P3Z fEL -7 p3 , s! s o° ° ° ° ,o Lo -~~~~~~~~~~~~~~~~~~~~~~~~~~~~~~~~~~~~~~~~~~~~~~~~~~~~~~~~~~ °° ~~~ ~~~ ~~~ ~~~ ~~~ ~~~ ~~~ ~~~ ~~~ ~~~ ~~~ ~~~~~~~~~~~~~~~~~~~~~~~~~~~~~~~~~~~~~~~~~~ : ° ,t ° i°' °o 0 40o C
1
U]I
'0 ) u 20 (O0
+t40 -il +'50 j +20 -L 1 t~~~~~~~~~~~ I i X I l l · I i i i i i I i -I I I'I) 14] j 1 N 1-4 Ii
t
0
NE
L4i
IL L4 Q4-4
XQ N i<lt
11% I 4-11 I f I I I I-j _Z -Y -1V01-Z 7-D' kbiz
r-/
m
( coA/S
TRUC
T/cO)
)A
YAS)
26o 300 &ewl o I . ... o e4,-20 .. Q- FL/t1VG o ~ .'*--
.- , I -, o ·IiO
EL2
_
..________
___ _ __I
S t~
!
9
.1~
-_ _
__ _o
-I
,It
I ° - - { H ~ o a'/. -o . . . , I . . . i i f 7 .1., . I, t , , .i i-,F/G
URE
-16
-- 3
1 i- qo / L 6AMD x -/?_0 oc CLAy 1- -70 ANC CLAY -/TIL5L TIL L/1O VEV/WE7
JTA.
24 ,
4, 2. L\ :4;5 _u K, 2.c N t4~ NJ
q
,oc 1-4 'It k 13 N 0 , -500n /-VIo ZIw y-v elr /MC i ( CO z /
7Ruc
7/oV 'AY~ ) 3000 FYVA LpgOF/LE
F-ILL FILL.I-y Fi7ll I-/ , I5Ao -/6 oc C LA Y -70 A/TO cLATfILL.-2o0 300 /o 0 500 /100 /So06 2o0o
LU Lk LU K k3 0 62
T/ME (CO /\V/?MCIroM AYS) Q FI/AA4
PF/OA/l
E
pfO'/ £6~+9
XL Z' O 0 SAi'b -/000
-70 A/C CLAY _P15 %/eL 7C -LYFI/GURE
'-/7r-' MOYIN7
.
51
A.
2¢y
,
k-U
NJ
't
Ir/ME
(C
co'V
ro-Rsrc
7-o
)
F/1tvA L F/LL 0 OC At CLAYTic-/45
r/L LF
G RE -/ 7
(z-
) CON
TD.
64 U) Lw Lb N ti:DA YS
T/, (co'/VdSTpC~ TC/OA/ bAyS)
F/
GURE
Y-/815-S
MOVEMENT
SA.2q, /IG'R.
I-N 0 Lk r1-J 0 :c1 PO/FtLE +5 FP7A 7 o JAN7 -/0 CLAY -70 CLA y
-/¥5
TILL-A l F/7-L I7/ME
(COSTr
C
TfOA/ DAYS )
PROFILe
PEA r o SAND Oc Ny NO CLAY T/IL -70FIGL//RE -/8
r-5
C-O,7TD,
66-t
LI) c0 K) NIk
uN IQTIME (co/v,7RUC/rov
DAY.S )
2 0 300 qfOo 500 _ 000 /600 2oo 304 _ _2 HW
d
/LL/A/f& __ ---- ... ..- --- /- . Xosz-2i
'"'-
...
...
_ _.
H
- -9----
J-
I --I -~~~~~~~~~~~~~~~~~~~~~~~~~~~A
F/LU
___
_
.
- ... -. t--...
I--
. . . ...-I~~~~~~~~~~~~
_ _i
H
... .~ J.L.L... O LE PROFILE?AT
-SAAIP /0 CZAY CLAY/5
-70 7FILLFI
G(RE
-/?
Z--G
MO
VMENT, SrA. 2.q6, 2ZZ5'R.
G.e .e 2.0 0 6.0 I # 4 2.~ 0 0 I N 2.0 0 6.0 4.0 2.0 0
7-l/M1E (CO1VS TP/C T// ,A DAYS)
PROFIL
E
PEA " 0 SAb -/O oC CLAY //C -X85 TILAL TILL .-) %.4 1 ,,j ci L~ CO/VT '. 68F/cu/QE
L19 Z-C_5. PARAMETERS FOR UNDRAINED DEFORMATION AND
STRESS FINITE ELEMENT ANALYSIS
5.1 GENERAL
The finite element program FEECON, described in de-tail elsewhere, (Simon, 1972, Simon et. al., 1972) was used to analyze the undrained behavior of the embankment. This program is exceptionally versatile. It permits the use of several stress-strain relationships including bilinear, hyperbolic, axial stress-strain or shear stress-strain. Ani-sotropic strengths can be specified for cohesive materials, and initial shear stress can be accounted for.
For analysis of the Test Section, hyperbolic stress-strain relationships were used for both granular and cohe-sive soils. FEECON uses the incremental method in hyperbol-ic stress-strain models as shown in Figure 5-1. At the begin-ning of each load increment, the modulus is set equal to the value of the tangent to the true stress-strain curve
corre-sponding to the existing stress level. It is therefore neces-sary to use small load increments. Nine increments were used for the Test Section analysis. The finite element mesh is shown in Figure 5-2.
5.2 GRANULAR SOILS
used for the granular soils (fill and natural sand). This relation is based on work done by Duncan and his associates
(at the University of California, Berkeley) with Kondner's original suggestions (Simon, 1972). This stress-strain model is discussed in detail elsewhere (Duncan and Chang, 1970,
Simon 1972).
The initial Young's modulus, Ei, is determined em-pirically and is related to the minor principal stress by Janbu's formula:
n
Ei = K ( n )
where K is a dimensionless empirical modulus number, Pa is the atmospheric pressure in proper units, 3 is the minor principal stress and n is a dimensionless empirical exponent.
In addition, the tangent Young's modulus is related
to the principal stresses by:
Et = [ 1 Rf (1- sinf)(1-73) 2 Ei
2 c cos + 23 sinT
where c and are the Mohr-Coulomb strength parameters; Rf is the failure ratio, equal to the ratio between the compres-sive strength ( - 3)F and asymptotic stress difference
for the hyperbolic stress-strain curve; and
W3
are the major and minor principal stresses, respectively.FEECON also accounts for the stress and strain depen-dency of the initial and tangent Poisson's rations (viandvt). The initial Poisson's ratio is represented by the equation: