HAL Id: hal-01353962
https://hal.inria.fr/hal-01353962v2
Submitted on 17 Jul 2018
HAL is a multi-disciplinary open access
archive for the deposit and dissemination of
sci-entific research documents, whether they are
pub-lished or not. The documents may come from
teaching and research institutions in France or
abroad, or from public or private research centers.
L’archive ouverte pluridisciplinaire HAL, est
destinée au dépôt et à la diffusion de documents
scientifiques de niveau recherche, publiés ou non,
émanant des établissements d’enseignement et de
recherche français ou étrangers, des laboratoires
publics ou privés.
Analyzing Dynamic Task-Based Applications on Hybrid
Platforms: An Agile Scripting Approach
Vinicius Garcia Pinto, Luka Stanisic, Arnaud Legrand, Lucas Mello Schnorr,
Samuel Thibault, Vincent Danjean
To cite this version:
Vinicius Garcia Pinto, Luka Stanisic, Arnaud Legrand, Lucas Mello Schnorr, Samuel Thibault, et
al.. Analyzing Dynamic Task-Based Applications on Hybrid Platforms: An Agile Scripting Approach.
VPA 2016 - 3rd Workshop on Visual Performance Analysis, Nov 2016, Salt Lake City, United States.
pp.17-24, �10.1109/VPA.2016.008�. �hal-01353962v2�
Analyzing Dynamic Task-Based Applications on
Hybrid Platforms: An Agile Scripting Approach
Vinícius Garcia Pinto
∗‡, Luka Stanisic
†, Arnaud Legrand
‡,
Lucas Mello Schnorr
∗, Samuel Thibault
†, Vincent Danjean
‡∗ Institute of Informatics, Federal University of Rio Grande do Sul – UFRGS, Porto Alegre, Brazil
†Inria Bordeaux Sud-Ouest, France ‡CNRS – Univ. Grenoble Alpes, France
Abstract—In this paper, we present visual analysis techniques to evaluate the performance of HPC task-based applications on hybrid architectures. Our approach is based on composing mod-ern data analysis tools (pjdump, R, ggplot2, plotly), enabling an agile and flexible scripting framework with minor development cost. We validate our proposal by analyzing traces from the full-fledged implementation of the Cholesky decomposition available in the MORSE library running on a hybrid (CPU/GPU) plat-form. The analysis compares two different workloads and three different task schedulers from the StarPU runtime system. Our analysis based on composite views allows to identify allocation mistakes, priority problems in scheduling decisions, GPU tasks anomalies causing bad performance, and critical path issues.
I. INTRODUCTION
To fulfill the ever-growing need for computation power of High-Performance Computing (HPC) applications, it has become common to rely on hybrid nodes, composed of multi-core processors (CPUs) with multiple accelerators (GPUs). However, due to the heterogeneity and complexity of such machines, achieving portable and scalable performance has become extremely challenging. A possible solution, increas-ingly used by the community, is to program the application at a high level, independently of the hardware architecture, as a Directed Acyclic Graph (DAG) of tasks. It is then the responsibility of another software layer, called the runtime, to dynamically schedule the resulting tasks on the different computing resources taking into account the possible speed heterogeneity and variability as well as to automatically take care of data movements between resources. This allows re-moving artificial synchronizations from the application code, implementing complex scheduling and data movement algo-rithms (such as HEFT [1]) that would be hard to manually incorporate in the application. Thanks to dynamic decisions, the irregular behavior of applications and resources is absorbed and exploited by the scheduler during execution, effectively balancing the load among computing resources.
Task-based executions on hybrid platforms are inherently stochastic. Task mapping, for instance, can drastically change from one execution to another. From the performance anal-ysis perspective, the nature of such opportunistic execution schemes makes classical performance analysis, which expects regularity and highlights heterogeneity, invariably ineffective. At the same time, application and runtime developers seek to understand the attained performance to improve the appli-cation design and scheduling decisions. This investigation is
challenging because it is hard to compare many traces when parameters affecting task creation and scheduling change.
In this article, we explain how we designed a framework that enables an easy and faithful identification of subtle scheduling problems that would otherwise go unnoticed and misunder-stood with classical trace visualization approaches. We built
the framework1on top of modern data analytics tools,
combin-ing the R programmcombin-ing language (and in particular the ggplot2 library) and org-mode [2]. The tool combination comes at a very low development cost when compared to a traditional and monolithic performance visualization tool. The designed views depict task execution along time for each resource, automati-cally detecting several interleaving critical paths in traces. We demonstrate the effectiveness of our visualization approach by analyzing traces from the dense linear algebra Cholesky factorization of the Chameleon/MORSE package [3], imple-mented using the StarPU task-based runtime [4]. Two repre-sentative factorization workloads are carried out on a hybrid multi-core/multi-GPU architecture. The large workload brings interesting insights on pinpointing resource usage mistakes and comparing three StarPU schedulers (DMDA, DMDAS and Work Stealing). The smaller workload shows that the dynamic critical path analysis provides hints for optimizations.
Section II provides some background on task-based run-times for hybrid platforms and on the Cholesky algorithm. Section III presents some related work on trace visualization, motivating our own study. Section IV presents our trace visualization proposal for the performance analysis of task-based runtimes. In Section V we detail two case studies demonstrating the effectiveness of our visualization strategy. Section VI gives a summary of results and future work.
II. BACKGROUND ANDEXPERIMENTALCONTEXT
Traditional bulk-synchronous parallel (BSP) applications, made of supersteps (computation, communication, barrier), is a very common design when computing resources are homo-geneous. The trend towards heterogeneous resources with ac-celerators, such as GPUs, makes the task-based programming paradigm much more suitable. Depending on the sophistication of the runtime scheduling algorithms, applications can more or less efficiently exploit heterogeneous configurations.
Several runtimes targeting hybrid platforms have been de-veloped in the recent years. MAGMA [5], for instance,
bines multi-core with GPUs for linear algebra applications. OmpSs [6] provides an extension to OpenMP tasks through new directives that allow supporting multi-core systems com-bined with GPUs. PaRSEC [7] is a generic framework for architecture aware scheduling of tasks on many-core heteroge-neous clusters. StarPU [4] is a task parallelism runtime initially designed to exploit hybrid architectures and additionally pro-viding an MPI-based extension [8] to exploit several nodes at once. Dense/sparse linear algebra have been among the first applications to exploit such runtimes but other applications have been also implemented, such as FEM applications [9], seismic wave modeling [10], and others [11], [12].
Experimental Context and Workload Details: We propose to
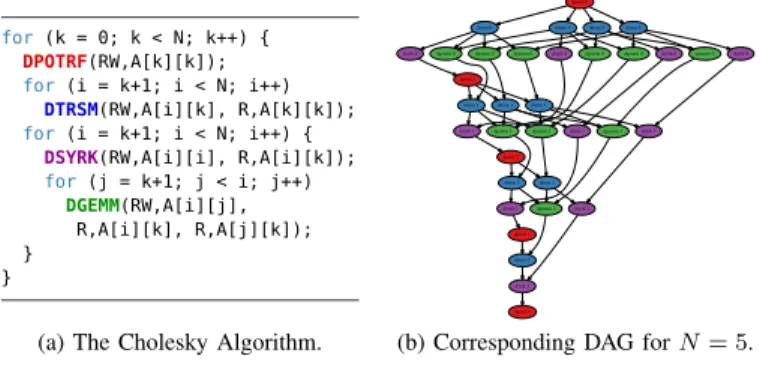
build on a relatively representative use case to address the lack of adequate visualization tools for task-based applications. We use traces of the dense linear algebra Cholesky factorization, more specifically of the full-fledged implementation from the MORSE library [3], compiled with the CUBLAS kernels. A simplified version of this application is shown in Figure 1a; and the corresponding DAG for a 5 × 5 matrix size is shown on its right (Figure 1b). For each step k of the outer loop, one
dpotrf task releases N −k dtrsm and dsyrk tasks, followed
by ≈(N −k)2/2 dgemm tasks. The dependencies indicate that
simultaneous execution of several iterations is possible and that the iteration size decreases at the same time as k increases. So, the potential parallelism gets reduced as the algorithm advances (see the DAG of the figure). Finally, the task’s
execution time highly depends on the task (dpotrf, dtrsm,
dsyrk, anddgemm) and resource types (CPU or GPU). We have
used the CUBLAS without the dpotrf code. Hence, dpotrf
tasks can only be run on CPUs.
for (k = 0; k < N; k++) { DPOTRF(RW,A[k][k]); for (i = k+1; i < N; i++) DTRSM(RW,A[i][k], R,A[k][k]); for (i = k+1; i < N; i++) { DSYRK(RW,A[i][i], R,A[i][k]); for(j = k+1; j < i; j++) DGEMM(RW,A[i][j], R,A[i][k], R,A[j][k]); } }
(a) The Cholesky Algorithm.
dpotrf 0
dtrsm 0 dtrsm 0 dtrsm 0 dtrsm 0
dsyrk 0 dgemm 0 dgemm 0 dgemm 0 dsyrk 0 dgemm 0 dgemm 0 dsyrk 0 dgemm 0 dsyrk 0
dpotrf 1
dtrsm 1 dtrsm 1 dtrsm 1
dsyrk 1 dgemm 1 dgemm 1 dsyrk 1 dgemm 1 dsyrk 1
dpotrf 2
dtrsm 2 dtrsm 2
dsyrk 2 dgemm 2 dsyrk 2
dpotrf 3
dtrsm 3
dsyrk 3
dpotrf 4
(b) Corresponding DAG for N = 5. Fig. 1: The Cholesky code and its DAG (for N = 5). Since hybrid heterogeneous nodes motivate the development of task-based runtimes, we execute this Cholesky imple-mentation on IdCin2, a machine with two 14-core Intel(R) Xeon(R) CPU [email protected] and three NVIDIA Titan X. From this set of resources, only 25 CPU cores participate in the computation because it is generally more efficient to let StarPU dedicate one core to manage each GPU. StarPU provides several scheduling algorithms that exploit both the DAG structure (through critical-path based heuristics) and performance models. Here, we focus on three of them.
The DMDA (Deque Model Data Aware) scheduler is a list scheduler, i.e., every time a resource is idle, if a task is ready, it will be scheduled on this particular resource.
Such a scheduler therefore never leaves a resource idle on purpose, which ensures the well-known (2 − 1/p) competitive ratio for homogeneous machines [13]. Deciding which ready task to select has a major influence in practice and the classical heuristic consists of prioritizing tasks based on the critical path. However, the critical path notion is dynamic and obtaining a proper estimation can be quite challenging. With heterogeneous computing resources, such prioritization is generally done with variants of the HEFT (Heterogeneous Earliest Finish Time) strategy [1]. The DMDA algorithm is a very greedy heuristic that schedules tasks in the order they become available, without taking critical path priorities into account. However, it considers data transfer time between CPUs and GPUs as well as the relative performance of resources on each computation kernel when taking its decision. The DMDAS (Deque Model Data Aware Sorted) scheduler is similar to the first strategy, except that it sorts tasks by priority, which can be expensive when the number of tasks is large. It is therefore rather close to the original HEFT algorithm by respecting priorities and taking past scheduling decisions into account. Finally, the WS (Work Stealing) scheduler uses a queue per worker; new tasks are kept local by default. When a worker is idle, it steals tasks from the most loaded worker. The next section presents related work on performance analysis for BSP and DAG-based HPC programming models. We detail the issues of current solutions, motivating our work.
III. RELATEDWORK ANDMOTIVATION
Despite the plethora of runtimes to execute task-based applications on heterogeneous resources (see Section II), there are very few established tools to conduct a proper task-aware analysis. Developers usually rely on BSP-based trace visualization tools, whose objectives are different, seeking un-expected heterogeneity where regular, homogeneous behavior is normal. Such tools are therefore unsuitable for visualizing task execution behavior since heterogeneity is the expected scenario for task-based applications. We briefly detail trace visualization strategies for BSP and DAG-based applications to better understand their differences. We also describe the design challenges of novel trace visualization techniques for DAG applications, as well as the typical questions usually raised during the analysis process.
A. Trace visualization analysis for BSP-based applications Many tools exist to visualize traces from BSP-based appli-cations. Most are focused on MPI appliappli-cations. The common technique is based on Gantt charts, depicting each thread be-havior along time. Bebe-havior is drawn using colors to represent different thread states e.g., MPI operation. Message-passing is depicted with arrows from source to destination, sometimes annotated with the amount of transferred data. Vite [14] is an OpenGL-based open-source tool that has such a view, capable to visualize large traces with thread states and communication. Since this tool relies on the semantic-free Paje language [15], it can depict virtually any kind of traces. Paraver [16] is another open-source Gantt tool that allows filtering, zooming,
and graphical trace aggregation. Its trace format supports many HPC programming models. Vampir [17] is a proprietary tool with multiple views for OTF2 traces. It is more scalable than similar tools due to its distributed organization.
B. Visualizing task execution traces from DAG applications There are a few tools to perform analysis and visualiza-tion of task-based execuvisualiza-tions. Typically, they are built with resources not designed for data analysis and rely on either non-scalable or non-scriptable strategies i.e., with mouse pointer interaction. DAGViz [18] offers a visual representation of task-based executions focusing on the DAG structure, which is retrieved using macros (translated to Cilk, Intel TBB or OpenMP) and presented in a hierarchical way. The resulting DAG can be folded/unfolded on-demand to show details and the node color indicates where they are executed. There is no way to retrieve the time dimension and task duration, which can make performance analysis difficult. Temanejo [19] pro-vides a similar timeless DAG interactive views for many task-based runtimes. Its main features are the debug capabilities, e.g. the user can put a breakpoint in a task and fix its depen-dencies. These capabilities are very useful during algorithm design on small scale, being unsuited for performance analysis Haugen et al. proposes an interactive Gantt chart enhanced with dependencies, drawn as edges between tasks [20]. We believe this approach suffers from three issues. First, in term of scalability, since (e.g., in Cholesky) tasks typically have many
(≈N) dependencies, drawing everything and finding interesting
tasks and dependencies only through mouse interaction can be very tedious. In practice, only tasks belonging to the critical path are important. Second, only one-level dependencies are depicted, while several levels are required to understand the history leading to the scheduling problem. Third, this tool does not really exploit the heterogeneity of resources.
C. Challenges of DAG execution traces analysis
The performance analysis of task-based applications raises many challenges. The stochastic behavior of scheduling deci-sions induced by actual resource availability and by the task execution variability hinders the performance reproducibility. Moreover, executions are apparently unstructured, with no clear phases as in the BSP model. At the same time, task de-pendencies are part of the application and should be exploited by the analyst to understand bottlenecks.
Traces are generally much larger than the available screen space and naively displaying everything generally leads to biased views [21]. One, therefore, has to use selection schemes to show only data that is fully relevant from the analysis point of view. In such complex execution traces, many hypotheses (and thus filters) can be proposed regarding the expected be-havior. Developing a monolithic tool, such as the ones tailored for BSP analysis, that anticipates all possible performance problems is thus impractical. Moreover, such tool would be quite difficult to maintain and customize. A more flexible solution with scripting capability is thus needed.
During the analysis of DAG traces, the typical questions that arise are different from those of BSP applications. Instead of inspecting whether and why a certain algorithm iteration or phase was slowed down, one needs to analyze if the tasks were properly scheduled and if sufficient parallelism is available. One also needs to examine whether complex data movement techniques, task submission, and many internal runtime mechanisms can be further improved.
A common approach to better understand the application behavior is to compare several execution traces, possibly each one with a different configuration (e.g., scheduling parameter). However, due to the dynamic scheduling, this is generally difficult for task-based traces. To draw relevant conclusions, one needs to synchronize multiple visualizations and filter the unwanted states. Although some support exists in some tools [16], [22], they do not offer enough customization flexibility for such studies.
The next section details our proposal to visualize task-based application traces. It tackles some of the preceding challenges with a framework that combines data analytics tools to create a flexible environment enabling customized analysis.
IV. VISUALIZATIONMETHODOLOGY
Visualizing data allows to graphically check many assump-tions at once. It helps with assumpassump-tions that are difficult to formally state or for which defining a proper statistical test would require building on even more hypothesis that would also have to be verified. This is why it is important to start by listing various hypothesis (or expectations) made on the system under study. From such list, a set of visualizations can be generated. We propose visualizations that are designed for the application and scheduler developers, assisting them to rapidly identify performance issues as well as potential solutions.
The set of hypothesis to check is fairly rich in heterogeneous platforms targeted by task-based runtime systems. It is thus important to build a visualization framework that allows to easily and rapidly combine various views and propose new alternative views in an agile way. Moreover, since dynamic scheduling and machine heterogeneity bring a lot of variabili-ties, the ideal visualization should exploit any potential regu-larity coming from the application algorithm. For example, as we have seen in Figure 1, each task can be identified by the loop indices i, j, k. Such kind of information is much more useful than the internal runtime task identification and should thus be provided by the application to the runtime so that it can be traced and further exploited during the visualization.
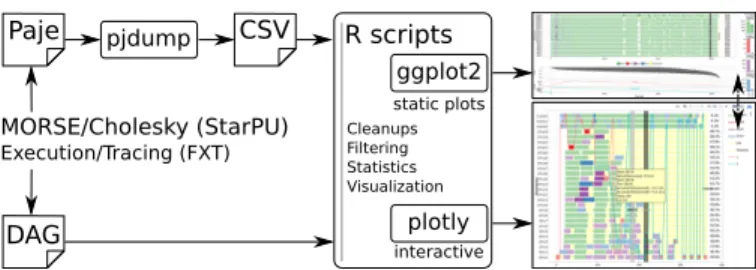
To meet these different design goals, we decided to use the workflow shown in Figure 2. With few modifications on MORSE, tracing is extended to tag tasks with loop indexes at the task creation. StarPU relies on FXT [23] traces to produce timestamped events in the Paje language [15]. A complete DAG is also created with task identifiers coherent with the Paje trace. Instead of building a complex monolithic tool, we follow the UNIX philosophy and script many small tools. Using
pjdump, the paje trace is converted into a Comma-Separated
expressiveness and to the rich set of statistical libraries of the
R language, many cleanups, filtering, statistic computations,
and adaptation to another application than Cholesky can be
done with few lines of code. The ggplot library provides a
grammar of graphics and a very high-level way of building plots, enabling us to easily produce custom visualizations. This environment has enough expressiveness to guarantee different but coherent views (colors, scales, etc.).
R scripts ggplot2 plotly static plots interactive Cleanups Filtering Statistics Visualization MORSE/Cholesky (StarPU) Execution/Tracing (FXT) DAG pjdump Paje CSV
Fig. 2: Combining data analytics tools to create trace views. This approach allows building static views in a fully au-tomatic and very efficient way. Although such visualizations could probably be sped up even further by programming everything in C/C++, the used libraries are already well optimized and benefit from the know-how of data analysts. Furthermore, a combination of small scripts is both easier to maintain and adapt to a new necessity or to a particular situation than a rigid monolithic visualization environment.
The static views (typically basic X11 window or a PDF) of our approach have disadvantages when compared to tools described in Section III. Interaction is often crucial for the analyst to find what he is looking for. This is why we also build
onplotly, an online analytics tool, that enables the quick
con-version of ggplots into interactive, online graphs usable with a classical web browser (see https://plot.ly/ggplot2/ for more details). Two illustrations in this article are also available in an interactive version. We strongly believe that putting interaction at the very end together with the scripting capabilities in the core of the analysis process is the key to carrying out the analysis of complex execution traces.
Finally, loading and merging several traces enables faithful comparisons and even produces perfectly aligned and coherent views. Since execution traces are stochastic in nature, we believe that side by side representations are essential to decide whether a phenomenon is important/recurrent or it is an unlucky situation and can be considered as the execution noise.
V. EXPERIMENTALVALIDATION ANDRESULTS
When dynamically scheduling task-based applications, the kind of question to answer is totally different whenever the resulting DAG is large or small. Large DAGs are expected to be embarrassingly parallel, almost reaching peak performance. Since such DAGs have many tasks, one need to use macro-scopic views and indicators to understand how performance can be improved. Small DAGs, on the other hand, have little parallelism. Idle time will inevitably be incurred by task dependencies. For such executions, microscopic views with fine-grained data on task dependencies should rather be used.
We fully analyze two very different Cholesky workloads in the rest of this paper: large (60×60 tiles of size 960×960) and small matrices (12 × 12 tiles, same size). For each, we detail the expected behavior, then propose composite views allowing to check these expectations. The views are then exploited to compare the three aforementioned StarPU schedulers, enabling us to propose potential improvements.
A. Large Workload (Cholesky of60×60 tiles of size 960×960)
1) Expectations: Uniformity. Task duration is expected to
depend solely on their type (dgemm,dsyrk,dtrsm ordpotrf)
and on the type of resource (CPU or GPU) on which it is executed. Such assumption should be visually verified, high-lighting all tasks whose duration is abnormally large compared to the others of the same type/resource. We treat these tasks as independent outliers, unrelated to other tasks behavior. If not so, it may mean that the whole platform has been perturbed at particular moments or that some resource differs from the others. A task is anomalous if its duration exceeds the sampled third quartile plus 1.5 times the sampled interquartile range. Although this outlier notion is highly debatable and context-specific, other definitions could be easily incorporated. Dependency problems. Large input matrices generate many tasks, especially when the application starts. We, therefore, want to monitor the number of ready and submitted tasks. For this Cholesky implementation, all tasks are expected to be submitted when the application starts. On scale, the number of task dependencies is extremely large. Automatically selecting which ones to display is haphazard. If a detailed view becomes necessary, we should switch to views described in Section V-B. Progress. The task graph resulting from dense linear algebra always share a common structure (for instance, see Figure 1). In a classical semi-sequential execution, the DAG would be executed much similarly to a breadth-first search. However, it is also possible to carry out a depth-first traversal, favoring task execution on the critical path. Following the pipelining of the sets of tasks submitted by each outer loop iteration can be sufficient to get an overview of how the scheduler is handling the DAG and if it corresponds to the analyst’s intuition or not. Potential improvements. Dependencies are expected to be easily handled with large workloads. The major issue is the load balancing among CPUs and GPUs. Since one knows the
average time wi,k needed to perform a task of type k on a
resource of type i as well as the total number nk of tasks per
type, one can consider that a fraction αi,k of tasks of type k
will be done on resource i and that the αi,kshould thus verify:
∀i :X
k
αi,k.ni,k.wi,k≤ T
Since such constraints are linear it is possible to compute
the optimal makespan T and allocation αi,k. The T value is
called the Area Bound Estimation (ABE) and is a lower bound for the execution time. Another classical lower bound is the Critical Path Bound Estimation (CPE). It is obtained by assigning each task to its faster processing resource and by summing all durations along the DAG. These execution time bounds, in particular, the ABE when the workload is large,
ready 62725 CPE 2149 ABE 59464 0.39% 0.55% 0.63% 0.69% 0.86% 0.96% 1.01% 0.94% 0.96% 0.96% 1.00% 0.89% 0.91% 0.93% 0.99% 0.95% 0.99% 0.95% 0.99% 1.08% 1.02% 1.10% 1.04% 1.04% 1.04% 5.90% 1.90% 2.00% submitted CPU0 CPU1 CPU2 CPU3 CPU4 CPU5 CPU6 CPU7 CPU8 CPU9 CPU10 CPU11 CPU12 CPU13 CPU14 CPU15 CPU16 CPU17 CPU18 CPU19 CPU20 CPU21 CPU22 CPU23 CPU24 CUDA0 CUDA1 CUDA2 0 20 40 60 0 500 1000 0 20000 40000 60000 0 10000 20000 30000 Resources k iter ation
dgemm dpotrf dsyrk dtrsm Idle/Sleeping
0 20000 40000 60000 Time [ms] # tasks dgemm dpotrf dsyrk dtrsm 0 5000 10000 15000 20000 0 20 40 60 0 500 1000 1500 0 500 1000 1500 CPU CUD A # of tasks
Fig. 3: Cholesky factorization of a large (60 × 60 tiles of 960 × 960) matrix with the DMDAS scheduler; five views are referred as indicated on the right. (a) This Gantt chart is automatically augmented with (from left to right), the critical path bound (CPE) and of the area bound estimations (ABE) and the makespan. The time percentage in the Idle state per resource is shown on the right. Finally, tasks whose duration is abnormally large compared to the others are highlighted with a darker color. (b) The plot is composed of horizontal segments, one per iteration k of the outer loop, indicating during which time interval the tasks of the iteration have been processed. (c) depicts how many tasks are finished waiting for dependencies, and thus ready for execution and (d) how many are submitted and still not executed. (e) compares the actual number of tasks of each type executed on CPUs and GPUs (the bar) with the optimal repartition obtained when computing the ABE (the bullet).
(a) (e) (b) (c) (d)
are quite useful to estimate how much further improvement can be expected. More accurate lower bounds [24] could be used as well, in particular for intermediate size workloads. Moreover, an ideal task allocation is also computed when ABE is defined. Comparing the ideal with the actual allocation may help understanding how scheduling could be improved.
2) Composite View for Pinpointing Scheduling Mistakes: Building on the expectations, we propose a five-area composite view shown in Figure 3 (each area is detailed in the caption). We see in Figure 3 (a) that the makespan is 62725ms while the ABE is 59464ms. So, one can hope for a 5% improvement. The scheduling seems indeed inefficient since there are periods (white areas in CPUs) when no useful computation is done. These periods correspond to filtered states (for clarity) where threads try to actively fetch data. The total idle state (yellow areas: a summary in the right of the Gantt) for CPUs is about 1%, while for GPUs it ranges from 2 to 6%. This GPU inactivity is likely the main source of potential improvement. From (c), it is clear that this idle time does not come from a sudden lack of ready tasks. Figure 3 (d) clearly indicates that all tasks have been submitted in the beginning and that task execution started immediately after, without waiting for fully unrolling the DAG. As suggested in (b), DAG traversal is rather depth-first. Many outer loop iterations are parallel (the maximum is 30 around 40s), explaining why there are always a sufficient number of ready tasks.
Such GPUs starvation is more likely explained either by data prefetching problem (some tasks are ready but their input data is not yet transferred to GPUs) or possibly by some priority issue (the priorities, used by the scheduler to choose which task to run first when several of them are ready, might be
inadequate). The first reason is likely to be the right one here. Indeed, most large idle periods on GPUs and large periods of times where CPUs are not doing useful computations (in
white) also coincide with abnormaldgemmtasks (in dark green)
on GPUs. Note that the scripting feature allow us to show only tasks of a given type, resource, within a specific time interval, and whose duration is larger than a threshold and therefore clear any doubt the analyst may have. An investigation (such as the one of Section V-B) reveals that, for an unknown reason, the GPUs seem to freeze during a task execution inside
the proprietary CUBLAS dgemm kernel, ultimately blocking
tasks eagerly waiting for GPU data. Understanding why GPUs sometimes get stuck would certainly solve the issue but this clearly suggests a weakness of the chosen scheduler which assumes that tasks duration have small variability. Using other schedulers may, therefore, alleviate this.
The four plots depicted in Figure 3 (e) show the ideal allo-cation when calculating the ABE. They show how the GPUs
have been overused withdgemmtasks and under-exploited for
dsyrk and dtrsm tasks. It, therefore, suggests constraining
thedsyrk and dtrsmtasks to run exclusively on GPUs. 3) Comparing Scheduling Strategies and Task Constraints: The previous analysis leads us to vary the scheduler (DMDA,
DMDAS, WS) and to force or not thedsyrk/dtrsmallocation
on GPUs. Figure 4 provides the six-scenario comparison. First of all, it is interesting to see how the three schedulers differ in their DAG traversal of the DAG. While the DMDA algorithm has a breadth-first traversal (very few iterations of the outer loop are active at the same time), the DMDAS has a much more depth-first traversal as it takes the priority of the critical path into account. The traversal of the Work
DMDA DMDAS Work Stealing Constrained Unconstrained 66965 CPE 2201 ABE 59748 0.7% 0.9% 1.0% 0.9% 0.9% 1.0% 1.0% 0.8% 1.0% 1.0% 1.0% 0.9% 0.9% 1.0% 1.3% 1.3% 1.2% 1.3% 1.4% 1.4% 1.6% 1.5% 1.6% 1.4% 1.6% 20.6% 20.2% 19.9% 62725 CPE 2149 ABE 59464 0.4% 0.6% 0.6% 0.7% 0.9% 1.0% 1.0% 0.9% 1.0% 1.0% 1.0% 0.9% 0.9% 0.9% 1.0% 1.0% 1.0% 0.9% 1.0% 1.1% 1.0% 1.1% 1.0% 1.0% 1.0% 5.9% 1.9% 2.0% 60987 CPE 2146 ABE 58452 1.1% 1.3% 1.2% 1.3% 1.3% 1.5% 1.4% 1.4% 1.5% 1.5% 1.3% 1.4% 1.2% 1.3% 1.5% 1.5% 1.5% 1.5% 1.4% 1.5% 1.5% 1.5% 1.4% 1.4% 1.5% 4.0% 2.2% 2.2% CPU0 CPU1 CPU2 CPU3 CPU4 CPU5 CPU6 CPU7 CPU8 CPU9 CPU10 CPU11 CPU12 CPU13 CPU14 CPU15 CPU16 CPU17 CPU18 CPU19 CPU20 CPU21 CPU22 CPU23 CPU24 CUDA0 CUDA1 CUDA2 0 20 40 60 0 20000 40000 60000 0 20000 40000 60000 0 20000 40000 60000 0 20000 40000 60000 0 20000 40000 60000 0 20000 40000 60000 Time [ms] Resources k iter ation
dgemm dpotrf dsyrk dtrsm Idle/Sleeping
0 5000 10000 15000 20000 0 20 40 60 0 500 1000 1500 0 500 1000 1500 0 5000 10000 15000 20000 0 20 40 60 0 500 1000 1500 0 500 1000 1500 0 5000 10000 15000 20000 0 20 40 60 0 500 1000 1500 0 500 1000 1500
CPU CUDA CPU CUDA CPU CUDA CPU CUDA CPU CUDA CPU CUDA CPU CUDA CPU CUDA CPU CUDA CPU CUDA CPU CUDA CPU CUDA
# tasks 64061 CPE 2114 ABE 60004 12.5% 12.8% 12.3% 11.6% 13.5% 13.6% 14.6% 14.3% 12.0% 11.6% 11.2%3.2% 2.7% 3.1% 3.7% 3.8% 3.1% 2.6% 3.7% 4.0% 4.1% 3.7% 2.9% 3.9% 3.0% 3.6% 2.2% 2.6% 60174 CPE 2159 ABE 59017 1.0% 0.8% 1.1% 1.3% 1.3% 1.5% 1.5% 1.7% 1.7% 1.8% 1.8% 1.8% 1.9% 2.0% 2.0% 2.1% 2.3% 2.3% 2.3% 2.2% 2.3% 2.3% 2.5% 2.5% 2.4% 2.5% 1.1% 0.9% 59577 CPE 2160 ABE 57603 0.9% 1.3% 0.9% 1.0% 1.0% 0.9% 1.0% 1.1% 0.9% 0.9% 1.0% 1.0% 0.9% 1.1% 1.1% 1.0% 1.2% 1.0% 1.2% 1.0% 1.1% 1.1% 1.2% 0.9% 0.9% 3.2% 1.4% 1.4% CPU0 CPU1 CPU2 CPU3 CPU4 CPU5 CPU6 CPU7 CPU8 CPU9 CPU10 CPU11 CPU12 CPU13 CPU14 CPU15 CPU16 CPU17 CPU18 CPU19 CPU20 CPU21 CPU22 CPU23 CPU24 CUDA0 CUDA1 CUDA2 0 20 40 60 0 20000 40000 60000 0 20000 40000 60000 0 20000 40000 60000 0 20000 40000 60000 0 20000 40000 60000 0 20000 40000 60000 Time [ms] Resources k iter ation
dgemm dpotrf dsyrk dtrsm Idle/Sleeping
0 5000 10000 15000 20000 0 20 40 60 0 500 1000 1500 0 500 1000 1500 0 5000 10000 15000 20000 0 20 40 60 0 500 1000 1500 0 500 1000 1500 0 5000 10000 15000 20000 0 20 40 60 0 500 1000 1500 0 500 1000 1500
CPU CUDA CPU CUDA CPU CUDA CPU CUDA CPU CUDA CPU CUDA CPU CUDA CPU CUDA CPU CUDA CPU CUDA CPU CUDA CPU CUDA
# tasks
Fig. 4: The execution representation of three schedulers (columns), with unconstrained versus constrained dsyrk/dtrsm tasks
on GPUs(rows). Each of the six plots is an instance of the view of Figure 3 (refer to that caption to understand different parts). Stealing (WS) is even more depth-first as almost all outer loop
iterations are still in progress at the end of the execution. Such way of progressing through the DAG is typical of WS and somehow favors local data accesses even though the algorithm is more dependency myopic than the two other ones.
Second, when constraining the dsyrk and dtrsm to run
solely on the GPUs (the plots on the bottom row of Figure 4), task allocation corresponds to the ideal one. However, while such constraint allows both DMDAS and Work Stealing to obtain near optimal executions (within less than 2% of the lower bound), it helped only moderately the DMDA algorithm. Many synchronized idle phases can be observed and imputed to both dependency issues (not enough parallelism is obtained from such a strict breadth-first traversal) and particularly slow tasks (probably slowed down by simultaneous data transfers). Interestingly, very few outlier tasks appear in the DMDAS and WS executions although the latter still seems a bit sensitive to this, as inactivity periods on CPUs (white areas) still correlate
with the occurrence ofdgemmoutliers (darker green) on GPUs.
Finally, we stress that such observations are no coincidence. We randomly ran similar scenarios ten times and although the numbers always slightly differ, the general behavior and conclusions are the same. We also highlight that the area bound estimations (ABE) can vary significantly between two scenar-ios (e.g., 60s for constrained DMDA vs. 57s for constrained WS), which can be initially surprising since these estimates only depend on the number of tasks and their per-type average
execution time on the different resources. The observations can be explained by the use of sample execution time mean, which may vary a bit. From our investigation, this variation is not explained by outliers occurrence but rather biased toward one or another scheduler. We think this is the consequence of a better locality (cache usage) but more complex measurements would be needed to fully evaluate this hypothesis.
B. Small Workload (Cholesky of12×12 tiles of size 960×960)
1) Expectations: Potential improvements. The area bound
(ABE) is optimistic for small workloads since it ignores task dependencies. The critical path bound (CPE) is much more relevant, especially on very small workloads such as this one. Still, knowing how tight they are is quite difficult [24]. Thus, comparing to the ideal CPU/GPU allocation is meaningless and we should focus mainly on filtering task dependencies. Idle time everywhere. Having a lot of idle time is expected because of dependencies. It is thus imperative to identify crucial tasks, highlighting the “dynamic critical path”, i.e., the last tasks upon which they depended on. Such important tasks may appear either because of the DAG structure or because they have been particularly delayed.
2) Backtrack Dependencies to Pinpoint Scheduling
Mis-takes: Since StarPU also exports the DAG, the dependency
information can be merged into the trace. For Cholesky, the
dpotrf are critical tasks that release many other tasks. It
seems, therefore, relevant to track their dependencies. For a
730 CPE 368 ABE 434 CPU0 CPU1 CPU2 CPU3 CPU4 CPU5 CPU6 CPU7 CPU8 CPU9 CPU10 CPU11 CPU12 CPU13 CPU14 CPU15 CPU16 CPU17 CPU18 CPU19 CPU20 CPU21 CPU22 CPU23 CPU24 CUDA0 CUDA1 CUDA2 0 200 400 600 Time [ms] Resources
dgemm dpotrf dsyrk dtrsm Idle/SleepingCritical Paths 1 2
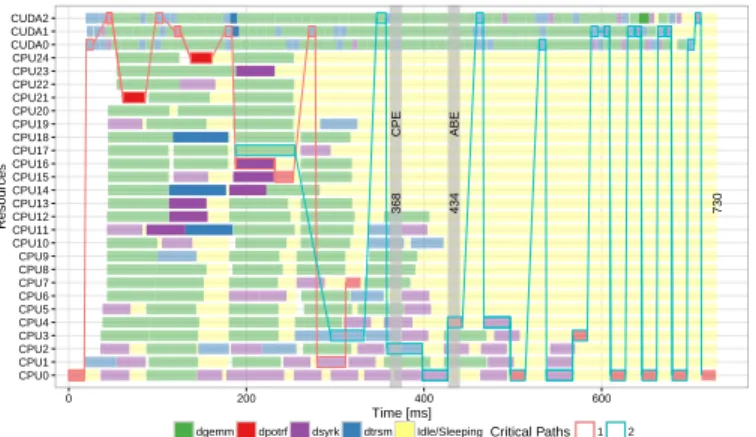
Fig. 5: Detailed view (see http://perf-ev-runtime.gforge.inria. fr/vpa2016/) of a 12 × 12 Cholesky execution (DMDAS scheduler) with two (red and blue) critical paths.
on which it depends on and that finished the latest, similarly,
for Ti−1its latest predecessor Ti−2, etc. Such backward
track-ing of dependencies allows rebuildtrack-ing the observed critical path. Given the DAG, in an ideal execution one would expect
adpotrfto be immediately preceded by adsyrk, immediately
preceded by a dtrsm that would, in turn, be immediately
preceded by the dpotrf of the previous iteration. Therefore,
we compute such filtered backward dependencies for each
dpotrf and merge them together.
This is illustrated in Figure 5. The makespan is 730ms while the ABE is 434ms and the CPE is 368ms. The bounds may be loose but it seems that there is room for improvement. If we start from the end of the schedule and go backward in time, we can see a dependency path (in blue) that, until timestamp
400ms, fully respects the alternationdpotrf–dsyrk–dtrsm. At
the very end, all tasks execute right one after the other, which is optimal. The first “mistake” appears in time 600ms where
the dsyrk could have been executed a little earlier. Slightly
before, some dtrsm are not executed right after their dpotrf
maybe because of data transfer or more likely because of a wrong priority. This critical path does not merge with the
one obtained for thedpotrfof the first iterations. Now, when
looking at the other (red) dependency path, we can see many times that the tasks are scheduled as soon as possible as if there was some priority problem, which could possibly be solved with another scheduler. The scripting feature allows plotting only dependencies whose duration is larger than a given threshold, avoiding graphical clutter.
We identify another problem with the blue dependency path. At the end, tasks are executed on the appropriate resource
(dpotrfon CPUs, anddsyrkanddtrsmon GPUs). However,
slightly before time 600ms, critical dsyrktasks start running
on the CPUs, slowing the progression. Likewise, slightly
before time 400ms, critical dtrsm tasks are run on CPUs
whereas they are known to be very slow on such resources. It seems that this scheduler makes a bad decision and that
constrainingdtrsmanddsyrkto be executed on GPUs may
reduce the total makespan. Although the potential solutions (fix priority, constraining some tasks to GPUs) suggested by this analysis are the same as in the previous use case, the
underlying reasons are fundamentally different.
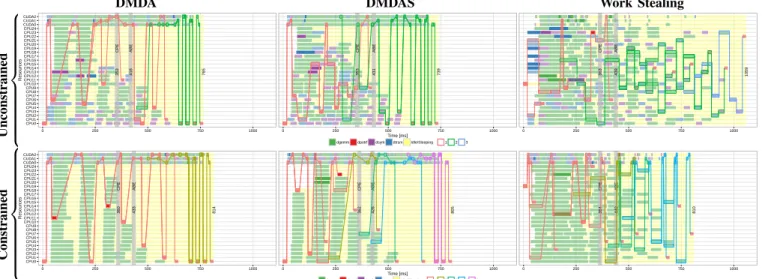
3) Comparing Scheduling Strategies and Task Constraints: Based on the previous analysis, we vary again the three
schedulers and forcingdsyrk/dtrsmtasks on GPUs. Figure 6
compares the six resulting combinations for this workload. By taking a closer look at the unconstrained top row of Figure 6, we can observe that the behavior demonstrated by the DMDA and DMDAS schedulers are not so different. They both have similar runtime, two unmerged critical paths on which priority and critical task allocation problems can be identified. WS also demonstrates a very bad allocation, which is not surprising because it does not take into account the heterogeneity of the platform. There are three dynamic
critical paths in the WS scheduler, with many dtrsm and
dsyrk running on CPUs. When constraining these two task
types to execute only on GPUs (the bottom row of Figure 6), we observe that such restriction does not really help for the DMDA and DMDAS schedulers. Tasks on the critical path are no longer an issue, but both schedulers still have priority problems. The behavior demonstrated by DMDA seems easier to understand: we see some typical list scheduling behavior
with criticaldpotrfbeing delayed because CPUs are used for
not so critical dgemms. If one could run these tasks earlier, it
appears that the whole makespan would be greatly improved. Surprisingly, Work Stealing strongly benefits from the im-posed restriction and now favorably compares against DMDA and DMDAS. It is also interesting to note that WS manages to keep all CPUs busy from the very beginning, unlike the other two schedulers. However, GPUs are not fully exploited, in particular at the end where they should be used to accelerate
thedgemms like the DMDA and DMDAS strategies do. If there
was a way to preventdgemmtask execution on CPU after time
350ms, we would probably get the best of the two scheduling strategies and be much closer to the optimal execution time.
VI. CONCLUSION
This article presents how an agile scripting framework allows creating faithful and enlightening trace views for the performance analysis of task-based HPC applications running on heterogeneous platforms. The framework follows the UNIX philosophy and builds upon many small existing tools (pj-dump, ggplot2, plotly) glued together with the R programming language. Putting interaction at the very end together with scripting capabilities in the core of the analysis process is the key to a flexible design. We have shown how applying this framework in the analysis of large and small scale scenarios based on the MORSE/StarPU implementation of the Cholesky factorization allows to identify and address several non-trivial scheduling problems. The approach has scalability limitations mostly in the graphical representations (static or interactive) and not the scripting methodology for creating them. Plotly, for instance, is incapable of handling too much data, such as when there are many task types or resources.
As future work, we intend to improve the interactive graph-ical views by using temporal aggregation to reduce trace size and improve the integration between performance visualization
DMDA DMDAS Work Stealing Constrained Unconstrained 765 CPE 353 ABE 418 739 CPE 353 ABE 431 1059 CPE 363 ABE 439 CPU0 CPU1 CPU2 CPU3 CPU4 CPU5 CPU6 CPU7 CPU8 CPU9 CPU10 CPU11 CPU12 CPU13 CPU14 CPU15 CPU16 CPU17 CPU18 CPU19 CPU20 CPU21 CPU22 CPU23 CPU24 CUDA0 CUDA1 CUDA2 0 250 500 750 1000 0 250 500 750 1000 0 250 500 750 1000 Time [ms] Resources
dgemm dpotrf dsyrk dtrsm Idle/Sleeping 1 2 3
814 CPE 360 ABE 433 805 CPE 362 ABE 426 810 CPE 364 ABE 440 CPU0 CPU1 CPU2 CPU3 CPU4 CPU5 CPU6 CPU7 CPU8 CPU9 CPU10 CPU11 CPU12 CPU13 CPU14 CPU15 CPU16 CPU17 CPU18 CPU19 CPU20 CPU21 CPU22 CPU23 CPU24 CUDA0 CUDA1 CUDA2 0 250 500 750 1000 0 250 500 750 1000 0 250 500 750 1000 Time [ms] Resources
dgemm dpotrf dsyrk dtrsm Idle/Sleeping 1 2 3 4 5
Fig. 6: The execution representation (interactive version at http://perf-ev-runtime.gforge.inria.fr/vpa2016/) of three schedulers
(DMDA, DMDAS and Work Stealing), as columns, with unconstrained versus constrained dsyrkanddtrsm tasks on GPUs,
as rows, for a 12 × 12 tiled Cholesky decomposition. Each of the six plots is an instance of the view described in Figure 5. and runtime debugging. We also intend to extend this approach
to analyze the behavior of irregular task-based workloads [25].
Acknowledgements: This work was supported by the
projects: CAPES/Cofecub 764-13, FAPERGS/Inria ExaSE, CNPq 447311/2014-0, HPC4E 689772 from EU/H2020 and MCTI/RNP-Brazil, and the CNRS/LICIA Intl. Lab. We also thank Emmanuel Agullo, Lionel Eyraud-Dubois, and Suraj Kumar for their help in better understanding the traces and the visualization needs of the runtime scheduler developers.
REFERENCES
[1] H. Topcuoglu, S. Hariri, and M.-Y. Wu, “Performance-effective and low-complexity task scheduling for heterogeneous computing,” IEEE Trans. Par. Distr. Syst., vol. 13, no. 3, pp. 260–274, 2002.
[2] E. Schulte, D. Davison, T. Dye, and C. Dominik, “A multi-language computing environment for literate programming and reproducible re-search,” J. of Stat. Soft., vol. 46, no. 3, 2012.
[3] E. Agullo, G. Bosilca, B. Bramas, C. Castagnede, O. Coulaud, E. Darve, J. Dongarra, M. Faverge, N. Furmento, L. Giraud, X. Lacoste, J. Langou, H. Ltaief, M. Messner, R. Namyst, P. Ramet, T. Takahashi, S. Thibault, S. Tomov, and I. Yamazaki, “Poster: Matrices over runtime systems at exascale,” in High Performance Computing, Networking, Storage and Analysis (SCC), 2012 SC Companion:, Nov 2012, pp. 1332–1332. [4] C. Augonnet, S. Thibault, R. Namyst, and P.-A. Wacrenier, “StarPU:
a unified platform for task scheduling on heterogeneous multicore architectures,” Conc. and Comp.: Pract. and Exp., vol. 23, no. 2, 2011. [5] E. Agullo, J. Demmel, J. Dongarra, B. Hadri, J. Kurzak, J. Langou, H. Ltaief, P. Luszczek, and S. Tomov, “Numerical linear algebra on emerging architectures: The plasma and magma projects,” Journal of Physics: Conference Series, vol. 180, no. 1, 2009.
[6] A. Duran, E. Ayguadé, R. M. Badia, J. Labarta, L. Martinell, X. Mar-torell, and J. Planas, “OmpSs: a proposal for programming heteroge-neous multi-core architectures,” Par. Proc. Letters, vol. 21, no. 02, 2011. [7] G. Bosilca, A. Bouteiller, A. Danalis, T. Herault, P. Lemarinier, and J. Dongarra, “DAGuE: A generic distributed DAG engine for high performance computing,” Parallel Computing, vol. 38, no. 1–2, 2012. [8] C. Augonnet, O. Aumage, N. Furmento, R. Namyst, and S. Thibault,
“StarPU-MPI: Task programming over clusters of machines enhanced with accelerators,” in Proc. European Conf. Recent Advances in the
Message Passing Interface (EuroMPI). Springer, 2012, pp. 298–299.
[9] S. Ohshima, S. Katagiri, K. Nakajima, S. Thibault, and R. Namyst, “Implementation of FEM Application on GPU with StarPU,” in SIAM Conference on Computational Science and Engineering, 2013.
[10] V. Martínez, D. Michéa, F. Dupros, O. Aumage, S. Thibault, H. Aochi, and P. O. A. Navaux, “Towards seismic wave modeling on heterogeneous many-core architectures using task-based runtime system,” in Intl. Symp. on Comp. Arch. and High Perf. Comp. (SBAC-PAD). IEEE, Oct. 2015. [11] E. Agullo, L. Giraud, A. Guermouche, S. Nakov, and J. Roman, “Task-based Conjugate Gradient: from multi-GPU towards heterogeneous architectures,” Inria Bordeaux, Research Report 8912, May 2016. [12] X. Lacoste, M. Faverge, P. Ramet, S. Thibault, and G. Bosilca, “Taking
advantage of hybrid systems for sparse direct solvers via task-based runtimes,” in HCW’2014 workshop of IPDPS. IEEE, 2014, pp. 29–38. [13] R. L. Graham, “Bounds for certain multiprocessing anomalies,” Bell
System Technical Journal, vol. 45, no. 9, pp. 1563–1581, 1966. [14] K. Coulomb, M. Faverge, J. Jazeix, O. Lagrasse, J. Marcoueille,
P. Noisette, A. Redondy, and C. Vuchener, “Visual trace explorer ViTE.” [15] L. M. Schnorr, M. Faverge, F. Trahay, B. O. Stein, and J. C. de
Ker-gommeaux, “The Paje trace file format,” UFRGS, Tech. Rep., 2016. [16] V. Pillet, J. Labarta, T. Cortes, and S. Girona, “Paraver: A tool to
visualize and analyze parallel code,” in Proceedings of WoTUG-18: Transputer and occam Developments, vol. 44, 1995, pp. 17–31. [17] A. Knüpfer, H. Brunst, J. Doleschal, M. Jurenz, M. Lieber, H. Mickler,
M. S. Müller, and W. E. Nagel, “The Vampir performance analysis
tool-set,” in Tools for High Perf. Comp. Springer, 2008, pp. 139–155.
[18] A. Huynh, D. Thain, M. Pericàs, and K. Taura, “DAGViz: A DAG Visualization Tool for Analyzing Task-parallel Program Traces,” in Proc. 2nd Workshop Visual Perf. Analysis (VPA’15). ACM, 2015, pp. 3:1–3:8. [19] R. Keller, S. Brinkmann, J. Gracia, and C. Niethammer, Temanejo:
De-bugging of Thread-Based Task-Parallel Programs in StarSS. Springer,
2012, pp. 131–137.
[20] B. Haugen, S. Richmond, J. Kurzak, C. A. Steed, and J. Dongarra, “Visualizing execution traces with task dependencies,” in Proc. 2nd
Workshop Visual Perf. Analysis (VPA’15). ACM, 2015, pp. 2:1–2:8.
[21] L. M. Schnorr and A. Legrand, “Visualizing more performance data than what fits on your screen,” in Tools for High Perf. Comp. Springer, 2013, pp. 149–162.
[22] G. Pagano and V. Marangozova-Martin, “FrameSoC Workbench: Fa-cilitating Trace Analysis through a Consistent User Interface,” Inria, Technical Report RT-0447, Apr. 2014.
[23] V. Danjean, R. Namyst, and P.-A. Wacrenier, “An efficient multi-level trace toolkit for multi-threaded applications,” in European Conference
on Parallel Processing. Springer, 2005, pp. 166–175.
[24] E. Agullo, O. Beaumont, L. Eyraud-Dubois, J. Herrmann, S. Kumar, L. Marchal, and S. Thibault, “Bridging the Gap between Performance and Bounds of Cholesky Factorization on Heterogeneous Platforms,” in Heterogeneity in Computing Workshop 2015, Hyderabad, India, 2015. [25] E. Agullo, A. Buttari, A. Guermouche, and F. Lopez, “Multifrontal
QR factorization for multicore architectures over runtime systems,” in