Publisher’s version / Version de l'éditeur:
Vous avez des questions? Nous pouvons vous aider. Pour communiquer directement avec un auteur, consultez la première page de la revue dans laquelle son article a été publié afin de trouver ses coordonnées. Si vous n’arrivez pas à les repérer, communiquez avec nous à [email protected].
Questions? Contact the NRC Publications Archive team at
[email protected]. If you wish to email the authors directly, please see the first page of the publication for their contact information.
https://publications-cnrc.canada.ca/fra/droits
L’accès à ce site Web et l’utilisation de son contenu sont assujettis aux conditions présentées dans le site LISEZ CES CONDITIONS ATTENTIVEMENT AVANT D’UTILISER CE SITE WEB.
Building Research Note, 1973-02
READ THESE TERMS AND CONDITIONS CAREFULLY BEFORE USING THIS WEBSITE. https://nrc-publications.canada.ca/eng/copyright
NRC Publications Archive Record / Notice des Archives des publications du CNRC :
https://nrc-publications.canada.ca/eng/view/object/?id=3a22f7c6-ec56-40e8-aa6b-2b79c6e2c80a https://publications-cnrc.canada.ca/fra/voir/objet/?id=3a22f7c6-ec56-40e8-aa6b-2b79c6e2c80a
NRC Publications Archive
Archives des publications du CNRC
This publication could be one of several versions: author’s original, accepted manuscript or the publisher’s version. / La version de cette publication peut être l’une des suivantes : la version prépublication de l’auteur, la version acceptée du manuscrit ou la version de l’éditeur.
For the publisher’s version, please access the DOI link below./ Pour consulter la version de l’éditeur, utilisez le lien DOI ci-dessous.
https://doi.org/10.4224/40000621
Access and use of this website and the material on it are subject to the Terms and Conditions set forth at
Compressive strengths of 2 inch cubes of types S and N mortars
Davison, J. I.
CANADA
( 1
i
I
Ser: I
TKL B92~
no. 871
A N A L Y Z ~ ~
COMPRESSIVE STRENGTHS
OF
2-IN.
CUBESOF
TYPES SAND N
MORTARSby
J.I. Davison
February 1973 3% 7 ; - * 7
COMPRESSIVE STRENGTHS O F 2
-IN.
CUBESOF
TYPES S AND N MORTARSby
J.I.
DavisonTYPE
S MORTARThe construction of an 1 l -storey load-bearing masonry wall apartment building in Halifax during the fall of 1 9 7 1 provided an opportunity far field t e s t s on a Type S mortar not commonly used
in the area. The compression testing of cubes of mortar f o r load-
b e a r i n g masonry is described in the Canadian Structural Design
Manual, Supplement No. 4 to the National Building Code a£ Canada 1970. The objectives of the proposed testing program were to
investigate the t e s t procedures outlined in the Manual and t o obtain
statietical data on the relationship between cornpres sion values f o r
fieId and laboratory mortar, The structural engineer on the site agreed to allow some testing; in return he was to receive a copy of
the compression values f o r cubes of f i e l d mortar. The first cubes
w e r e molded 20 September 197 1 and compression t e s t s w e r e completed
4 January 1972. A t o t a l of 240 cubes of field mortar were molded and tested.
REQUIREMENTS
The Canadian Structural De sign Manual permits the de sign of masonry structures based on an engineering analysis. An alternative
method far determining the value of the compressive strength
of
them a s o n r y is based on t e s t s of
the
m a s o n r y units and mortar.The
mortar values are established f ~ c l m t e s t s on laboratory-prepared
m o r t a r containing the same materials and in the s a m e propostians
a s those used in the masonry. This method also includes held control
t e s t s designed to ensure that the mortar being used on the site develops
strength values comparable t o those obtained for the laboratory design
mix, on which the structural calculations were based.
The following are the provisions in the Design Manual f o r Field C o n t r o l T e s t a on Mortar:
4 . 4 , 3 . 8 ( 1 )
. . .
at least five 2'hmortar cube specimens shall be madefor each 5000 square feet, o r p o r t i o n thereof, of wzlZ but not l e s s
than five t e s t specimens f o r each storey height, and not less than
five t e s t specimens f o r any building.
4 . 4 . 3 . 8 ( 4 ) F a r t e s t s of mortar cubes referred t o in Sentence (1):
(a) the mortar shall
be
taken at randorr, from the mortar boardscurrently in u s e but care shall. be taken that no old mortar from the
edges of the boards i s included; (b) mortar t e s t cubes shall be made,
cured and tested in accordance with CSA A l 7 9 - 1 9 6 7 , M o r t a r for U n i t
M a s o n r y ; (c) except as provided in [d), compression strength t e s t s
of mortar c u b e s shall b e made at an age of 28 days; and (d) t e s t s
may be made after seven days on mortar t e s t cubes provided that the
relationship between 7 - and 28-day strength of the mortar has been
established by previous t e s t s , o r the compression strengths obtained
f r o m 7 -day t e s t results may be a s s u m e d to be 90 per cent of the 28 -day
value
.
4.4. 3.8(5) The average compression strength of mortar cubes obtained
f r o m any five consecutive 28-day field control t e s t s or from the 28 -day
s t r e n g t h s predicted from 7-day t e s t s in accordance with Clause ( d ) r e f e r r e d
to in Sentence (4) shall be at least 0.8 0 of the compre a sive strength
determined in accordance with 4 . 4 . 3 . 3 f o r the type of mortar used and
no individual t e s t result shall have
a
value less than 0 - 6 7 of that strength. MORTARThe job specification called f o r
a
Type S mortar t o contain 1part P o r t l a n d cement to
$
part hydrated lime, but this had been changedby agreement and the mortar used on-site contained
$
part Portlandcement and 1 part 1:L:
6
masonry mortar mix, This mixture is alsoclassified as a Type S mortar in GSA A179
-1967,
The latter specification,and the Design Manual, require a minimum average compre s sive strength
of 1800 p s i at 28 days f o r
a
Type S mortar.Both the P o r t l a n d cement and the m a s o n r y mortar mix used on-site
w e r e produced by reputable manufacturers. They meet the requirements
of t h e respective CSA specifications and a r e used extensively with good results in m a s o n r y mortars in the area. The masonry mortar mix is
known to be a blended mixture of Portland cement and hydrated lime, an
air-entraining material, and possibly other additives. Information on
the bag indicates that, when the contents are mixed with 18 No. 2 shovelsful
of sand, the resulting mortar will meet the requirements for
a
TypeN
mortar as defined in CSA
A179-1967.
It is i n t e r e s t i n g to note that since the mortar mix contained
P o r t l a n d cement
+
1 part mortar mix) becomes 1 part Portland cement andf
part hydrated lime because the mortar mix contains$
p a r t P o r t l a n dcement and
$
part hydrated lime. In effect the mortar used was them o r t a r specified.
The aggregate was a pii: sand with a particle size grading
within the limits defined in CSA A82,56 (Figure 1 ) .
CUBES
OF
F I E L D MORTARThe mortar was mixed in a r o t a r y paddle mechanical mixer. A
''batch" consisted of 1 bag of mortar mix and 314 to 1 bucket of Portlaad
cement (2 buckets = 1 bag). The sand was measured with a shovel and
limited observations indicated that 1 5 t o 18 shovelsful w e r e used per
batch. The amount of water used varied from I to 1S buckets (1 bucket
1
= 3~ g a l . ). The o r d e r of charging the mixer was as follows
-
water[usually put in the mixer immediately after the previous batch of
mortar w a s discharged), then half the sand, Portland cement, masonry
m o r t a r mix, the remaining sand and more water as required. Charging
and mixing time totalled about 3 rnin.
As
it took at least half thist i m e t o charge the machine, it can be seen that mixing time was
minimal. It should be noted however, that observations of mixing pro-
cedures were usually made at the. start of operations in the morning or after lunch. Mixing time could be expected t o be below average during these periods
when
the masons w e r e waiting for mortar i n o r d e r t o s t a r t operations.A s directed in the D e s i g n Manual, mortar samples w e r e taken
at r a n d o m from the mason's mortar boards at the wall. There w a s no
set pattern as to the t h e samples were taken thus preventing the
possibility of a special mortar
being
prepared for anticipated t e s t s -C u b e s w e r e molded i n brass molds as described in CSA A. 8. Twelve
cubes w e r e molded ac each sampling; there were usually two samplings
f o r each s t o r e y (12 =ubes only f o r storeys 3 and
8,
24 f o r each of theother 9
-
making the total 240).After the brass m o l d s were filled they w e r e placed in poly-
ethylene bags, left in the construction shack overnight, then moved into
the laboratory at 20 to 24 hours, when the molds were stripped
and
thecubes immersed in water f a r the duration of the curing period,
LABORATORY
CONTROL CUBESL a b o r a t o r y mortar was mixed as directed in CSA ~ 1 7 9 - 1 9 6 7 ,
The Type S mortar, containing
$
p a r t Portland cement, Z part m a s o n r ym o r t a r mix and 2 114 to 3 parts sand by volume, was batched by weight
Portland cement
-
8 7 $ l b / c uR
M a s o n r y mortar mix
-
wt on bag (55 lb/cu f t )Sand, damp, loose
-
80
lb/cu f tThe m a t e r i a l s were obtained f r o m the job site. It should be noted that
a bag of Portland cement contains only 8 0 ib rather than the 87s l b / c u ft figure listed
in
the Specification. Since the specified design mix hadnot been checked out by laboratory investigation p r i o r to the start of
m a s o n r y canstruction it was decided that the initial control mortar
should contain the maximum amount of sand (3 parts by volume). W h e n
e a r l y canpressive s t r e n g t h values f o r field mortar w e r e much h i g h e r
t h a n those f o r control mortar, the latter w a s adjusted in two ways:
Portland cement content was reduced in line with the u s e (at that t i m e )
of 3/4 bucket on the site, i. e m , the c o n t r o l mortar proportions became
3 1 8 Portland cement t o 1 masonry mortar mix; and sand w a s reduced
to the minimum, 2 l j 4 instead of 3 parts. Late in the study the Portland
cement content was again reduced t o bring it in line with the 80 lb/bag f i g u r e
used in field mortar.
As
direct& in CSA A17.4, sufficient w a t e r wasused in the control m o r t a r t o produce a flow value between 100 and 11 5.
Each time cubes were molded on the site an equal number were prepared
with control mortar in the laboratory. COMPRESSION TESTS
Half the cubes (6) fram each sampling w e r e t e s t e d at 7 days, and
the remainder at 28 days. Upon completion of the respective curing
periods, cubes w e r e removed from the w a t e r , wiped surface dry and
tested in a "wet'' condition. The values are listed in Table
I
and aresummarized as follows
-
Field M o r t a rAverage [PZO values)
High L o w C o n t r o l M o r t a r
-
maximum aand A v e r a g e (24 values) High Low 7 -Day 28 -Day 2077 p s i 2916 p s i 2859 3775 " 1 3 8 0 " 2220 ' I 1377 psi 1926 p s i 1 5 6 3 2188 l1 1170 1540 "C o n t r o l M o r t a r
-
minimum sand-
-
reduced Portland cementAverage (78 cubes) High
Low
7 -Day 28 -Day 1921 psi 2651 psi
Control M o r t a r
-
minimum sand --
Portland cement-
80 lb/bag7
-Day 28-Day
Average ( 1 2 cubes) 1882 psi 2324 psi High
Low
The over-all average value ( 1 1 4 cubes) f a r control m o r t a r at 7 days
was 1802 p s i vs 2421 p s i at 28 days. The 7-day average f o r field
mortar was
70.1 per centsf
the 28-day value [vs 7 4 - 4 per cent f o rc o n t r o l mortar), and the 28 -day value exceeded the 1800 psi require
-
ment by 62 per cent. F i e l d mortar values were also higher than those
f o r control m o r t a r , 51 per cent (maximum sand), 10 per cent (minimum
sand
-
reduced P o r t l a n d cement) and 23 per cent [minimum sand-
cement at 8 0 lb/bag).
DISCUSSION
(a) Field Test Method
The directions in the Design Manual do not specify where the
cubes are t o be molded so three alternatives a r e possible:
( 1) After on-site sampling the mortar could be taken to t h e
laboratory and cubes molded there, permitting praper curing p r o -
cedure from the o u t s e t .
The
effectiveness of this method woulddepend on the distance of the site f r o m the lab, and the method
a£
packaging the mortar during transit;
( 2 ) After sampling the m o r t a r , cubes could be molded on-site,
and the malda containing the fresh mortar moved directly into the
laboratory f o r curing, There is danger, in this method, of disturbing
the plastic mortar in the molds during transit; and
(3) After sampling the morf ar, cubes could be molded on-site,
allowed t o remain in a sheltered spot overnight, and removed to the l a b after hardening (20 to 24 hrs). Reservations re this method concern
the lack
of
control over curing conditions during the initial on-sitestorage period.
All t h r e e methods have been used in previous studies and the
third one found t o give the highest and the most consistent results.
Accordingly, it was seLected for this study and the effect of variations
in the initial on-site curing environment was minimized by putting the
molds In polyethylene bags.
(b) G o m ~ a r i s o n of Values
It is generally recognized that a control mortar prepared in the
on a c o n s t r u c t i o n site, because the l a b o r a t o r y mortar i s mixed to a
stiffer consistency [contains l e s s w a t e r ) than the field mortar. This
is reflected in the requirements
of
the
Design Manual where theaverage value for 5 t e s t s must be 80 per cent of the value of the type
of mortar used, with no individual value l e s s than 67 per cent of that
strength.
The results of this study do not support this reasoning because
the control mortar did not accurately represent the field mortar.
Observations suggest that the field mortar was undersanded, a common
practice among masons in this area. The directions on the m a s o n r y
mortar mix bag, 18
No.
2 shovelsful of sand per bag, would mean 27shovelsful for bags of cernentitious material instead
of
the 1 5 t o 18shevelsful actually used, There was also evidence that the amount of
cementitious material was varied at the discretion o f the masonry
foreman. It i s evident from these observations, and the variation
in compressive strength values, that the control mortars were not really repse sentative of the mortar u s e d on- site.
T o provide a better comparison a series of 6 0 two-in. c u b e s
of Type
S
mortar was prepared in the laboratory. The differencebetween this series and previous control mortars is that only the
sand quantities were varied, while in the previous series both sand
and c e m e n t quantities were varied. Thirty of these cubes contained
the maximum amount of sand permitted under the property specifica-
t i o n (3 times the s u m of the volurne s of cementitious materials), while the
remaining thirty contained the minim- (2 114 times the total volume
of cementitious materials). All m a t e r i a l s were obtained from the
construction site. Results of 7
-
and 28-day compressive strengtht e s t s are listed in Table FI and the average values compared with
field values in the following summary.
Compre a sive Strength of C o n t r o l and Field M o r t a r
7-Day V a l u e s 28 -Day Values
Control
-
maximum
aggregate 1417 psi 2201 psiControl
-
minimum aggregate 2123"
3122 "Field 2077
'"
2416 ItThe comparison indicates that the field values are slightly less than
values for the laboratory mortar containing the minimum amount of
aggregate, This concurs with our field observations.
The use of an air-entrained mortar mix, permitted in the
National Building Code, is not r e c o r n e n d e d by authorities such as the
Canadian Structural Clay
As
sociation and the Structural Clay ProductsInstitute because of the danger that air content might have a detrimental effect OPI strength values. A limited number of air content determinations
on t h e construction site mortar produced vzlues between 12.5 a n d
13.5 per cent, and t h e high compressive strength values indicate
that air content was not detrimental
in
this instance.C ONC LUSZONS
11
1
Satisfactorycuring
results are obtained when mortar cubes are molded an the construction site, stored there overnight in p l y -ethylene bags, and taken into
the
laboratory at 20 to 24 hours f o rnorrnal curing,
( 2 F i e l d values substantially higher (62 per cent) than the 1800 psi
requirement for Type S mortar are attributed to the u s e of minimum amounts af sand in the mix,
(3) Field values closer to the design requirements could have
been obtained with a design mix established by a pre-construction
l a b o r a t o r y evaluation.
(4) The presence of
an
air-entraining material i n the m a s o n r ymortar mix did not have any noticeable effect on strength values.
( 5 ) A 9 per cent reduction in the weight per bag of Portland cement
(80 lb as compared with 87.5 lb/cu f t used i n l a b o r a t o r y t e s t s ) was not
significantly reflected in reduced strength values.
z
6
1
Twenty-eight d a y t e s t s were of n o practical value on this projectwhere 1 storey (8000 s q f t ) w a s completed every 4+ days. Seven-day
t e s t s we re also of que stionable value; values at three days would have
TYPE N MORTAR
During the construction o f the apartment building the interior
load-bearing wythe of concrete black
and
Type S mortar was laid upf i x st and the exterior wythe of clay brick and Type N mortar followed.
This procedure made it possible t o do some field studies on
the
Type N mortar following the Type S study, The t e s t s essentially
included analysis of plastic mortar ta establish cementitious material,
aggregate r a t i o , and c ~ m p r e s s i o n strength t e s t s on 2-in. cubes,
First t e s t s w e r e conducted
16
November 1971 and the last cubesw e r e molded
on
2 February 1972. A totalof 156
cubes were moldedwith field mortar using the procedures described previously for the
Type
S
mortar. There was a companion s e t of contrcrl. cubes ofl a b o r a t o r y mortar for each set with the following exceptions: on
6
January laboratory control cubes were molded with field mortar,and on 2 4 J a n u a r y and 2 F e b r u a r y no control cubes were molded.
The method of determining the cementitious rnateria1:aggregate
ratio has been drafted in ASTM Committee
C
-
12 and is currently beingevaluated in a ca-operative t e s t program. Briefly the ratio i s
e stablished by washing the cementitious material from the mortar on
a
No.
1 0 0 sieve, The residue is p r i m a r i l y aggregate after washingand the ratio is easily established. A moisture content t e s t on the
mortar is an essential part of this procedure, M o r t a r cubes w e r e
cured in a
fog
room, maintained at a relative humidity in excess of90 per cent. MORTAR
T h e mortar contained 1 p a r t masonry mortar mix to 3 parts sand. Both materials w e r e the s a m e a s used in the Type S mortar.
O n
the sitethe
proportions w e r e generally 1 bag mortar mix and 15shovelsful of sand (18 shovelsful w e r e recarrunended in the directions
on the bag). A limited number of observations indicated a mixing
time that rarely exceeded 1 minute after the machine w a s fully charged.
RESULTS
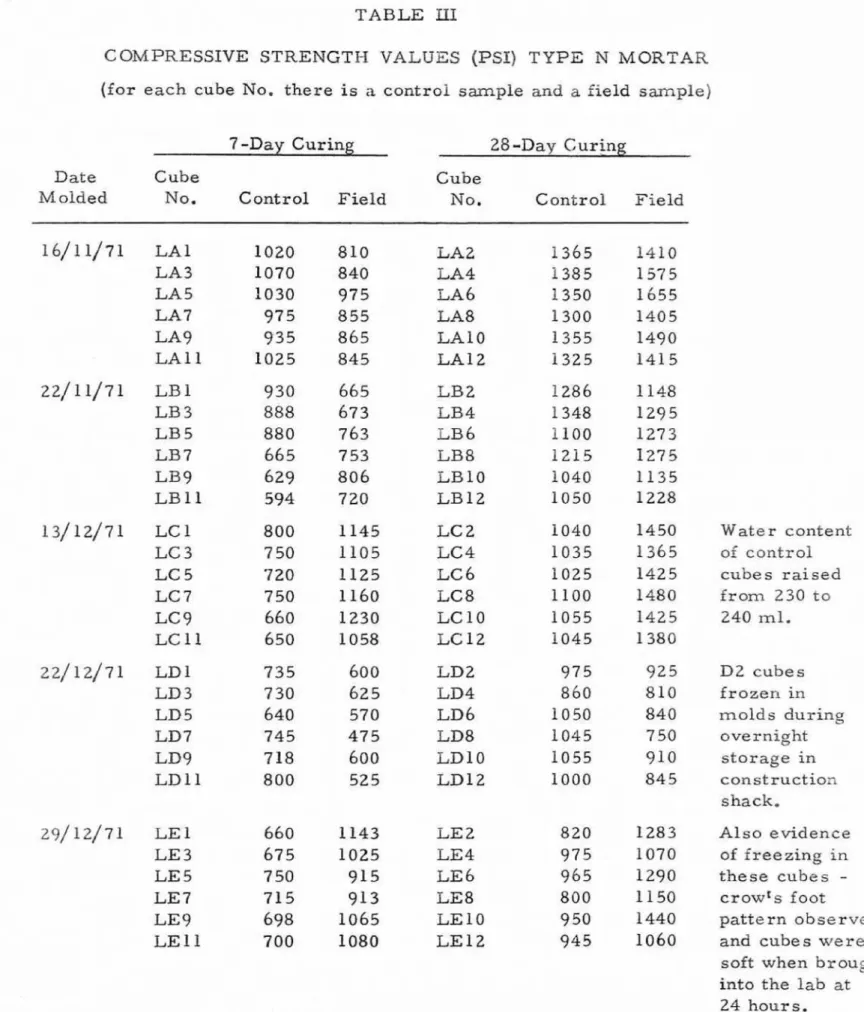
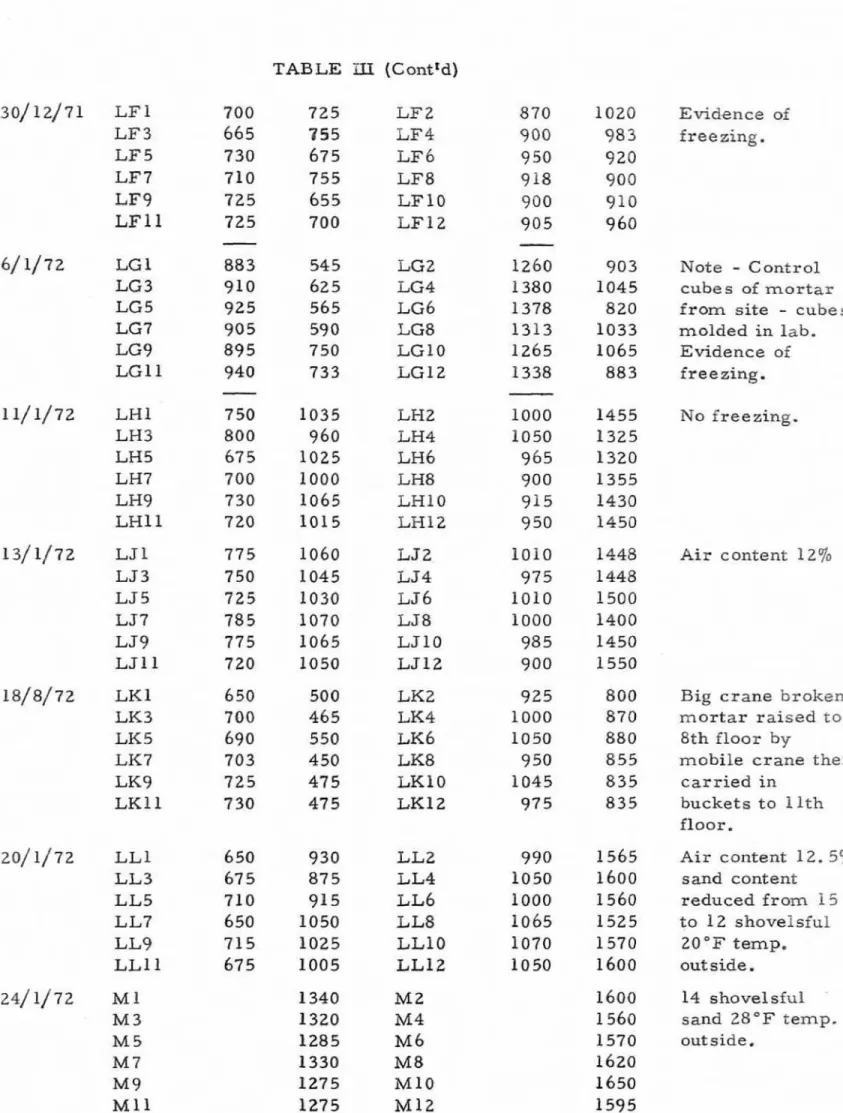
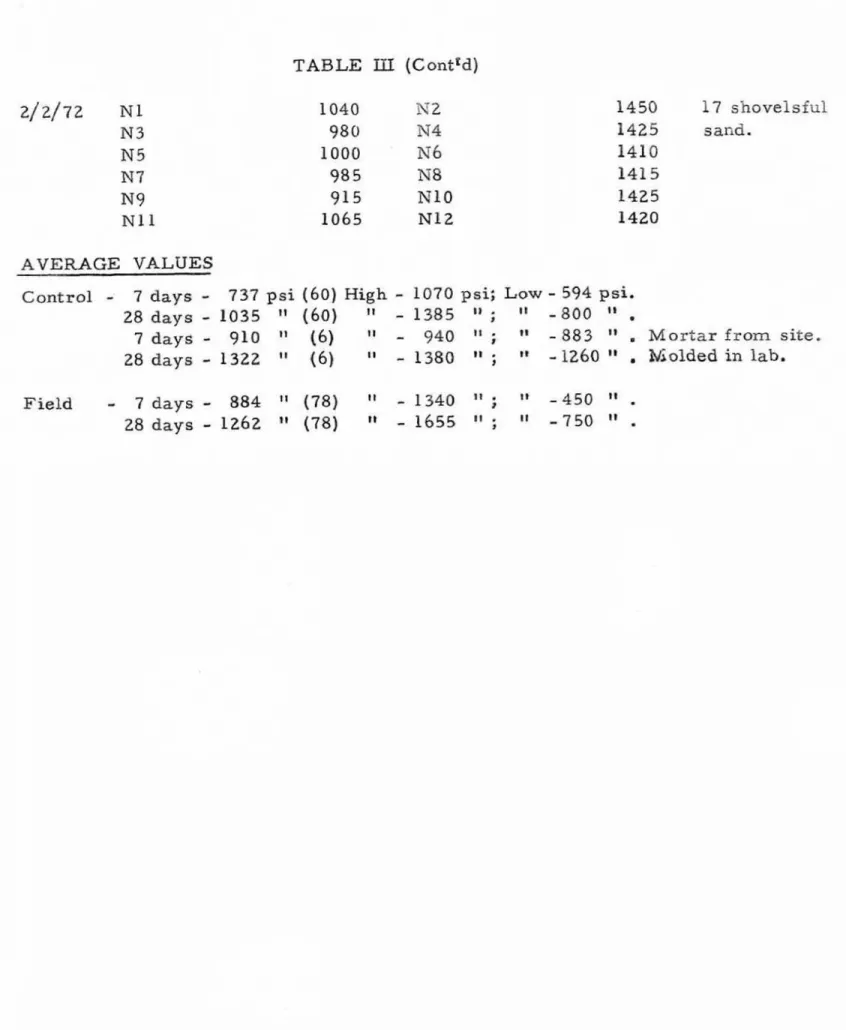
Compressive strength values are listed in Table III and are
summarized a s follows:
7-Day V a l u e e
C o n t r o l m o r t a r
-
Avg. 737 p s i (60)* Range 594-1070 psiField I I
-
"
984 t g (78) 450-1340 lk28-Day Values
Control mortar
-
Avg. 1035 psi (60) Range 800-1385 psiField
~t-
'I 1262 l1 (78) 350-1655 f 1G u b e s Molded
in the
Lab with M o r t a r from the Field7-Day Value
-
Avg, 910 psi( 6 )
Range 883-940
psi2 8 - D a y v a l u e - In 1322
"
( 6 )
If 1 2 6 0 - 1 3 8 0 I T .Average values f o r field mortars exceed those f o r control mortars
by 20 per cent at 7 days and 22 per cent at 28 days. The average 7 -day values are 7 1 par cent of 28-day values f o r control mortar
and 70 per cent for field mortar,
A s in the Type S study the values far field mortars exceed
those f o r control laboratory mortars, and again this is thought to
relate t o short sanding on the site, where 1 5 shovelsful of sand w e r e
used instead of the 18 ah~velsful r e c o m m e n d e d by the mortar mix
manufacturer. A l l values for field mortar satisfy the 7 5 0 psi
requirement far Type N mortar in CSA Specification
A179-67.
Theminimum value at 28 days was 7 5 0 p s i , but this was the only one of
78 values that was under 800 psi. The average value, 1262 psi,
exceeded the 750 p s i requirement by 68 per cent, slightly higher than
t h e excess over requirement f o r the Type S mortar,
There was considerable variation in individual values for both
control and field mortars and t h e observations in Table
JJI
indicatesome of the contributing factors. F o r example, Series A and B
c o n t r o l mortars contained less water per mix (230 v s 240 ml) than
remaining control mortars and t h i s contributed to their higher values
(Avg 1260 vs over-all, avg of 1035 psi). Gubes of field mortar in
Series D,
E, F
and G w e r e frozen during the initial on-site storage-During the period when they were molded, 22 December to 6 January,
the f i r e in the construction shack, where t h e cubes were stored, was
not kept going during the night. W h e n these cubes w e r e brought into
the l a b the crow's foot pattern characteristic of freezing was euident,
and t h e cubes w e r e generally soft. The compressive strength values
were below
average
indicating some damage from freezing, e. g . , thel o w 7-day value (475 p s i ) and the low 28-day value (750 p s i ) occurred
in Series D cubes. Series
E
cubes appeared somewhat different than the other cubes in which freezing was detected, The 7 -day values werehigher, but there was
a
below average increasef
n
strength at 28 days( 3 6 p e r cent vs average increase of 30 per cent). It is possible that
these cubes had attained an initial set b e f o r e freezing occurred and that
freezing retarded subsequent curing, whereas freezing occurred in the
they thawed in the lab. This i s sirpported by the fact that 7 -day values
f o r f r o z e n cubes
w e r e 69
per cent (vs 7 0 per cent over-all) of 28 -day values.The damage from freezing was, however, not n e a r l y as severe
as m i g h t be anticipated in f r e s h mortar i n non-absorbent metal molds
wrapped in polyethylene, conditions designed for maximum retention
of w a t e r in mortar. Two explanations offered f o r the minimum damage
are that the temperature drop below 32°F may not have been sufficient
to cause more than a surf ace freezing, and the entrained air in the
mortar may
have
been beneficial in relieving stresses caused b y an expansion of water frozen in the mortar. Tests on mortars u s e d inSeries J and L cubes produced air content levels in the 12 to 1 2 . 5 per cent range.
It
w i l l also be noted that values f o r Series K cubes w e r esubstantially below average both at 7 and 28 days. On-site observa- t i o n s indicated that it received an abnormal amount of handling during
the t r a n s f e r from the mixer at g r o u n d level t o
the
working face on theeleventh floor. The t o w e r crane was inoperative at the t i m e and the
mortar was raised to the eighth f l o o r by a small crane and then carried
in buckets t o the working face. An above-average water content f o r
samples of this mortar suggests that it w a s probably retempered by
the mason before he could u s e it. A thtrd factor, namely an above-
average aggregate content m a y have also contributed to the lower compressive strength values for these cubes.
Observations
of the miximg
operation during the sampling ofmortar for Series L, M and
N
cubes revealed that the operator wasvarying the a r n o m t of aggregate, Twelve, fourteen and seventeen
shovelsful of
sand
w e r e used respectively in the three batches. Thereduction t o 12 shovelsful in Series
L
mortar was said to bea n
attemptt o eliminate l u m p s in the mortar. The variations, ordered
by
theforeman, may have related to the demand or" the masons ar weather
variations
in
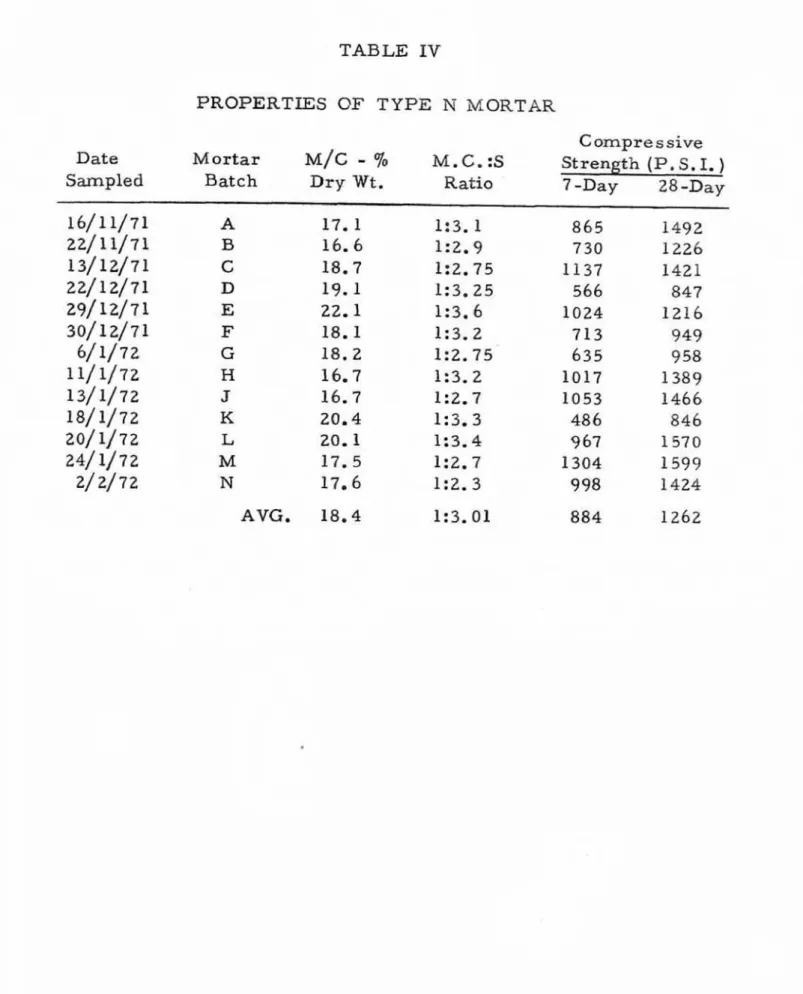
mid-winter (late January to e a r l y February).M o i s t u r e content values and cernentitious material to aggregate
ratio in the plastic mortar and average compressive strength values f o r
2-in. cubes at 28 days, for each of the thirteen batches o f mortar
s m p l e s are listed in Table
IV,
and the compressive strength is plottedagainst the properties of the plastic mortar in Figures
II
andU.
The pattern between these values i s not consistent and there
i s not enough data t o d r a w f i r m cenclusions. The limited data does,
however, suggest that water content (Figure
II)
has a greater influenceon compressive strength than the a g g r e g a t e content ( F i g u r e
IU),
T h eresults indicate the potential value of a a l y s i s 05 the plastic mortar. The time required to obtain mean-ingfui compressive strength re suPts
mortar mixes, especially in load-bearing masonry construction which
moves at a fast pace. The resmlts of moisture content and cementitious material to aggregate ratio t e s t s can be available within 24 hours, and
could be useful as field control t e s t s f o r correcting the mortar mix
as the work proceeds. CONCLUSIONS
(I) There a r e wide variations m a n g individual compressive strength
values for cubes of Type
N
mortar from the field.(2) The variations in values are caused by a n u m b e r of factors or
combinations of factors,
(3) Field t e s t s for moisture content and cementitious material
t o aggregate r a t i o In plastic mortar show some promise as quality control t e s t s f o r on-site u s e ,
TABLE 1
COMPRESSIVE STRENGTH VALUES (PSI)
TYPE
S MORTAR(for each cube
No.
thereis
a control s a m p l e and a field sample)Date
M olded
Cube
No.
Control FieldCube
No.
Control F i e l d N o Control Cubes f o r This s e tTABLE
I4:
COMPRESSIVE STRENGTH
VALUES
[PSI)TYPE
S MORTARMINIMUM AGGREGATE MAXIMUM AGGXEGATE
Date Cube 7-Day Cube 2 8 - ~ a ~ Date Cube 7-Day Cube 28-Day
Melded
No.
Curing
No.
Curing MoldedNo,
C u r i n gNo.
C u r i n gSI S 3 S 5 57 s9
Sl
B
SP3 515 317 S19 S21 523 S25 S27s z 9
A V G
S31 S33 S 3 5 S37 S 3 9 54 1 S43$45
547s49
S5
1 S53 S55 S 57S
59 AVG.
TABLE
LII
COMPRESSIVE STRENGTH V A L U E S (PSI) T Y P E
N
MORTAR(for each cube
No.
thereis
a control sample and a field sample)7-Day Curing
28-Day
CuringDate Cube Cube
Molded No. C o n t r o l Field No. Control Field
W
at e r content oi c o n t r o l cubes r a i s e d from 230 to 240 ml. I32 c u b e s f r o z e n in molds d u r i n g overnight storage in construction shack. Also evidence of freezing in these cubes-
crow" f o o t pattern o b s e r v e dand cubes were
soft when brought into the lab at 24 hours.
TABLE (Conttd) 700 7 2 5
LFZ
665 755LF4
730 675LF6
710755
LF8 7 2 5655
LFlO
725 700LF12
Evidence of freezing. Note-
Control. cubes of mortarfrom site - cubes
molded in l a b - Evidence of freezing. 11/1/72 L H l L H 3 LH5 LH7 LH9
LHl
f
N o freezing. A i r content 1 2 % LJZLJ4
LJ6
LJ8L J l O
LJ12
Big crane broken
mortar raised to
8th floor by
mobile crane then
carried in buckets to l lth floor.
za/l/zz
L L ~ LL3 LL5 LL7 LL9 L L l l Air content 12. 57'0 sand content reduced from i 5 to 12 shovelsful 20°F temp. out side. LLZ LL4LL6
LL8EL10
LL12
14 shovel sful sand 28°F temp. outside.TABLE
111
(Contcd) 1450 17 shovelsful 1425 sand. 1410 1415 1425 1420 AVERAGE VALUESControl
-
7 days-
737 psi (60) High-
1070 psi; Low-
594
p s i . 28 days-
1035"
( 6 0 ) 'L 11385 " ;-
800''
.
7 days
-
910"
{6) t i-
940' # ;
" - 8 8 3 ".
M o r t a r f r o m site.TABLE
IV
PROPERTIES
OF
TYPE
N MORTARCompressive
Date Mortar M / C - % M.C.:S Strength ( P . S .
I,
3
Sampled Batch Dry
Wt.
Ratio
7-Day 28-Pay16/11/71 A 17. 1 1:3.1 8 6 5 1492 22/11/71
B
1 6 . 6 1:2.9 730 1226 13/12/71G
18.7 122.75 11 37 1421 22/12/71D
19.1 1 : 3 , 2 5 566 84729/
12/71E
22.1 l:3-6
1024 1216 3 0 / 1 2 / 7 1F
18.1 1:3.2 713949
6/1/72 G 1 8 . 2 1 : 2 . 7 5 635 958 1l / l / a z
H16-7
1:3,2 1017 1384 13/1/72 J16.7
1~2.7 2053 1466 18/1/72K
20.4 P:3.3 486846
20/1/72 I, 20,1 1:3.4 9 67 1570 24/ 1/72 M 17,5 1:Z.T 1304 1599 2/2/72N
17,6
1:2.39
98
1424-
CSA A82.56REV.
JUNE 1967--
TEST SAMPLE-
F.M.=208
1--- TEST SAMPLlE-
F,M, =203
FIGURE 1 S I E V E A N A L Y S I S-
M A S O N R Y S A N D - S E P T E M B E R 1 9 7 1 ( T Y P E S M O R T A R ) BR tio*z-t1 7 . 0 1 8 . 0 1 9 . 0 2 0 . 0 2 1 . O 2 2 . 0
M O I S T U R E C O N T E N T
-
% DRY W E I G H TMOISTURE C O N T E N T
V S
C O M P R E S S I V E S T R E N G T H ( T Y P EC E M E N T l T l O U S M A T E R I A L : A G G R E G A T E R A T I O P A R T S BY VOLUME
FIGURE
3
CEMENTlTlOUS M A T E R I A L TO A G G R E G A T E R A T lO VS