HAL Id: hal-01306024
https://hal.archives-ouvertes.fr/hal-01306024
Submitted on 22 Apr 2016
HAL is a multi-disciplinary open access
archive for the deposit and dissemination of
sci-entific research documents, whether they are
pub-lished or not. The documents may come from
teaching and research institutions in France or
abroad, or from public or private research centers.
L’archive ouverte pluridisciplinaire HAL, est
destinée au dépôt et à la diffusion de documents
scientifiques de niveau recherche, publiés ou non,
émanant des établissements d’enseignement et de
recherche français ou étrangers, des laboratoires
publics ou privés.
electro-hydrodynamic bidirectional flows in viscoelastic
liquids
Hubert Ranchon, Rémi Malbec, Vincent Picot, Audrey Boutonnet, Pattamon
Teerapanich, Pierre Joseph, Thierry Leichle, Aurélien Bancaud
To cite this version:
Hubert Ranchon, Rémi Malbec, Vincent Picot, Audrey Boutonnet, Pattamon Teerapanich, et al..
DNA separation and enrichment using electro-hydrodynamic bidirectional flows in viscoelastic liquids.
Lab on a Chip, Royal Society of Chemistry, 2016, 16 (7), pp.1243-1253. �10.1039/c5lc01465d�.
�hal-01306024�
PAPER
Cite this:Lab Chip, 2016, 16, 1243
Received 1st December 2015, Accepted 18th February 2016 DOI: 10.1039/c5lc01465d www.rsc.org/loc
DNA separation and enrichment using
electro-hydrodynamic bidirectional flows in viscoelastic
liquids
†
Hubert Ranchon,
abRémi Malbec,
abVincent Picot,
cAudrey Boutonnet,
cPattamon Terrapanich,
abPierre Joseph,
abThierry Leïchlé
aband Aurélien Bancaud*
abDNA size separation followed by purification and enrichment constitute essential operations for genetic engineering. These processes are mostly carried out using DNA electrophoresis in gels or in polymer solu-tions, a well-established yet lengthy technique which has been notably improved using Lab-on-Chip tech-nologies. So far, innovations for DNA separation or enrichment have been mostly undertaken separately, and we present an approach that allows us to perform these two processes simultaneously for DNA frag-ments spanning 0.2–50 kilo base pairs (kbp) in length. Our technology involves an electric field and a coun-ter hydrodynamic flow in viscoelastic liquids, in which we show the occurrence of transverse forces ori-ented toward the walls. These forces increase with DNA molecular weight (MW) and hence induce a progressive reduction in DNA migration speed that triggers size separation in microfluidic channels as well as in capillaries. The separation of MW markers in the range 1–50 kbp is achieved in 15 minutes, thus outperforming gel electrophoresis that takes∼3 hours for this sample. Furthermore, the use of a funnel, where electric and flow fields are modulated spatially, enables us to adjust the transverse forces so as to stall the motion of DNA molecules at a position where they accumulate at factors of up to 1000 per min-ute. In this configuration, we establish that the operations of DNA enrichment and separation can be car-ried out simultaneously for the bands of a DNA MW marker between 0.2–1.5 kbp diluted at 0.02 ng μL−1in 30 s. Altogether, our technology, which can readily be integrated as an in-line module in Lab-on-Chips, of-fers unique opportunities for sample preparation and analysis of minute genomic samples.
Introduction
Electrophoretic separation of DNA is a key process of molecu-lar biology, which is used for both preparative and analytical operations. DNA electrophoretic mobility is essentially con-stant with the size of the molecule in bulk, requiring the use of separation matrices to obtain size-dependent transport properties.1 Separation matrices can be constituted of poly-mer solutions/gels or regular arrays of micro or nano-posts etched in glass or silicon.2 The development of nanostruc-tures for DNA analysis has constituted a mainstream research orientation for Lab-on-Chip technologies,3and these research studies resulted in good separation performance with contin-uous4or pulsed fields.5 This success has also stimulated the development of novel strategies, including among others
“entropic trapping”,6in which the matrix consists of
consecu-tive deep and shallow trenches etched in silicon that form en-tropic energy barriers crossed more rapidly by longer chains. These technologies however did not prove to be sufficiently robust for their adoption by the molecular biology commu-nity, and the standard system for high-performance DNA analysis consists of capillaries of ∼100 μm diameter filled with concentrated polymer solutions.7 The super-low disper-sion of capillary electrophoresis, which is sufficient to reach single base resolution,7 has played a key role in sequencing technologies.8
Efforts have been concomitantly devoted to the develop-ment of matrix-free separation technologies. Cyclic hydrody-namic and electrophoretic actuation has been shown to in-duce DNA radial migration towards the walls of capillaries.9 Due to the dependence on DNA size of transverse migration forces, it has been suggested that this approach was relevant for separation. In fact, improved separation performance has been reported using continuous hydrodynamic flow actuation in confined capillaries of ∼5 μm.10,11 This strategy turned out to be reminiscent of hydrodynamic chromatography,12in which separation is triggered by steric constraints that repel
aCNRS, LAAS, 7 avenue du colonel Roche, F-31400 Toulouse, France. E-mail: [email protected]
bUniv de Toulouse, LAAS, F-31400 Toulouse, France
cPicometrics Technologies, 478 rue de la Découverte, Miniparc Bât 1, 31670 Labège, France
† Electronic supplementary information (ESI) available. See DOI: 10.1039/ c5lc01465d
Published on 19 February 2016. Downloaded by Universite Paul Sabatier on 22/04/2016 09:57:54.
View Article Online
large molecules from the walls where the flow velocity is faster. Whether steric repulsion or radial migration is in-voked, the mechanism of matrix-free separation relies on concentration modulations in the channel cross section. Interestingly, concentration variations of spherical tracers13,14 and DNA15 could also be detected using viscoelastic fluids flowing in microchannels.16Particles accumulate toward the centerline due to transverse viscoelastic forces, which have been characterized both experimentally and theoretically.17,18 Using numerical analysis for a particle fixed in place by an additional force field, Lee and co-workers noted that (i) cross stream forces could be oriented toward the walls, and (ii) the amplitude of the resulting transverse force would be much higher than for a freely suspended particle.19 We reasoned that this conjecture could be tested experimentally using electrophoresis continuously acting opposite to the flow di-rection in order to stall the motion of charged solutes, and hence generate transverse viscoelastic forces oriented toward the walls. Using single particle tracking of nanoparticles or λ-DNA molecules of 50 kbp, we demonstrate that the combi-nation of hydrodynamic and electrophoretic actuations pro-vides an efficient solution to monitor the amplitude of visco-elastic forces. We then establish the conditions for high performance DNA separation in microfluidic chips as well as in capillaries with this technology. We finally show that the operations of DNA enrichment and separation can be carried out simultaneously using spatial modulations of the flow and the electric field in a microfluidic funnel. The overall perfor-mance of our technology, as characterized by the concentra-tion enrichment factor of∼103 per minute and the separa-tion of a molecular weight DNA marker including fragments ranging from 1 to 48.5 kbp in less than 17 minutes, offers a versatile toolbox for DNA analysis in Lab-on-Chips.
Experimental regime
The viscoelastic fluid was composed of a low conductivity buffer for electrophoresis (2× TBE, see methods) supplemented with variable proportions of poly-vinylpyrrolidone (PVP, 360 kDa) spanning 0.1–5% (m : v) filtered at 0.2 μm. PVP was used for its coating properties, which reduce the strength of electro-osmotic flow,20 as well as its viscoelastic properties above the entanglement threshold of ∼0.7%.21,22 The concentration of PVP was set to 2% in most experiments. The corresponding viscosity and elastic relaxation time wereη ∼ 5.5 mPa s and λ ∼ 15 ms, respectively (Fig. S1†).
We used silicon chips of h = 2–10 μm and w = 200 μm height and width (see details of the fabrication in ref. 23), or glass capillaries of inner diameter D ∼ 10–75 μm (Fig. 1A). The length L of the separation channel was 0.5 and 12 cm for microfluidic chips and capillaries, respectively. The electric field E was tuned in the range 0.2–5 kV m−1, and the maxi-mum flow velocity v0 spanned 100–3000 μm s−1. Inertial
forces were negligible because the Reynolds number was in the range of 10−5–10−2. The Deborah number De, which mea-sures the product of the fluid relaxation time and the shear
rate ∼ v0/h ∼ 30–300 s−1, was ∼0.5–5, implying that the
elasticity of the fluid had to be considered to describe the transport of DNA or particles.24
Qualitative model of cross stream viscoelastic forces
We propose to qualitatively describe the physics of cross stream migration acting on particles or DNA in the context of electrohydrodynamic actuation. We start from the argument of Leshansky and collaborators,13which postulates that the trans-verse viscoelastic force is determined by the normal stress dif-ference N1=σzz− σxx(see Fig. 1A for geometry). For a Maxwell
fluid, such as a solution of PVP,16N1is expected to scale with
the square of the shear rate, as defined by ∼ ∂vx/∂z. The
physical basis of this model is that shearing of the fluid leads to an excess of elastic stress stored by the polymer around a particle, which in turn induces lateral movements toward re-gions with minimal shearing so as to reduce the elastic ener-getic penalty.
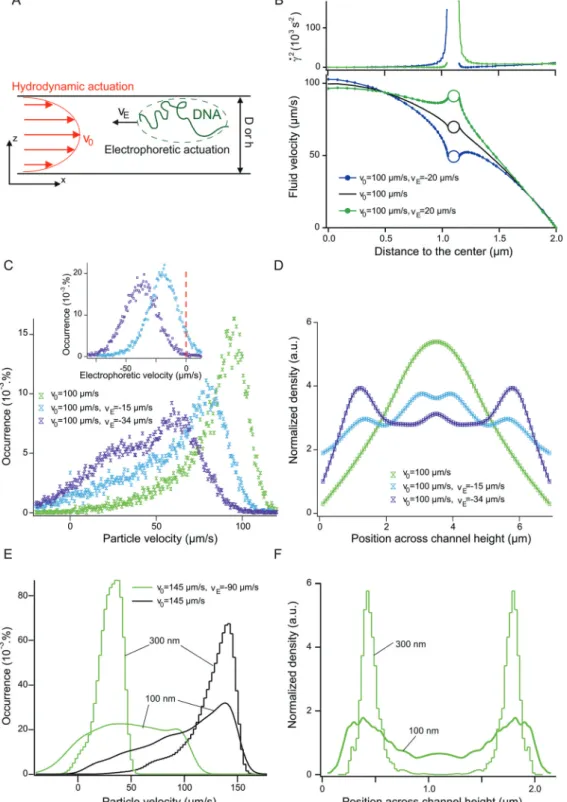
We then propose to evaluate the spatial dependence of the viscoelastic force by finite element modeling. We consider a charged bead of 100 nm diameter transported in a micro-channel of h = 4μm (Fig. 1). We assume that the effective ve-locity of a particle is defined as the sum of hydrodynamic and electrophoretic velocities. Disregarding rotational move-ments of the bead and hydrodynamic interactions, we sug-gest that (i) Faxen law25describes the hydrodynamic compo-nent of the effective speed, and (ii) a flat velocity profile along the vertical axis can be used to model electrophoresis (see the Methods section). Finally, we compute the flow around one particle placed in hydrodynamic or electro-hydrodynamic flow fields by solving 2D creeping flow equa-tions with finite element methods (lower panel in Fig. 1B). Upon application of an electric field, the shear rate at the vi-cinity of the bead is enhanced near the centerline or near the wall (upper panel of Fig. 1B) depending on whether the parti-cle is slowed down or accelerated (blue and green datasets), respectively. Consequently, the amplitude of the electric field modulates the shear around the particle, and so the trans-verse viscoelastic force. We therefore suggest that the applica-tion of an electric field allows us to control the direcapplica-tion and the amplitude of cross stream forces in viscoelastic fluids. Cross stream forces acting on nanoparticles
We decided to characterize the transport of 200 nm particles conveyed in rectangular channels of h = 7μm height and w = 300 μm width filled with a 2% PVP solution. We used wide field velocimetry and extracted the longitudinal velocity distri-bution (Fig. 1C). The pressure drop was set so that the peak of the velocity distribution was at∼100 μm s−1(green dataset in Fig. 1C), and the corresponding average speed was 83μm s−1. The negative charge of the tracers, which is characterized by a surface potential of−41 ± 2 mV (Malvern ZetaSizer), allowed us to combine electrophoresis and hydrodynamics. The electric field was first adjusted to force particle migration at 30μm s−1 in the direction opposite to the flow (purple dataset in the
Fig. 1 Transverse migration of nanoparticles in viscoelastic fluids. (A) Representation of the experiment, in which DNA transport is simultaneously actuated with hydrodynamics and electrophoresis. (B) In the lower panel, the plot represents the flow field around a 100 nm particle transported by a Poiseuille flow of maximum velocityv0= 100μm s−1in a 4μm-thick channel (black dataset obtained from finite element modeling). The particle
repre-sented by a circle is placed at an arbitrary position midway through the wall and the centerline. Upon application of an electric field that conveys the particle at ±20μm s−1, the shear stress around the particle is enhanced on the side facing the wall or the centerline, depending on whether the particle is accelerated or slowed down (upper panel). (C) The three histograms represent the velocity distribution of 200 nm tracers transported in 7μm-thick channels with hydrodynamic (green dataset) or electro-hydrodynamic actuation (cyan and purple datasets). The corresponding histograms in the inset represent the velocity distributions for electrophoretically-driven nanoparticles. Note the Gaussian shape of the distributions with electrophoresisvs. the skewed curve detected for electro-hydrodynamics. (D) The three curves represent the spatial distribution of tracers across the channel height for the same conditions as in panel (C). (E) The graph shows the behavior of 100 nm and 300 nm tracers (smooth or cityscape plots, respectively) transported in microchannels of 2.2μm height with hydrodynamics or electrohydrodynamics (black and green datasets, respectively). (F) The spatial distribution of tracers across the channel height indicates the stronger accumulation of 300 nm beads towards the walls for the same set of actuation parameters.
inset of Fig. 1C), and the two fields were then actuated simul-taneously. The shape of the resulting velocity distribution was flattened (purple dataset in Fig. 1C), and the average speed de-creased more rapidly than the linear subtraction of hydrody-namics and electrophoresis from 83 to 43μm s−1. Further, as described in ref. 26 the analysis of the shape of velocity distri-butions enabled us to measure the particle distribution across the channel height with no adjustable parameter. Focusing to-ward the channel centerline occurred without electrophoresis (Fig. 1D), in agreement with earlier studies,15whereas an accu-mulation of particles towards the walls was detected in the presence of an electric field acting opposite to the flow. These experiments therefore confirmed that the orientation of cross stream forces could be monitored with combined electropho-retic and counter flow.
We then investigated the size dependence of cross stream forces using tracers of 100 and 300 nm co-flowing in a channel of 2.2 μm height. The particles were identified according to their relative difference intensity (not shown), and the respec-tive velocity distributions were extracted. Without electrophore-sis, both velocity distributions were peaked at 140μm s−1, al-though that of 300 nm particles was expectedly sharper due to their focusing at the centerline. Given that these tracers have similar surface potentials of−40 ± 2 mV and hence comparable electrophoretic mobilities (not shown), we assayed the effect of electro-hydrodynamic actuation. A narrowly-peaked velocity dis-tribution was obtained for 300 nm particles, whereas that for 100 nm tracers was flat in comparison (Fig. 1E). The associated concentration profiles indicated the sharp accumulation of 300 nm particles towards the walls (Fig. 1F). In turn, this experi-ment highlighted that the relative difference in velocity between the two types of particles (v300− v100)/v300decreased from +18%
without electrophoresis to −65% with the electric field, and suggested that the simultaneous use of an electric field and a counter flow offered an efficient strategy for size separation. Cross stream forces acting on DNA
We subsequently inquired whether cross stream forces could also be observed with DNA molecules. To this aim, we tracked the motion of fluorescently labeled DNA molecules (∼50 kbp). The velocity distribution was recorded in a 2μm-thick chan-nel at a constant pressure drop of 10 bar m−1and for a range of electric fields spanning 0–2.5 kV m−1(Fig. 2A). The corre-sponding mean hydrodynamic velocity was 230μm s−1(yellow histogram in Fig. 2A), and the electrophoretic velocity varied from 0 to 60μm s−1, i.e. less than 25% of the hydrodynamic flow speed. The consequences of cross stream forces could readily be assessed from the sharp decrease in velocity that was much greater than the linear subtraction of the electro-phoretic speed (indicated by colored arrows in Fig. 2A). This trend was similarly detected in the plot of DNA average veloc-ity as a function of the electric field (Fig. 2B), which showed an initial slope 17 times steeper than expected without cou-pling between hydrodynamics and electrophoresis (dashed lines). Further, we wished to directly demonstrate the prefer-ential localization of DNA near the walls. The electric field
was adjusted to reach the stagnation point shown in Fig. 2B. We then characterized the vertical position of DNA molecules stopped in the field of view of the microscope by recording a series of stacks separated by 330 nm across a channel of 2 or 12 μm thickness (Fig. 2C). The average intensity distribution for 20 molecules was characterized by a bi-modal shape (graph in Fig. 2C), confirming the accumulation of DNA near the walls due to viscoelastic transverse forces. Furthermore, we noted that the velocity distribution of molecules close to the walls, i.e. in the high electric field regime, was narrower than in the absence of an electric field (light green vs. red his-tograms in Fig. 2A). This effect was qualitatively coherent with the confinement of DNA at the walls. Indeed Taylor disper-sion, which defines the diffusivity in pressure-driven flows, is proportional to with v02h2 divided by the diffusion
coeffi-cient.27 Confined molecules only explore a fraction of the channel at a reduced velocity; hence, the effective height and velocity with transverse viscoelastic forces that are relevant to estimate Taylor dispersion are smaller than h and v0. In order
to quantitatively characterize the reduction in diffusivity, we normalized the breadth of the velocity distribution along the x axis to that obtained in the y direction (see Fig. 1A for geom-etry), in which Brownian diffusion was only contributing to dispersion. This data, shown in the inset of Fig. 2B, established that the amplitude of fluctuations was reduced by a factor of ∼7 with electro-hydrodynamic actuation. Hence, our technology appeared to overcome the limitation of Taylor dispersion in pressure-driven flows for microfluidic separa-tion, which has so far met limited success without the use of confined channels.28,29
Finally, we investigated the potential of electrohydrodynamic flows for size-based separation by assaying the behavior of two DNA species of 48.5 and 5.4 kbp (λ-DNA and φX174, respec-tively) simultaneously conveyed in a microchannel of 2μm. We extracted their respective velocity distributions (Fig. S2†) and evaluated the relative difference in speed as a function of the ratio β, which was defined by the electrophoretic velocity di-vided by the mean flow velocity 2/3v0 (Fig. 2D). Without an
electric field, the migration ofλ-DNA was expectedly faster than that ofφX174 due to the enhancement of viscoelastic focusing toward the channel centerline for high molecular weight mole-cules, as was reported in ref. 15. Note however that dispersion was maximal; hence, separations were unfavorable in this re-gime (see more below). With electrophoresis, the orientation of cross stream forces towards the walls changed the migration order. The maximal difference in velocity between λ-DNA and φX174 was ∼30% using a low flow velocity of v0 ∼ 80 μm s−1
(red dataset in Fig. 2D), suggesting that the actuation parame-ters could be tuned to enhance the performance of DNA size separation experiments.
DNA size separation
We then focused on DNA separation using three DNA molecu-lar weight (MW) markers conveyed in custom-made micro-fluidic chips or in capillaries. The main difference between these technologies is associated with the length of the
Fig. 2 Transverse migration of DNA in viscoelastic fluids. (A) In the left panel, the graph shows the velocity distributions obtained forλ-DNA mole-cules flowing in 2μm-thick microchannels for a constant pressure drop and electric fields of variable amplitudes. The electrophoretic mobility is represented by the set of arrows in the inset. The plot in the right panel represents the average velocity ofλ-DNA as a function of the electric field. The stagnation point corresponds to the conditions in which hydrodynamic and electrophoretic forces are in balance and the velocity of the mole-cules is null. The lower and upper dashed lines correspond to the initial variation in velocityvs. that expected for a constant hydrodynamic trans-port and an electrophoretic mobility of 2.5× 10⁻⁴cm2V s−1, respectively. The inset shows the ratio of the standard deviation of the velocity
distri-bution in the longitudinalvs. lateral direction as a function of the electric field. (B) In a chip of 12 μm height, the position of λ-DNA molecules arrested in the field of view of the objective is measured using a series of stacks (3 representative images are shown at the top). The graph below represents the average intensity distribution for 20 molecules, which appear to be predominantly located at the walls of the channel. (C) The rela-tive velocity difference betweenλ-DNA and φX174 molecules, as inferred from single particle tracking, is plotted as a function of the electric field normalized to the mean flow velocity.
separation channel, which was at least 12 cm for the Agilent Capillary Electrophoresis vs. 0.5 cm for our microfluidic de-vices. Given the sieving properties of PVP for DNA separation,30 we started with conventional electrophoresis carried out in a 10 μm capillary filled with a 2% PVP solution. Most bands of a kb-ladder were resolved in∼50 minutes with an electric field of 3 kV m−1 (left panel of Fig. 3A). We then optimized electro-hydrodynamic actuation parameters in the same capillary (see Fig. S3† for the optimization strategy) and resolved the bands of the separation standard in less than 30 minutes (middle panel of Fig. 3A). The resolution of the separation in viscoelas-tic fluids between the 0.5 and 10 kb fragments was enhanced, 28.0 using electro-hydrodynamics vs. 17.8 with electrophoresis (see Methods for definition). Further, according to our model of separation based on transverse viscoelastic forces, these ex-periments could be carried out in channels with minimal con-finement, e.g. in a capillary of inner diameter D∼ 75 μm. In-deed, the bands spanning between 1 and 48.5 kbp were resolved
in less than 17 minutes with electro-hydrodynamic actuation (right panel of Fig. 3A). This time to result compares well with the run time of 3 hours in slab gels, as reported by the supplier for this MW marker. Conversely, high-performance capillary electrophoresis using polymer blends as a separation matrix allows one to reach a time to result of 2 minutes for DNA molecules in the size range 0.2–20 kbp.31
We subsequently investigated the separation mechanism in microfluidic chips of 2 μm thickness. The pressure was set at 10, 25, and 150 bar m−1in order to resolve DNA bands in the range 0.5–10 kb (Fig. 3B). Optimal results were obtained for a mean flow velocity of 220μm s−1and an electrophoretic speed of 45 μm s−1, allowing us to complete the separation in∼7 minutes (middle panel of Fig. 3B). Furthermore, the modula-tion of the flow rate towards high or low velocities enabled us to improve the resolution of the separation for high or low molecular weight (MW) molecules, respectively (right and left panels of Fig. 3B). Using a low flow rate (purple
Fig. 3 DNA separation using electro-hydrodynamic actuation. (A) The curves in the left and in the middle report electropherograms obtained for the separation of a kb-ladder by electrophoresis alone or electrohydrodynamic actuation, respectively, using capillary electrophoresis in 10μm tubes. The electropherogram in the right shows the separation of a kb-extend DNA ladder by electrohydrodynamic actuation in a 75μm capillary. (B) The three graphs show electropherograms recorded in 2μm-thick microchannels under different actuation conditions, as indicated in the inset. Note that the curve in the left is obtained with the 100-bp ladder and the others with the kb-ladder. (C) The plot represents DNA velocity normal-ized to the maximum flow velocityv0of 0.9, 0.22, and 0.58 mm s−1as a function of DNA MW (purple, black, and green datasets, respectively). Note
the correspondence of the colors with the electropherograms in (B). The dashed curve corresponds to the result of capillary electrophoresis (graph in the middle of (A)). (D) The graph recapitulates the variation of the velocity as a function of MW for all the electropherograms shown in (A) and (B). (E) The theoretical plate number per meter is reported as a function of DNA MW for different experimental conditions, namely electrophoresis (red curve), electrohydrodynamic actuation in chips or capillaries (dashed and blue curves, respectively).
curve, right panel in Fig. 3B), the cross flow migration force was insufficient to modulate the velocity of molecules shorter than ∼2 kb, which reached the detector in a single peak characterized by a speed roughly equal to the linear combination of hydrodynamics and electrophoresis (not shown). In order to recapitulate the three experiments in Fig. 3B, we computed the ratio of DNA speed to the mean flow velocity as a function of MW (Fig. 3C). For each condi-tion, we observed a monotonic decrease in DNA speed, which was associated with the onset of transverse forces with DNA size. The three curves also exhibited a sharp velocity de-crease in a size range that could be tuned by adjusting the pressure drop and the electric field. Hence, the modulation of transverse forces in electro-hydrodynamic separation pro-vided an efficient solution for DNA size analysis. Further-more, we checked that transverse forces were predominantly determined by the shear rate by plotting the results obtained in 10 μm capillaries (middle panel of Fig. 3A) at the same shear rate of ∼110 s−1, which were nearly coincident with the data obtained in microfluidic chips (dashed and black curves in Fig. 3C). Altogether, this set of data confirmed the relevance of electro-hydrodynamic actuation for DNA separa-tion in the size range 0.5–50 kbp.
Finally, we evaluated the performance of our separation strategy by plotting (i) the DNA velocity and (ii) the theoretical plate number per meter N (ref. 32) as a function of MW (see Methods for definition, Fig. 3D and E). The first plot showed the weak variation of DNA electrophoretic mobility (red dataset in Fig. 3D) in comparison with the responses obtained with electro-hydrodynamic actuation. The typical scaling exponent of≃2 (dashed line) was in fact much more favorable for separa-tion than that of convensepara-tional electrophoresis (−1).1 In turn, this result explained that the bands of a kb ladder could be re-solved in a chip with a separation channel of only 0.5 cm. We subsequently estimated N, which spanned 103–7.10 × 10⁵ and appeared to be slightly smaller than with electrophoresis (red dataset in Fig. 3E). Optimal results of N∼ 2.10 × 10⁶obtained with electrophoresis in Lab-on-Chips30,33 confirmed the trend that the peaks of our separations were broader for a given sepa-ration time than those obtained with electrophoresis. We explained this result by the residual band broadening associ-ated with Taylor dispersion near the walls of electro-hydrodynamic actuation (see e.g. inset of Fig. 2B). Notably, this interpretation was supported by the low values of N obtained in capillaries (lower blue dataset in Fig. 3E): the overly long separa-tion channel was associated with prolonged run times, hence with more dispersion of the peaks. Consequently, the key fea-ture of our technology lies in the sharp variations of DNA veloc-ity with its MW, which are partly balanced by band broadening effects associated with hydrodynamic actuation.
Simultaneous separation and enrichment
Finally, we hypothesized that electro-hydrodynamic actuation could be used to enrich DNA in a funnel. According to con-servation laws, the electric and flow fields increase propor-tionally in a constriction except at the vicinity of the apex
(Fig. 4A). In the parameter space (E, v0), the trajectory of DNA
molecules located at the center of the channel (black arrow in Fig. 4A) follows a line starting from low values of (E, v0),
i.e. near the origin (Fig. 4B). Using a set of actuation parame-ters appropriately defined, the migration regime is domi-nated by hydrodynamics far from the funnel, so that trans-port ahead of the funnel is oriented towards this structure. As the molecule progresses toward the apex, the flow velocity increases and transverse viscoelastic forces build up, leading to the progressive decrease of its effective velocity until it reaches the stagnation point where electrophoretic and hy-drodynamic forces balance (green circle in Fig. 4B). Past this position, conversely, DNA transport is forced by electrophore-sis and oriented backwards to the stagnation point, therefore defining a region in which DNA enrichment occurs. More-over, the enhancement of viscoelastic forces with DNA MW is expected to lead to size dependent stagnation positions (Fig. S4A†), allowing us to perform separation and enrichment op-erations simultaneously. Note that this approach is reminis-cent of several technologies with electric fields and counter flows, yet all developed with Newtonian fluids so that electric fields at least 10 times greater are necessary (Fig. S4B†). First, DNA concentration has been achieved by flowing a sample in a capillary tube, in which electrodes are incorporated by gap junctions.34–36 DNA molecules are stalled by electrophoresis in between the gap junctions. In another direction, electro-osmotic flows in balance with counter hydrodynamic flows have been exploited to enrich (i) DNA in a capillary filled with a gradient concentration of polymers37or (ii) microparticles in a microfluidic chip with a constriction.38
To validate this hypothesis, we conveyed the 100 bp ladder in a funnel of 2 μm thickness. An increase in fluorescence intensity was detected after 30 seconds (Fig. 4C), and three bands could be isolated together with a broad unresolved pattern at the constriction. Assigning the pressure drop and the electric field to lower or higher intensities allowed us to resolve 2 or 5 bands, respectively (left and middle panel of Fig. 4D, Video S1†). Given that the conditions to reach the stagnation position require increasingly high electric and pressure fields for low MW molecules (Fig. S4A†), we con-cluded that the high molecular weight bands of 1500, 1000 and 800 bp were resolved in Fig. 4C. In order to detect 8 bands out of 9 of the 100 bp ladder, we used a shallower funnel of 1μm and higher PVP concentrations of 4% with 7 bar of pressure difference (right panel of Fig. 4D). Size sepa-ration was achieved in ∼30 s (Video S2†) and DNA enrich-ment by a factor of ∼50 per minute was detected for the 300 bp lane for an initial DNA concentration of 0.03 ngμL−1(Fig. S4C†). Focusing on enrichment kinetics, we measured the to-tal fluorescence over time for the bands of 1500, 1000 and 800 bp highlighted in Fig. 4C, and deduced that the enrich-ment rate of 12-, 30-, and 42-fold per minute (left panel of Fig. 4E) was uncorrelated with the concentration of each lane of 13.5, 16.5, and 25 ng μL−1, respectively. We suggest that this discrepancy was associated with the difference in effec-tive velocity between the different DNA species during their
Fig. 4 DNA enrichment and separation in a funnel. (A) In the left panel, the amplitude of the electric and flow fields is predicted by 3D finite element modeling (upper and lower graphs). The electron micrograph in the right represents the funnel just before sealing. (B) The graph depicts our strategy for a molecule transported along a streamline in the middle of the channel (fire colored line in (A)). Starting from low electric and flow fields, the molecule travels to regions where mechanical constraints are high, as indicated by the arrow, until its velocity becomes null (circle). (C) The time series shows DNA enrichment and band formation in a funnel for a set of values of pressure and electrophoretic forces. (D) The four micrographs correspond to the result of enrichment experiments after 30 seconds for different actuation parameters indicated in the inset. The channel depth is 2μm for the three images at the left and 1 μm for the micrograph in the right. (E) The plots represent the build-up in intensity over time for different bands and a given set of actuation parameters, or the same band with different actuation parameters (left or right panel, respectively). Note that the signal decreases to zero as soon as the electric field is stopped, as shown by the sudden drop in intensity after 40 s in the right panel.
transport ahead of the constriction. Bearing in mind that the concentration factor was size dependent, we focused on the optimization of this parameter by tuning the pressure and the electric field (right panel of Fig. 4E) and reached en-richment rates of 103 per minute (Fig. S4D†). We wished to compare these results to those obtained with electrokinetic trapping, in which electroosmosis and electrophoresis act in opposition for DNA concentration,39,40 or with dielectro-phoretic trapping of molecules in electric field gradients.41,42 While enrichment factors of 60-fold per minute have been achieved with the former method, state-of-the-art concentra-tion rates of more than 105per minute were reported in nano-fabricated structures.41 Therefore, our technology, which, to the best of our knowledge, has a unique potential for simulta-neous separation and concentration operations, compares fa-vorably with electrokinetic trapping, but does not compete with the performance of dielectrophoresis. However, this disadvan-tage is compensated for by the simplicity of the fabrication process that only involves one step of photolithography. Alto-gether, we have demonstrated that electro-hydrodynamic actua-tion offers unique perspectives to simultaneously complete the operations of DNA enrichment and separation on a chip.
Conclusion
We have established the conditions for DNA separation and en-richment in electro-hydrodynamic bi-directional viscoelastic flows. Transverse forces oriented towards the walls constitute the driving mechanism of DNA manipulation. Our strategy therefore appears to be reminiscent of field-flow fractionation (FFF) techniques, in which separation in a Poiseuille flow is achieved through cross stream forces.43In contrast to FFF, how-ever, transverse forces are induced by co-linear hydrodynamic and electric fields, and their amplitude can readily be moni-tored with conventional fluidic actuation technologies. In addi-tion the viscoelastic soluaddi-tion, which is composed of the cheap, biocompatible, and broadly accessible synthetic polymer PVP, is characterized by a moderate viscosity that is compatible with fluid manipulation in Lab-on-Chips. Our technology hence pre-sents an opportunity for a variety of developments in genomic analysis in miniaturized systems. Future improvements of sepa-ration and/or enrichment performance may be achieved by investigating the relationship between the resolution of sepa-rations and the fluid viscoelastic properties. Indeed, the fluid characteristics can be monitored by tuning the molecu-lar weight and/or the concentration of dissolved polymers, e.g. PVP or poly-ethylene oxide, in order to modulate the amplitude of transverse migration forces. This approach is consistent with the rigorous formulation of the separation matrix with polymer blends for ultrafast separation of long DNA fragments by capillary electrophoresis.31 More gener-ally, the conception of a model of DNA transport, in which the fluid properties, the geometry of the channel and the ac-tuation parameters are determined for high-performance DNA separation and enrichment, is highly desirable to con-solidate our technology. With these guidelines, the
separation and enrichment of other biomolecules, such as proteins or RNA strands, may be investigated experimentally under purified conditions, and maybe also in complex me-dia, such as blood or plasma.
Methods
Chemicals and reagents
Molecular biology grade chemicals were purchased from Sigma-Aldrich (France). The buffer for our experiments was TBE 2× (Tris-HCl 160 mM, boric acid 160 mM, EDTA 5 mM, pH = 8.3). Fluorescent nanoparticles were obtained from BangsLabs (Polysciences). Their zeta potential was measured with a Malvern ZetaSizer. We used four different DNA ladders (Fig. S3†), namely ExactLadder DNA PreMix 100 bp Plus (Ozyme) for enrichment experiments, and 100 bp & 1 kb DNA ladder (NEB) or 1 kb Extend DNA Ladder (NEB) for size sepa-ration, as well as Lambda DNA and the linearized plasmid φX174 supplied by NEB. The DNA concentration was set to 10 ngμL−1in separation experiments, 0.5 ngμL−1in enrichment experiments, and 0.5 ngμL−1for single particle tracking. The fluorophore YOYO-1 was purchased from Thermofisher, and used at a DNA : YOYO-1 staining ratio of 10 : 1. 2% Dithio-threitol was added to the buffer for single molecule imaging in order to reduce photocleavage.
Imaging set-up and electropherograms. Imaging was performed with a Zeiss epifluorescence microscope equipped with a 38HE filter set, and a Lumencor Light Engine emitting at 475 nm with a bandwidth of 28 nm. For single particle tracking experiments with DNA or nanoparticles at a volume fraction of 10−5, we used a 100× or 20× objective with numeri-cal apertures of 1.4 and 0.75, respectively. An ANDOR iXon-885 camera was used with a binning of 2× 2. Pressure was moni-tored with an MFCS controller (Fluigent, Paris) delivering up to 1 or 7 bar, and electric fields were controlled with a 300 V DC supplier. Capillary electrophoresis was carried out with a 7100 Capillary Electrophoresis system (Germany) equipped with a Zetalif LED 480 nm detector (Picometrics Technologies, France). Capillaries of different diameters were purchased from Polymicro Technologies (Phoenix, US). YOYO-1 labeled DNA injection (10 ngμL−1) was carried out for 5 seconds at an electric field of 30 kV m−1in the sample reservoir. Electrophe-rograms were obtained by recording intensity temporal evolu-tion at a distance of 12 cm from the inlet.
For experiments in microfluidic chips, we recorded time series and analyzed images following two different strategies. On the one hand, DNA or particles were isolated by intensity-based segmentation performed in ImageJ. Trajectories were subsequently reconstructed using Particle Point Analysis in Matlab (MATWORKS), and velocity distributions were extracted, as described in ref. 26. In order to monitor the dis-tribution of λ-DNA molecules across the channel height in Fig. 2C, we measured the fluorescence intensity of single molecules in the consecutive stacks along the z-direction and then averaged the signal. On the other hand, intensity mea-surements were carried out to extract electropherograms.
Enrichment factors (EF) for individual bands in the funnel were also computed by measuring the total intensity in one band IIJt) at each time point normalized by:
(1)
with I0and IBGthe initial intensity of the band and the
back-ground signal for the buffer flowing in the chip, respectively. Analysis of separation experiments. The performance of separations was evaluated by measuring the separation time tDNAand the peak width at half maximum wDNAfor each peak
in electropherograms, and we evaluated the theoretical plate number per meter:
(2)
with lsepthe length of the separation channel. The resolution
of the separation between species 1 and 2 was defined by: (3)
ODE modeling. Using COMSOL, we solved creeping flow equations in 2D with a particle conveyed by a flow field and an electric field. The bead effective velocity was assumed to be the linear combination of Faxen law and electrophoresis, according to:
(4)
with a the radius of the particle and vE the electrophoretic
velocity.
Acknowledgements
We thank F. Ginot and L. Saias for critical reading of the manuscript, and B. Lonetti for technical help in rheological measurements. H. R. thanks the French Ministry of Research for funding. This work was partially funded by the Toulouse Tech Transfer program μLAS, and by the ANR projet JC08_341867. This work was also supported by the LAAS-CNRS technology platform, a member of the French Basic Technology Research Network.
References
1 J. L. Viovy, Rev. Mod. Phys., 2000, 72, 813–872.
2 W. D. Volkmuth and R. H. Austin, Nature, 1992, 358, 600–602. 3 K. D. Dorfman, Rev. Mod. Phys., 2010, 82, 2903–2947. 4 N. Kaji, Y. Tezuka, Y. Takamura, M. Ueda, T. Nishimoto, H.
Nakanishi, Y. Horiike and Y. Baba, Anal. Chem., 2004, 76, 15–22. 5 O. Bakajin, T. A. J. Duke, J. Tegenfeldt, C.-F. Chou, S. S. Chan, R. H. Austin and E. C. Cox, Anal. Chem., 2001, 73, 6053–6056.
6 J. Han and H. G. Craighead, Science, 2000, 288, 1026–1029. 7 M. N. Albarghouthi and A. E. Barron, Electrophoresis,
2000, 21, 4096–4111.
8 A. T. Woolley and R. A. Mathies, Anal. Chem., 1995, 67, 3676–3680.
9 J. Zheng and E. S. Yeung, Anal. Chem., 2002, 75, 3675–3680. 10 K. J. Liu, T. D. Rane, Y. Zhang and T.-H. Wang, J. Am. Chem.
Soc., 2012, 133, 6898–6901.
11 X. Wang, V. Veerappan, C. Cheng, X. Jiang, R. D. Allen, P. K. Dasgupta and S. Liu, J. Am. Chem. Soc., 2010, 132, 40–41. 12 R. Tijssen, J. Bos and M. E. Van Kreveld, Anal. Chem.,
1986, 58, 3036–3044.
13 A. M. Leshansky, A. Bransky, N. Korin and U. Dinnar, Phys. Rev. Lett., 2007, 98, 234501.
14 F. Del Giudice, G. Romeo, G. D'Avino, F. Greco, P. A. Netti and P. L. Maffettone, Lab Chip, 2013, 13, 4263.
15 K. W. Seo, H. J. Byeon, H. K. Huh and S. J. Lee, RSC Adv., 2014, 4, 3512–3520.
16 G. D'Avino and P. L. Maffettone, J. Non-Newtonian Fluid Mech., 2015, 215, 80–104.
17 M. M. Villone, G. D'Avino, M. A. Hulsen, F. Greco and P. L. Maffettone, J. Non-Newtonian Fluid Mech., 2013, 195, 1–8. 18 G. Romeo, G. D'Avino, F. Greco, P. A. Nettia and P. L.
Maffettone, Lab Chip, 2013, 13, 2802–2807.
19 E. F. Lee, D. L. Koch and Y. L. Joo, J. Non-Newtonian Fluid Mech., 2010, 165, 1309–1327.
20 D. Milanova, R. D. Chambers, S. S. Bahga and J. G. Santiago, Electrophoresis, 2012, 33, 3259–3262.
21 P. Knappe, R. Bienert, S. Weidner and A. F. Thünemann, Polymer, 2010, 51, 1723–1727.
22 G. D'Avino, G. Romeo, M. M. Villone, F. Greco, P. A. Netti and P. L. Maffettone, Lab Chip, 2012, 12, 1638–1645. 23 Y. Viero, Q. He, L. Mazenq, H. Ranchon, J. Y. Fourniols and
A. Bancaud, Microfluid. Nanofluid., 2012, 12, 465–473. 24 R. B. Bird and J. M. Wiest, Annu. Rev. Fluid Mech., 1995, 27,
169–193.
25 J. Happel and H. Brenner, Low Reynolds Number Hydrodynamics: with Special Applications to Particulate Media, Kluwer, The Hague, 1983.
26 H. Ranchon, V. Picot and A. Bancaud, Sci. Rep., 2015, 5, 10128. 27 G. I. Taylor, Proc. R. Soc. London, Ser. A, 1953, 219, 186–203. 28 D. Stein, F. H. J. van der Heyden, W. J. A. Koopmans and C.
Dekker, Proc. Natl. Acad. Sci. U. S. A., 2006, 103, 15853–15858. 29 X. Wang, L. Liu, G. Guo, W. Wang, S. Liu, Q. Pu and P. K.
Dasgupta, TrAC, Trends Anal. Chem., 2012, 35, 122–134. 30 Q. Gao and E. S. Yeung, Anal. Chem., 1998, 70, 1382–1388. 31 M. Sun, J. S. Lin and A. E. Barron, Electrophoresis, 2011, 32,
3233–3240.
32 L. S. Ettre, Pure Appl. Chem., 1993, 65, 819–872.
33 S. Rahong, T. Yasui, T. Yanagida, K. Nagashima, M. Kanai, G. Meng, Y. He, F. Zhuge, N. Kaji, T. Kawai and Y. Baba, Sci. Rep., 2015, 5, 10584.
34 J. Astorga-Wells, S. Vollmer, T. Bergman and H. Jörnvall, Anal. Chem., 2007, 79, 1057–1063.
35 J. Astorga-Wells, S. Vollmer, S. Tryggvason, T. Bergman and H. Jörnvall, Anal. Chem., 2005, 77, 7131–7136.
36 S.-R. Park and H. Swerdlow, Anal. Chem., 2003, 75, 4467–4474.
37 I.-T. Kuo, T.-C. Chiu and H.-T. Chang, Electrophoresis, 2003, 24, 3339–3347.
38 G.-L. Lettieri, A. Dodge, G. Boer, N. F. de Rooij and E. Verpoorte, Lab Chip, 2003, 3, 34–39.
39 J. Dai, T. Ito, L. Sun and R. M. Crooks, J. Am. Chem. Soc., 2003, 125, 13026–13027.
40 D. Stein, Z. Deurvorst, F. H. J. van der Heyden, W. J. A. Koopmans, A. Gabel and C. Dekker, Nano Lett., 2010, 10, 765–772. 41 K.-T. Liao and C.-F. Chou, J. Am. Chem. Soc., 2012, 134, 8742–8745. 42 C.-F. Chou, J. O. Tegenfeldt, O. Bakajin, S. S. Chan, E. C.
Cox, N. Darnton, T. Duke and R. H. Austin, Biophys. J., 2002, 83, 2170–2179.
43 J. C. Giddings, F. J. Yang and M. N. Myers, Science, 1976, 193, 1244–1245.