Complex Dynamic System Architecture Evaluation through
a Hierarchical Synthesis of Tools and Methods
by
Scott M. AhIman
Submitted to the System Design and Management Program
in Partial Fulfillment of the Requirements for the Degree of
Master of Science in Engineering and Management
at the
Massachusetts Institute of Technology MASSACF TECHNLNSTITUTE
May 2003
May 003JUL
3 0
2003
0 2003 Scott M. Ahlman
All rights reserved
LIBRARIES
The author hereby grants to MIT permission to reproduce and to
distribute publicly paper and electronic copies of this thesis document in whole or in part.
Signature of Author
Scott M. Ahlman System Design and Management Fellow May 2003
Certified by
Edward F. Crawley Thesis Supervisor essor and Department Head of Aeronautics & Astronautics
Accepted by
Steven D. Eppinger Co-Director, LFM/SDM
GM LFM Professor of Management Science and Engineering Systems
Accepted by
Paul A. Lagace Co-Director, LFM/SDM Professor of Aeronautics & Astronautics and Engineering Systems
Complex Dynamic System Architecture Evaluation through a Hierarchical
Synthesis of Tools and Methods
by Scott M. Ahlman
ABSTRACT
The automobile embodies complex dynamic system architecture with thousands of components
and as many interconnections. The modern day vehicle architecture attempts to balance significant
tradeoffs and constraints to achieve the system goals. There are innumerable combinations, which
may or may not achieve success.
This work proposes a new method for evaluation of complex dynamic system architecture through a hierarchical synthesis of specific qualitative and quantitative tools and methods within a system
architecture framework. The proposed methodology is applied to key subsystems of a specific high
performance car to assess primarily the merits of the process. Current methods for system
architecture definition at the automobile manufacturer utilized for analysis rely primarily on
experience-based intuition within an architecting framework. Current system architecture frameworks and the manufacturer's process utilized appear insufficient, as significant issues (often dynamics related) arise in the verification and validation phase of their product development process, requiring change to vehicle architecture. Changes in architecture at this phase of the manufacturer's product development process have significant cost, timing and perhaps functional performance implications. Many system architecture and engineering tools exist to aid architecture definition, but a hierarchy in usage and the interrelationships of the tools are not clearly defined. The proposed solution for rigorous complex dynamic system architecture evaluation includes a four phase hierarchical synthesis of known qualitative and quantitative tools and methods within a holistic system architecture framework. For purposes of this thesis, the proposed evaluation methodology is labeled "CD-SAAM" for Complex Dynamic System Architecture Assessment Methodology. The proposed methodology is a rigorous complement, superimposed on the concept development phase, to the standard product development design process. CD-SAAM mainly combines known system architecting and system engineering framework, principles and tools. Application of CD-SAAM to a high performance car's powertrain and chassis system architecture's second level form and function decomposition, serve to demonstrate many high level conclusions.
The hierarchy and synthesis of framework, principles and tools in CD-SAAM provided a valuable
and rigorous method to evaluate complex dynamic system architecture. While certain aspects of the proposed methodology appear time-consuming, each step and the overall process serve to greatly improve consistent success with respect to achievement of a system's goals within its
constraints. Application of CD-SAAM also underscores the importance and need for explicit design
parameter identification and analysis in complex dynamic system architecture assessment. The performance car application also provides insight into the value of DOE RSE methods in architecture assessment, as opposed to its typical region of use in detailed design analysis. Finally, a positive by-product of the analysis includes CD-SAAM's ability to evaluate the consistency and attainability of goals within the given constraints.
Acknowledgements
This thesis is dedicated to the memory of my mother, Dottie Anderson. Her passion for life, kindness to all, guidance through actions, not just words, and incredible courage remains ingrained in me forever.
In addition, I have many to thank for their considerable support and guidance throughout my education in the MIT SDM program, and in particular, this thesis. The number of people whose interaction over the past few decades has affected this thesis indirectly is innumerable. I have learned and gained from far too many to mention here, but they are not forgotten.
First, no amount of words can thank my wife, Angela, enough for her never ending support, patience and sacrifice of my time over the past two years while I pursued my degree at MIT. A thank you also for the hours of proof reading this very long document!
Thank you to my father, Dennis Ahlman, whose passion for cars and all things mechanical is
embedded in me and motivates me everyday.
Thank you to my advisor, Professor Ed Crawley, for his teachings and guidance in System
Architecture, which has had a considerable impact on many aspects of the methodology proposed in this thesis. In addition, his patience with my workload and flexibility in his overloaded schedule to
provide continual and insightful feedback was greatly appreciated.
This incredible opportunity was made possible by two of my mentors, Tom Reichenbach and John
Valentine. A great thank you to them for their belief in my abilities, guidance and support. A thank
you also to Neil Ressler for allowing me the opportunity of a lifetime on the vehicle example heavily
utilized in this thesis in addition to his support and review of this thesis. Also, thank you to mentors Bobby Rahal and Ron Campbell for their letters of recommendation to the SDM program.
Thank you much to Jeff Chrstos, not only my mentor for vehicle dynamics, but also a great friend.
His countless hours of vehicle dynamics advice and analysis aid over the past seven years are invaluable. A thank you also for the numerous hours spent reviewing and providing insightful feedback on this thesis.
Thank you also to colleague and friend Lynn Bishop for his advice and aid in the ADAMS analysis completed in this thesis.
Last but not least, a great thank you to all of my classmates in the MIT SDM program. The level and diversity of talent in their fields, as well as their ability to share their knowledge with others is unmatched. A special thank you to Sridhar Sadasivan and Dan Douglas, my teammates in system architecture coursework, whose efforts and knowledge contributed greatly to my knowledge base in system architecture.
Table of Contents
List of Figures---vi
List of Tables---ix
1 Complex Dynamic System Architecture Evaluation Introduction --- 1
1.1 Motivation and Objective --- 1
1.2 Proposed Solution Introduction --- 4
1.3 Thesis Scope and Specific Objectives --- 9
1.4 Thesis Outline --- 10
2 Relevant System Architecture/Engineering Tools and Principles Summary --- 13
2.1 Chapter 2 Scope and Objectives --- 13
2.2 System Architecture Influences Framework --- 14
2.3 Functional Requirements-Concept-Form Cascade --- 16
2.4 System Architecture Principles--- 18
2.5 Quality Functional Deployment (QFD) --- 25
2.6 Design of Experiments (DOE)--- 28
3 Overview of the System Utilized for CD-SAAM Application--- 33
3.1 Chapter 3 Scope and Objectives --- 33
3.2 Supercars Background--- 33
3.3 Automotive Architecture Decomposition--- 34
3.4 Supercar-A Competitors --- 36
3.5 Supercar-A System Goal Statement, Constraints, Live or Die and Other Goals --- 43
3.6 Highlighted Constraints and Challenges for the Supercar-A Program --- 48
3.7 Supercar-A Architectural Elements for Evaluation --- 51
4 Qualitative Analysis of the Supercar-A System Architecture --- 55
4.1 Chapter 4 Scope and Objectives --- 55
4.2 Upstream and Downstream Influences Identification--- 56
4.3 High level Vehicle Dynamics Fundamentals Background --- 58
4.4 Supercar Functional Requirements Cascade- Concept Mapping --- 65
4.5 Application of System Architecture Principles for the Supercar-A Architecture --- 71
4.6 Overall System Architecture (first level decomposition) Versus Principles Analysis---- 74
4.7 Powertrain: Engine and Induction System Architecture (2nd level decomposition) versus Principles Analysis --- 79
4.8 Powertrain: Control System Architecture (2nd level decomposition) versus Principles Analysis--- 93
4.9 Powertrain: Transmission/Driveline Architecture (2nd level decomposition) versus Principles Analysis --- 97
4.10 Chassis: Frame/Structure System Architecture (2nd level decomposition) versus Principles Analysis --- 102
4.11 Chassis: Suspension System Architecture (2nd level decomposition) versus Principles Analysis 115 4.12 Chassis: Wheel/Tire Architecture (2" level decomposition) versus Principles Analysis 125 4.13 QFD Analysis of Supercar-A Engine/Induction System Architecture --- 130
5 Quantitative Analysis Application of the Supercar-A System Architecture --- 140
5.1 Chapter 5 Scope and Objectives --- 140
5.2 Supercar-A's High level Design Parameters Chosen for DOE Application Summary ---- 141
5.3 Straight-line Acceleration DOE Background---142
5.4 Straight-line Acceleration DOE Sensitivity Analysis --- 151
5.5 Handling DOE Background --- 158
5.6 Handling DOE Sensitivity Analysis---165
5.7 Final Analysis of System Architecture Attributes Still Requiring Evaluation --- 175
6 Final Conclusions and Relevant Recommendations --- 186
6.1 Chapter 6 Scope and Objectives --- 186
6.2 CD-SAAM Phase One (Influences Identification and Concept Mapping) Value, Final Conclusions---186
6.3 CD-SAAM Phase Two (Five System Architecture Principles) Value, Final Conclusions and Recommendations --- 187
6.4 CD-SAAM Phase Three (QFD Analysis) Value, Final Conclusions and Recommendations 190 6.5 CD-SAAM Phase Four (DOE RSE Methodology) Value, Final Conclusions and Recommendations --- 191
6.6 CD-SAAM Overall Value, Final Conclusions and Recommendations --- 192
6.7 CD-SAAM Supercar-A System Architecture Assessment General Conclusions --- 193
Glossary --- 195
List of Figures
Figure 1: Generic Product Development Process "Vee". [FOR, p. 34]--- 2
Figure 2: Generic Product Development Influence Diagram. [THO]--- 3
Figure 3: Generic Product Development Design Process "Funnel". [THO] --- 5
Figure 4: Hierarchical Synthesis of Tools and Methods Framework for Complex Dynamic System Architecture Assessment. --- 5
Figure 5: CD-SAAM Framework. --- --- 13
Figure 6: Crawley's System Architecture Upstream Influences Framework. [Cr, Lecture 1, p. 35] 15 Figure 7: Crawley's System Architecture Downstream Influences Framework. [Cr, Lecture 1, p. 41] --- 15
Figure 8: Functional Requirements Cascade through Concept Mapping. [Cr, Lecture 4, p.33]--- 16
Figure 9: Move People Concept Mapping Example. [Cr, Lecture 4, p.34] --- 17
Figure 10: South Pointing Chariot. --- 21
Figure 11: Magnetic Compass. --- 21
Figure 12: QFD Matrix Types and Relationships. [Bop, section 24, p. 1] --- 26
Figure 13: QFD Relationship Matrix Description. [Bop, section 24]--- 27
Figure 14: 2D Response Surface Slice Representation. --- 29
Figure 15: 2003 Porsche 911 Turbo. Source: www3.porsche.com. --- 34
Figure 16: Automobile Function/Form Decomposition- Level 0 and 1.--- 34
Figure 17: Automotive Powertrain System Function/Form Decomposition- Level 1 and 2. --- 35
Figure 18: Automotive Chassis System Function/Form Decomposition- Level 1 and 2. --- 35
Figure 19: 2003 Ferrari 360 Modena- Overall Vehicle. Source: www.ferrari.com. --- 37
Figure 20: 2003 Ferrari 360 Modena Engine and Transmission (Transaxle). Source: www.ferrari.com.--- 38
Figure 21: Generic Turbo Cutaway. --- 39
Figure 22: Single 2003 Porsche 911 Turbo Charger. Source: www3.orsche.com. --- 39
Figure 23: Ferrari 360 Modena Frame. [Nov]--- 40
Figure 24: 2003 Ferrari 360 Modena Right Front Suspension and Foundation Brakes. Source: www.ferrari.com.--- 41
Figure 25: 2003 Porsche 911 Twin Turbo Front Suspension, Subframe, Steering and Foundation Brakes. Source: www3.orsche.com. --- 42
Figure 26: 2003 Porsche 911 Twin Turbo Rear Suspension, Subframe and Foundation Brakes. Source: www3.porsche.com. --- 42
Figure 27: 2003 Ferrari 360 Modena Front Wheel and Tire. Source: www.ferrari.com. --- 42
Figure 28: 2003 Porsche 911 Turbo Wheel and Tire. Source: www3.porsche.com. --- 43
Figure 29: Supercar-A Timeline versus Standard OEM-A "Greenfield" Timeline.--- 50
Figure 30: Supercar-A System Architecture for Evaluation: Chassis and Powertrain Systems, excluding Body, Electrical and Climate Control Systems. --- 51
Figure 31: Supercar-A Chassis System Architecture for Evaluation: Frame/Structure, Suspension and Wheels/Tires excluding the Steering, Brakes and Control System. --- 53
Figure 32: Supercar-A Powertrain System Architecture for Evaluation: Engine, Induction, Transmission and Driveline excluding the Exhaust, Fuel and Cooling Systems. --- 54
Figure 33: CD-SAAM Framework. --- 55
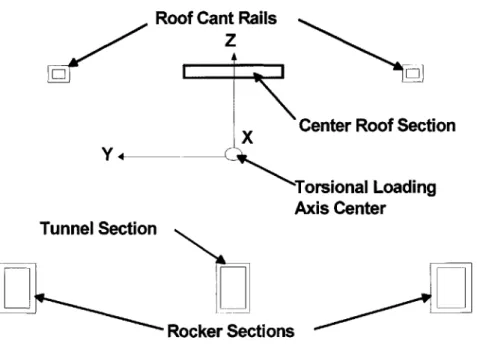
Figure 34: ISO Vehicle Coordinate System. --- 59
Figure 35: Vehicle "Balance" Depiction: Understeer, Oversteer and Neutral Steer Path on a Constant Radius Turn. --- 64
Figure 36: Crawley's Concept Mapping Framework. [Cr1, lecture 4, p. 33]--- 66
Figure 37: Supercar Steering/Cornering Dynamics Concept Mapping with Relevant Design Parameters Listing. --- 69
Figure 38: Supercar Straight-line Acceleration Dynamics Concept Mapping with Relevant Design Parameters Listing. --- 70
Figure 39: Supercar Overall System Architecture Decomposition. --- 74
Figure 40: Supercar-A Powertrain System Architecture for Evaluation: Engine, Induction,
Transmission and Driveline excluding the Exhaust, Fuel and Cooling Systems--- 79
Figure 41: Supercar-A Engine/induction FEAD. --- 82
Figure 42: 360 Modena Engine/Induction FEAD. --- 83
Figure 43: Twin Turbo Charged Engine and Induction System Example. [Car, April 2003] --- 84
Figure 44: Turbo Charger with the Turbine and Compressor Housing Integrated into the Exhaust Manifold. [Car, April 2003]--- 84
Figure 45: Leveson's Software Logic Complexity Example. [Bop] --- 96
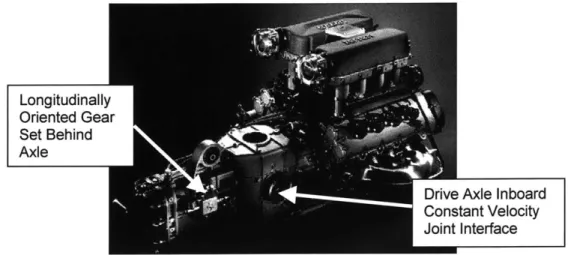
Figure 46: Ferrari 360 Modena Engine and Longitudinal Transaxle. Source: www.ferrari.com.---- 99
Figure 47: 2004 Porsche Carerra GT Transverse Gear Set Layout. [CnD]---100
Figure 48: Supercar-A Chassis System Architecture for Evaluation: Frame/Structure, Suspension and Wheels/Tires excluding the Steering, Brakes and Control System---101
Figure 49: Supercar-A Frame. --- 103
Figure 50: Ferrari 360 Modena Frame. [Nov] --- 104
Figure 51: Ultima Kit Car Space Frame. Source: www.ultimacars.com.---105
Figure 52: Supercar-A's Primary Load Carrying Member Cross Sectional Layout in the Center Section (Passenger Compartment) of the Vehicle as Viewed Fore-Aft. --- 107
Figure 53: Optional Load Carrying Member Cross Sectional Layout in the Center Section (Passenger Compartment) of the Vehicle as Viewed Fore-Aft --- 108
Figure 54: 2003 Ferrari 360 Modena Right Front Suspension and Foundation Brakes. Independent, Unequal Length, Double A-Arm Architecture. Source: www.ferrari.com. --- 118
Figure 55: Supercar-A Left Front Suspension, Steering and Foundation Brakes. Independent, Unequal Length, Upper A-Arm, Lower L-Arm Architecture. --- 118
Figure 56: 1995 Porsche 911 Rear Suspension and Subframe. Multi-link Architecture. --- 118
Figure 57: 2003 Porsche 911 Turbo Left Front Suspension. McPherson Strut Architecture. Source: www3.Porsche.com. --- 119
Figure 58: Barpin Style Bushings Mounted to Frame Structure with Two Bolts Each. --- 119
Figure 59: Standard Bushings Mounted to a Clevis Style Frame Structure with a Single Bolt. ---- 120
Figure 60: Standard Radial Design Passenger Car Tire Cross-Section ("T" Speed Rated). The components are: 1- running tread; 2- steel belt; 3- edge protection for the belt (nylon or rayon); 4- sidewall; 5- substructure with two layers; 6- cap; 7- inner lining; 8- flipper; 9-bead profile; 10 core profile; 11- 9-bead core. [REI, p. 92] --- 126
Figure 61: Unsprung Mass (wheel and tire) Axis of Rotation: Y-Y. --- 127
Figure 62: Supercar-A's Rear Wheel/Tire Combination Scaled Against the Next Step Down in Aspect Ratio Tire For Comparison. --- 129
Figure 63: CD-SAAM Framework. --- 140
Figure 64: Unsprung Mass (wheel and tire) Axis of Rotation: Y-Y --- 144
Figure 65: Supercar-A Engine/Induction System Architecture Option Examples- Torque versus RPM.---148
Figure 66: Engine Torque versus RPM Examples Demonstrating a Third Order Polynomial Fit Over the Measured Data. --- 150
Figure 67: Zero to Sixty MPH Acceleration Elapsed Time Factor Sensitivity for Supercar-A.--152
Figure 68: Quarter Mile Acceleration Distance Elapsed Time Factor Sensitivity for Supercar-A. -155 Figure 69: 80 to 160 mph Acceleration Elapsed Time Factor Sensitivity for Supercar-A.---156
Figure 70: Top Speed Factor Sensitivity for Supercar-A.---157
Figure 71: Tire Lateral Force versus Slip Angle Example for Factor Description.---160
Figure 72: 200 Foot Constant Radius Event- Steady State Peak Lateral Acceleration Capability Factor Sensitivity for Supercar-A. --- 166
Figure 73: 200 Foot Constant Radius Event- 0.3 G (Linear Range) Steady State Lateral Acceleration Understeer Gradient Factor Sensitivity for Supercar-A. --- 169
Figure 74: 200 Foot Constant Radius Event- 0.9 G Steady State Lateral Acceleration Instantaneous Understeer Gradient Factor Sensitivity for Supercar-A --- 171
Figure 75: Pulse Steer Frequency Response Event at 60 MPH- Yaw Natural Frequency Factor Sensitivity for Supercar-A---172
Figure 76: 0.6 G Braking in a 0.8 G Turn Event- Peak Yaw Rate Factor Sensitivity for Supercar-A --- 174
Figure 77: Example Usage of Mind Mapping for the Synergy Principle Analysis of the Supercar-A Suspension System Architecture --- 189
List of Tables
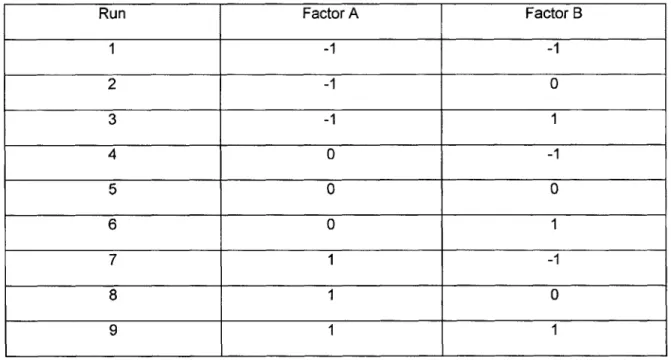
Table 1: Two Factor, Three Level Full Factorial Design Matrix Example. --- 31
Table 2: Supercar Overall System Architecture Examples.--- 37
Table 3: Supercar Engine System Architecture Examples. --- 37
Table 4: Supercar Induction System Architecture Examples. --- 38
Table 5: Supercar Transmission/Driveline System Architecture Examples. --- 38
Table 6: Supercar Frame System Architecture Examples.--- 39
Table 7: Supercar Suspension System Architecture Examples.--- 40
Table 8: Supercar Dynamic Control System Architecture Examples. --- 40
Table 9: Supercar Brake System Architecture Examples. --- 41
Table 10: Supercar Steering System Architecture Examples. --- 41
Table 11: Supercar Wheels and Tire System Architecture Examples. --- 42
Table 12: Supercar-A Constraints. --- 45
Table 13: Supercar-A Live or Die Goals. --- 46
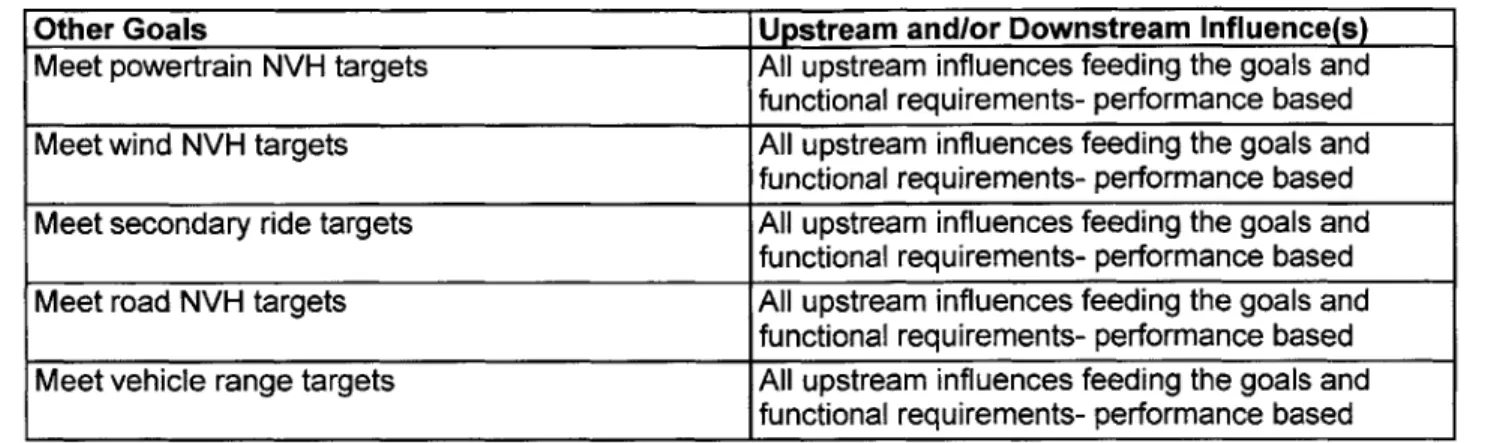
Table 14: Supercar-A Other Goals.--- 48
Table 15: Supercar-A Constraints Mapped to Upstream and Downstream Influences. --- 57
Table 16: Supercar-A Live or Die Goals Mapped to Upstream and Downstream Influences.---- 57
Table 17: Supercar-A Other Goals Mapped to Upstream and Downstream Influences. --- 58
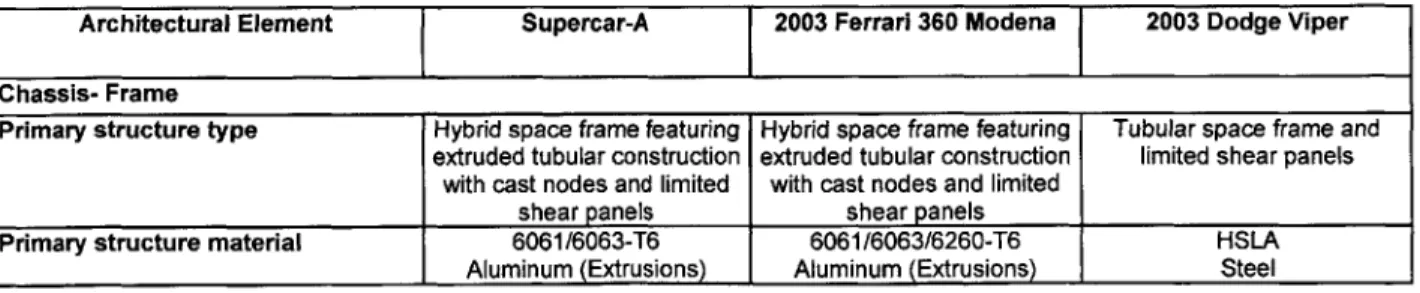
Table 18: Supercar-A, 360 Modena and Viper Overall Architecture Comparison. --- 74
Table 19: Supercar-A, 360 Modena and Viper Engine System Architecture Comparison. --- 80
Table 20: Supercar-A, 360 Modena and Viper Induction System Architecture Comparison.--- 80
Table 21: Supercar-A, 360 Modena and Viper Control System Architecture Comparison. --- 93
Table 22: Supercar-A, 360 Modena and Viper Transmission and Driveline System Architecture Comparison. --- 98
Table 23: Supercar-A, 360 Modena and Viper Frame/Structure System Architecture Comparison. --- 102
Table 24: Baseline and Option Primary Load Carrying Member Polar Moment of Inertia for an Area and Weight Calculations for Rough Torsional Stiffness Efficiency Comparison. --- 110
Table 25: Baseline and Option Primary Load Carrying Member Area Moment of Inertia and Weight Calculations for Rough Vertical Bending Stiffness Efficiency Comparison. --- 111
Table 26: Baseline and Option Primary Load Carrying Member Area Moment of Inertia and Weight Calculations for Rough Lateral Bending Stiffness Efficiency Comparison.---112
Table 27: Supercar-A, 360 Modena and Viper Suspension System Architecture Comparison. -116 Table 28: Supercar-A, 360 Modena and Viper Wheel/Tire System Architecture Comparison. -- 126
Table 29: Supercar-A Engine/Induction System Architecture Comparison Table. --- 133
Table 30: Supercar-A Engine/Induction System Architecture QFD. --- 135
Table 31: Supercar-A Engine/Induction System Architecture QFD Scoring Specifics Example. -- 136
Table 32: Straight-line Acceleration DOE Factors Mapped to Corresponding Design Parameters. --- 143
Table 33: Supercar-A Straight-line Acceleration DOE Factors and Levels --- 145
Table 34: Straight-line Acceleration DOE Analysis Factor Name Abbreviation for Bar Charts--151
Table 35: Straight-line Acceleration Factor Settings and Predicted Elapsed Time for the Supercar-A Baseline Setup versus an Optional Setup. --- 154
Table 36: Handling DOE Factors Mapped to Corresponding Design Parameters. --- 159
Table 37: Supercar-A Handling DOE Factors and Levels --- 162
Table 38: Handling DOE Analysis Factor Name Abbreviation for Bar Charts---165
Table 39: Straight-line Acceleration and Handling DOE Factor and Response Comparison. Aluminum 5.4 L Supercharged V-8 Engine/Induction System versus the Aluminum 6.4 L Normally Aspirated 10 with the Base Engine Torque Curve Shifted Down 2 % for the V-10. --- 177
Table 40: Straight-line Acceleration and Handling DOE Factor and Response Comparison. Aluminum 5.4 L Supercharged V-8 Engine/Induction System versus the Actual Aluminum 6.4 L V-10 Torque Curve and Final Drive Ratio Increased 11%. --- 179 Table 41: Straight-line Acceleration and Handling DOE Factor and Response Comparison.
Baseline Longitudinal Gear Set Transaxle versus a Transverse Gear Set Transaxle. ---- 181 Table 42: Straight-line Acceleration DOE Factor and Response Comparison. Baseline Wheel/Tire
Diameters (18 inch front, 19 inch rear) versus a Reduced Diameter Option (16 inch front, 17 inch rear).---182 Table 43: Handling DOE Factor and Response Comparison. Baseline Front and Rear Tire
Cornering Stiffness Comparison. --- 184
I Complex Dynamic System Architecture Evaluation Introduction
1.1 Motivation and Objective
Nine years of chassis design and vehicle dynamics experience at an automotive original equipment manufacturer (OEM) served to underscore the fact that automobiles are very complex, and
therefore, complicated dynamic systems with thousands of components and as many
interconnections. The modern day vehicle architecture, which embodies its function and form [Cr1], attempts to balance significant tradeoffs and constraints to achieve the system goals/objectives. There are innumerable combinations, which may or may not achieve success. In addition, modern vehicle architecture continues to gain complexity as the customer demands greater function,
especially dynamic.
For purposes of this thesis, my employer is referred to as OEM-A. OEM-A utilizes the basic "Vee" Product Development process shown below in Figure 1. The Vee includes system requirements cascade to the system, subsystem function and detailed design of components in the left side of the Vee. In addition, the left side of the Vee contains the design decomposition and definition of the product development process. The right side of the Vee contains component, subsystem and system level integration and verification. Integration and verification takes the form of physical testing on component, subsystem and full system prototypes, to insure the product meets the
9
On the left side, Decomposition and Onter neradion and Verifcation ascends "t9
The thickness of the Vee is proportional Defnihn dscedsas r. oyc's as successively higher levels of units, assemblies, to the number of elements at that level, Waterfall model. and subsystsms are Integrated and vermald, resulting In a Vee that thickens as Itculminating at the system level, descends.
Figure 1: Generic Product Development Process "Vee". [FOR, p. 34]
Unfortunately, significant issues (often dynamic behavior related) are often uncovered in the
verification phase of the automotive product development process that requires change to
architecture. Changes in architecture at this phase have significant cost, timing and perhaps
functional performance implications. The cost and timing implications result from the large number
of elements of the design that may be affected if architecture rework is required, and the impact on
expensive, long-lead tooling for components, which is often in process or complete by this stage.
Overall system functional performance may be compromised due to an inability to rework the entire
architecture, so compromises made in interfacing subsystems to achieve synergy may no longer
be valid. This described impact of late changes to architecture is in line with the typical product
development "influence diagram", shown in Figure 2 below. It demonstrates the decreasing ability
to impact a design (without considerable cost and time implications) as time progresses on a
project. Note the significant drop in the ability to influence the outcome just after the concept phase
in product development. The completion of the concept phase signals the close of the system architecture definition.
Knowledge Concept Basic Prototype P1I0 Manufacturing
Phases Acquisition Investigation Design Builing Production Ramp-Up
High ABILITY-TOINFLUENCE OUTCOMEIMAKE-CHANGES Low Development
Copyright 0 2001 by Stefan Thomke Time
Figure 2: Generic Product Development Influence Diagram. [THO]
The above-described challenges exhibited in the OEM-A product development process motivated considerable thought with regard to root cause and potential solutions. Reflection on root cause determined that often the system architecture chosen and the process utilized to define it was insufficient to consistently achieve the system goals. Consequently, assessment of a proposed methodology to add rigor and improve performance with respect to system architecture evaluation is the high level objective of this thesis.
Involvement in numerous vehicle projects at OEM-A included experience where dynamics issues were uncovered in the verification phase and required costly and time-consuming architecture
changes to achieve the system's functional objectives. Often the issues uncovered simply
demonstrate the inability to meet the system goals within the given constraints. Other times the uncovered problem involves natural frequency alignment of one of the many components or subsystems requiring architectural change. For example, the rotational frequency of a vehicle's drive shaft at certain speeds can align with the natural frequency, or resonance of the vehicles
frame/structure. The resultant issue, as perceived by the customer, results in an annoying vibration and/or noise. Other forms of natural frequency alignment can lead to limitations in ride and handling performance. Dynamics issues arise in the verification phase of the automobile product
development plan because many of the behaviors or emergent properties are extremely difficult to
predict due to a high degree of interconnectedness throughout the system. The significant interaction between components and subsystems yield very non-linear, counterintuitive behavior. Further, human interaction with the dynamics of the system adds another element of difficulty with regard to dynamic behavior prediction.
An automobile's system architecture heavily affects the difficult to predict dynamic behavior. The architecture of a system creates its foundation and governs the subsequent compromises and ultimate success with respect to the system objectives. However, most system architecture definition methods and the process utilized at OEM-A are purely qualitative. The methods primarily rely on experience-based intuition, perhaps some architecting principles and heuristics within a loose architecting framework. A hierarchy in usage and the interrelationships of the tools are not clearly defined.
1.2 Proposed Solution Introduction
To evaluate complex dynamic system architecture and alleviate the above-described issues, I
propose a four phase hierarchical synthesis of qualitative and quantitative tools and methods within
a system architecture framework. For purposes of this thesis, the proposed evaluation
methodology is labeled "CD-SAAM" for Complex Dynamic System Architecture Assessment
Methodology. CD-SAAM primarily combines known system architecting and system engineering
framework, principles and tools for qualitative analysis. It also utilizes Design of Experiments (DOE) methodologies at the final, quantitative step, which is chosen for its strengths regarding
quantification of dynamic system behavior. This thesis is not intended to invent new, individual processes, but instead synthesize a more rigorous, hierarchical set of steps applied to an actual
complex dynamic system in the form of a high performance car.
The proposed methodology explicitly evaluates the importance of design parameters with respect to system constraints and goals, as well as assesses the impact of architecture options on the
identified parameters. This methodology is not to be confused with the typical product development
concept "funnel" that depicts the narrowing of concepts and resultant design options through the
process. Instead the proposed methodology is a rigorous complement, superimposed on the
concept development phase of the standard process. See Figure 3 and Figure 4 below for a graphic depiction.
competitor and market analysis
Sconcept
customer needs i development i product and process
identification ' (architecture design and development Product launch
i definition)
technology /
assessment /
Figure 3: Generic Pro ct Development Design Process "Funnel". [THO]
Phase
1
Phase 2
Upstream & Downstream Influences System Identification Architecting QFD Analysis Principles Functional Application Requirements Cascade \ -j "Phase 4
DOE Methods Applied In Parametric Models 0 00 Holistic System Architecting FrameworkFigure 4: Hierarchical Synthesis of Tools and Methods Framework for Complex Dynamic System Architecture Assessment. Page 5 of 203 / I I I 44 P hq
The use of narrowed focus for assessment of product designs, starting with qualitative tools, then moving to quantitative analysis is not new. However, the identification and usage of a specific set of tools and hierarchy as described in the following does appear novel. In addition, CD-SAAM is novel in its approach with regard to a narrowing of focus and increase in fidelity of analysis with respect to specific elements and/or design parameters of an architecture, rather than simply a narrowing of concepts. Completion of each phase of CD-SAAM yields four potential outcomes. The result can
involve just one, some or all four of the following conclusions at the end of each phase:
1. Complete evaluation of certain aspects (function and/or form) of an architecture
deeming them sufficient or deficient with respect to system constraints and goals, with the latter case pointing to alternatives. This means the identified aspects of the architecture do not warrant further, more detailed analysis in the following phases. 2. Incomplete evaluation of certain aspects (function and/or form) of an architecture with
respect to its constraints and goals. This means the identified aspects of the architecture warrant further, more detailed analysis in the following phases.
3. Complete evaluation of the importance of specific high level solution neutral system design parameters (i.e. mass, moment of inertia, stiffness, etc.) and their impact on system constraints and/or goals. This means that these specific design parameters do
not warrant further, more detailed analysis in the following phases. It also means form
and function attributes of the architecture may be adequately judged with respect to
their affect on these design parameters.
4. Incomplete evaluation of the importance of specific high level solution neutral system design parameters. The analysis uncovers and highlights specific system design
parameters that impact the system constraints and/or goals, but are unable to adequately quantify their importance. The highlighted design parameters require
further, more detailed analysis in the following phases until their impact on system
constraints and/or goals are adequately quantified.
CD-SAAM Phase Description
As shown in Figure 4, a system architecture framework encompasses the entire process to provide
guidance at each step and insure all of the major influences feeding the architecture are accounted
for. The chosen system architecting framework for CD-SAAM provides holistic guidance for every step in the process. Competitor and market analysis, customer needs identification, technology
assessment, as shown feeding concept development in Figure 3, are a few examples of upstream
influences feeding an architecture. However, this is only a partial list, which is highlighted by the chosen framework described in detail in section 2.2. For reference, downstream influences include elements such as manufacturing, assembly and operational sequence, also covered in greater depth in section 2.2.
The first phase of the qualitative analysis in CD-SAAM primarily creates the foundation for system architecture assessment, as opposed to direct evaluation. However, similar to the shape of the funnel shown in Figure 3, concepts and function of the architecture to analyze are heavily reduced as the goals and requirements are defined. Further, the system architecture framework and the two elements of the first phase, upstream/downstream influences identification and functional requirements cascade, serve to insure holistic goals and requirements. Note that the specific method chosen for functional requirements cascade is described fully in section 2.3. While the first three phases of CD-SAAM are labeled as "qualitative", they are not completely devoid of quantitative aspects. The three phases of qualitative assessment are intended to include the application of the basic laws of physics, including review of fundamental equations relevant to the
dynamic system at each step.
Direct system architecture evaluation begins in phase two of CD-SAAM shown in Figure 4. This phase of the analysis utilizes five specific system architecting principles. The five chosen principles are enlisted to provide a more focused assessment with regard to attributes of the architecture. Each principle application by itself and resultant evaluation of the system architecture may highlight potential for improvement with respect to the particular principle. However, the resultant
assessment is not necessarily the final judge on the merit of the architecture. For example, an architecture may exhibit deficiencies with regard to one or more principles, but in the end result in the best synergy and performance with respect to system goals. The five principles applied in
CD-SAAM are described in detail in section 2.4.
The final qualitative step in CD-SAAM involves Quality Functional Deployment (QFD) analysis. QFD, a system engineering tool, is employed to analyze aspects of the architecture that are shown to affect a large degree of the system constraints and goals with conflicting trends in the prior steps. QFD utilizes a weighting and scoring system that transforms a complicated collection of conflicting trends into an organized array with a ranking of each concept. However, it is still primarily qualitative analysis, based on engineering judgment and application of principles; thus the results are not always completely conclusive, especially for complex dynamic systems.
The final step in CD-SAAM involves quantitative DOE methodologies applied to parametric models. The DOE methodologies are focused on critical design parameters of the system architectures based on the prior qualitative analysis. The application of DOE to parametric models yields Response Surface Equations (RSE's) that provide the true sensitivities and interactions of system parameters on chosen responses (system output) and allow for "best balance" (optimization)
analysis, if desired. Very few have proposed and utilized quantitative analysis for system
architecture assessment and even less apply DOE methodologies. In an automobile, for example,
the RSE's can provide the true impact of attributes like system mass, moments of inertia, stiffness, aerodynamic properties, etc. on dynamic functions like straight-line acceleration, cornering and braking. Understanding the true sensitivities and interactions gives one quantitative metrics to
finalize evaluation of their architecture. Architecture decisions that cut across subsystem
boundaries and multiple managers' areas of discipline increase the need for quantification of
design parameter importance. In addition, the constraints, goals and region of design space
occupied for a system architecture heavily affect the results. Therefore, a DOE completed for one
vehicle system, for instance, does not necessarily apply to another. Ideally, one would apply DOE
methodologies to the entire system architecture to insure a robust result, but this is not feasible in complex, dynamic systems like the automobile, based on cost, time and resource constraints.
1.3 Thesis Scope and Specific Objectives
The nature of the proposed process CD-SAAM, where it is primarily a hierarchical synthesis of
known tools, forces the need for application of the methodology to a complex dynamic system to
assess its merit. While there are a considerable number of complex dynamic system architectures to which this thesis applies, the modern automobile system architecture is chosen for application. Specifically, the application of CD-SAAM focuses on a few key subsystems of the 2"d level
decomposition of form for the powertrain and chassis systems for a high performance car, known
as "Supercar-A" from this point forward. This high level form of Supercar-A is evaluated against the stated system goals and constraints. The scope of the analysis remains within the typical concept development phase of product development design process shown in Figure 3 and assumes the
system goals stated in the application section address the customer needs.
Multiple specific objectives exist for this thesis due to the fact it embodies a combination of new methodology analysis as well as application to specific system architecture. To summarize, the two specific objectives for this thesis are as follows:
1. Assess the hierarchical synthesis of qualitative system architecting and engineering
tools and quantitative analysis for complex dynamic system architecture evaluation
(CD-SAAM) through application to Supercar-A. This is the primary objective of the
thesis. Assessment of the proposed methodology for complex dynamic system architecture evaluation includes highlighting strengths and weaknesses of each major
step, as well as the overall approach. Metrics include the value of each step and the
overall methodology value with respect to time and resources expended versus the
results achieved.
2. Evaluate the selected subsystems of the Supercar-A architecture with respect to its stated constraints and goals. This is the secondary objective of the thesis. The
evaluation of Supercar-A includes highlighting strengths of the architecture chosen and potential areas of opportunity for improvement. Application to Supercar-A is also meant to underscore the importance of the chosen system architecture and its impact on
results.
1.4 Thesis Outline
Chapter Two summarizes the related system architecture and system engineering framework, principles and tools that are applied in CD-SAAM and additional reasoning for their usage. Chapter Two is not intended to teach and/or provide significant background detail for any one of these tools due to the fact that there is a significant body of documentation available on these subjects. However, relevant documentation is cited if the reader requires further information on these subjects.
Chapter Three introduces and provides pertinent background information on the complex dynamic system to which CD-SAAM is applied. This includes the specific high performance car whose architecture is evaluated as well background on its primary competitors. The background information includes vehicle form/function decomposition to the second level as well as numerous
examples of concepts for the performance car system architecture. Chapter Three also covers
considerable detail on Supercar-A's goals and constraints in addition to highlighting considerable
challenges to meeting the system objectives. The chapter closes with final definition of the specific
elements of Supercar-A's system architecture chosen for application of CD-SAAM.
The prior work in this thesis leads to the actual application of the proposed methodology, CD-SAAM in Chapter Four. This chapter covers the qualitative analysis application of CD-CD-SAAM to the
above stated Supercar-A system architecture. The qualitative analysis includes the first three
phases depicted in earlier Figure 5 including: upstream and downstream influences identification,
functional requirements cascade through concept mapping, five system architecture principles
application and QFD analysis. The upstream and downstream influences are directly mapped to
the system goals and constraints introduced in Chapter Three. The functional requirements cascade through concept mapping applies new usage of design parameters at this level of system
architecture analysis. The five system architecture principles application represents the first true
architecture assessment step in CD-SAAM, which is somewhat lengthy as it represents the
highest, most coarse level of analysis. Completion of the principles narrows the focus of system
architecture elements for assessment and leads to the QFD analysis, which is the final qualitative
phase.
Chapter Five involves the fourth and final phase of CD-SAAM application to the Supercar-A system
architecture. As discussed earlier, the fourth phase is quantitative in nature and includes the
utilization of DOE RSE methodologies in parametric models to calculate and provide true design parameter to vehicle behavior relationships (sensitivities). The design parameters and vehicle behavior analyzed are those highlighted in the prior phases of evaluation, which require further evaluation. Quantification of the identified design parameters facilitates final assessment of remaining aspects of system architecture, which are inconclusive up to this stage of CD-SAAM. This chapter includes analysis of two DOEs. The first DOE covers Supercar-A's straight-line acceleration performance, while the second covers its handling performance. Chapter Five includes background information on the DOE setup, including high level specifics about the models used. The analysis for each vehicle response includes direct observations on the relative
importance of the design parameters and the chapter concludes with final assessment of open
aspects of the Supercar-A system architecture.
The sixth and final chapter covers conclusions regarding the merits of the proposed methodology, CD-SAAM, for assessment of complex dynamic system architecture. The conclusions include the
value of each phase of the proposed approach as well as the overall value of CD-SAAM. Each
section of the conclusions includes relevant recommendations for improvement to aspects of CD-SAAM based on the application analysis completed. Chapter Six concludes with a final high level
assessment of the Supercar-A system architecture with respect to its goals and stringent constraints.
2 Relevant System Architecture/Engineering Tools and Principles Summary
2.1 Chapter 2 Scope and Objectives
Chapter Two summarizes the related system architecture and system engineering framework, principles and tools that are applied in CD-SAAM and additional reasoning for their usage. The
following tools are reviewed in this chapter:
* Crawley's System Architecture Influences Framework * Functional Requirements Cascade
* Five System Architecting Principles * Quality Functional Deployment (QFD) * Design of Experiments (DOE) Methodology
The CD-SAAM framework is depicted again in Figure 5 to in the process.
demonstrate the placement of each tool
wo -tf -
-hase 1
Pha2Phase
pstream & ownstreamPhase
4
fluences Systementification Architecting QFD Analysis DOE Methods
ArchitectPrinciples Applied
unctional Application In Parametric
equirementsModels ascade \ q Holistic ..- ,,s -aw System Architecting Framework
Figure 5: CD-SAAM Framework.
Page 13 of 203 00 W 00 - 00mmm~
-
F
/ I I I I U D Ir Id F R C 41%Chapter Two is not intended to teach and/or provide significant background detail for any one of these tools due to the fact that there is a significant body of documentation available on these subjects. However, relevant documentation is cited throughout if the reader requires further information on these subjects. Additional system architecting and engineering tools (including Design Structure Matrices, context diagrams, Object Process Methodology and Axiomatic Design) to those utilized in this thesis were investigated but omitted due to the following reasons:
* Overlap with respect to chosen tools
* Cumbersome usage and perceived insufficient results for a given level of effort * Inappropriate for application to this thesis
2.2 System Architecture Influences Framework
As stated in section 1.2, the chosen system architecting framework for CD-SAAM provides holistic guidance for every step in the process. As noted earlier, other standard frameworks exhibit some of
the necessary influences on the architecture of a system, but none are as complete as Crawley's
framework. Figure 6 and Figure 7 below represent the major considerations feeding the form/concept of a system. The influences from this framework are directly applied to the system goals and constraints analysis to insure they are properly represented, as highlighted in section
4.2. This mapping of upstream and downstream influences to the system goals and constraints
comprises the work involved in "identification of upstream and downstream influences" in phase one of CD-SAAM.
Many of these influences are self-explanatory but others require some explanation, primarily a few of the downstream influences. The "implementation" influence in Figure 7 represents
manufacturing and assembly considerations. "Evolution" represents future adaptation of the architecture with respect to changes in design and usage.
Model of Upstream Influence on
Architecture
Regulation Corporate, Marketing, PD strategy Customers Competitive Environment architecture / / I> need -* goals >m. function
it
Technology form concept Operations StrategyMassachusetts Institute of Technology @ Ed Crawley 2001
Figure 6: Crawley's System Architecture Upstream Influences Framework. [Cr, Lecture 1, p. 35]
Framework for Downstream
Influences
OperationsForm
u..
Concept
Architecture
Implementation
Operator
(training, etc.)
Operational
sequence
Dynamic behavior
Evolution
Design
Massachusetts Institute of Technology Q Ed Crawley 2001
Figure 7: Crawley's System Architecture Downstream Influences Framework. [Cr, Lecture 1, p. 41]
Page 15 of 203
2.3 Functional Requirements-Concept-Form Cascade
Customer needs must be turned into system goals as demonstrated in Crawley's System Architecture framework. For the most part, these "needs" are customer wants or desires and not true needs and could be discussed at length. However, customer needs discussion is beyond the scope of this thesis. Therefore, the next step in the process involves creation of solution neutral functional requirements based on the system goals, starting at the highest (system) level and cascading down, step-by-step, to the subsystems. This cascade is intended as another tool to drive the architect's decision process for concept and form selection. The concept and form needs to appropriately address the functional requirements as well as the other upstream and downstream influences noted in Crawley's framework. The architect for a system should work to the second level of function and form decomposition, as noted by Crawley and shown in his Concept Mapping Diagram in Figure 8. This can be a large task, depending on the size of the system.
Role of Concept in Mapping
need
----i
oalhigh level operato
concept r
leveqJ4decomposilhou
level 1: function + product form++ operation +-+timina
concept 1[om-4concept
level 2 decomposition
level 2: function -+ etc. etc. +- timing
Massachusetts Institute of Technology @ Ed Crawley 2001
Figure 8: Functional Requirements Cascade through Concept Mapping. [Cr, Lecture 4, p.33]
A solution neutral requirement is intended to mean that it defines "what" is required, not how it is
achieved. Of course, as noted by Suh, the design solution chosen at a higher-level impacts the
requirements at a lower, subsystem level, so one is never completely solution neutral with requirements. [Suh] For example, lets say a requirement for a system is "Provide human transportation". Choosing an automobile versus a train or plane at the highest level of architecture to meet this requirement certainly yields significantly different lower-level requirements for the subsequent subsystems. At the next level, choosing an internal combustion engine to provide acceleration or "thrust" in a vehicle again yields significantly different lower level subsystem requirements than if a hydrogen fuel cell power-plant was chosen. Note Crawley's example for
"Moving People" as the high level function.
Example: Move People
move ground crew
people pilot controllers ' Moving people : 500 people 300 miles in 6 hours I loading
creating lift taxiing
creating thrust fuselage . Taking off
exercising control 4-+ airplane winga Aircarrier/ climbing
housing passengers tail g airport cruising
"~wing"
~
[]wing
span
"load"
function flap form function
Massachusetts Institute of Technology @ Ed Crawley 2001
Figure 9: Move People Concept Mapping Example. [Cr, Lecture 4, p.34]
Further research encountered a wide range of methodologies for solution neutral functional flow of requirements down through the subsystems to aid function-concept-form selection. This research demonstrated notable definition differences for function, architecture and design parameters, which certainly explained the range of methods as well as a variety of rigor in the approaches. The best objective analysis of functional requirements cascade methods I encountered was completed in MIT System Design and Management Masters student, Nathan Soderborg's thesis, "Representing
Systems Through Object-Process Methodology and Axiomatic Design". [Sod] Soderborg analyzes the functional requirements cascade methods and corresponding definitions of notable authors including Boppe (Systems Engineering), Crawley (System Architecting), Dori (Object Process Methodology: OPM) and Suh (Axiomatic Design). For the most part, Soderborg favored the OPM approach by Dov Dori for its rigor in definitions and completeness. At a very high level it is a rigorous graphical method for linking intent of requirements, function, behaviors and form.
Ultimately, OPM appears very similar to Crawley's Concept Mapping in its primary elements at the
architectural level. I have chosen to stick with Crawley's Concept Mapping for Functional Requirements Cascade in this thesis because it is fairly self-explanatory and intuitive in comparison to OPM. This completes the summary of tools utilized in the first phase of CD-SAAM, which
primarily serve to create the foundation for evaluation of an architecture in the following phases.
2.4 System Architecture Principles
A principle is defined as an underlying and long enduring fundamental that is always or almost always valid. [Cr1] Principles contain a descriptive component to highlight the philosophy of the principle and a prescriptive or "recipe" component to apply the descriptive portion. [Crt] System architecting principles are qualitative tools to evaluate a given architecture by inspection and
comparison to the principles. An assignment during the Fall 2001 System Architecture course
ESD.32J, by Professor Crawley at MIT in the System Design and Management Program consisted
of compiling a list of System Architecture Principles throughout the semester. The following five
principles described in detail represent the most applicable and valuable encountered to date:
1. Minimize Complexity
2. Form, Function and the Laws of Physics/Nature Union 3. Balanced Architecture
4. Synergy
5. Balanced External Forces
Each principle that follows contains a descriptive element, prescriptive aspect for application and further detail for usage context and improved clarity.
1. Minimize Complexity Principle by Crawley
Descriptive: Minimize ideal (essential), actual and perceived complexity. (As noted in the
glossary, complexity is the level and sophistication of interfaces/interconnectedness in a system.)
Prescriptive: The complexity (especially perceived) of the system must be within human
understanding. The interfaces should be well defined for minimal "information" transfer and facilitate system integration. [Lim, principle 18 description paraphrased].
Complexity is a major theme in Crawley's System Architecture course. If complexity is beyond the architect's and/or design team limits of comprehension, then it is impossible to apply a holistic view and achieve a synergistic system. If the system is apparently too complex, then it is obviously complicated. Further, well-defined interfaces with minimal
complexity is key to more detailed system design due to the fact that the design engineers
tend to spend more time and effort on the "core" and least on the periphery of their subsystems, viewing the latter as external constraints on their internal design." [Rec]
However, complexity remains a difficult aspect of architecture to "quantify". The perception of complexity often depends on one's perspective; therefore, assessment of complexity varies from person to person. For example, a hinged joint with two separate halves and a pin is more complex in part count and the number of interfaces than a "living hinge" or single piece flexure producing the same function. However, the flexure is arguably a more sophisticated joint than the standard hinge and is more difficult to predict and understand its true behavior. Therefore, one may conclude that the living hinge is more complex. Examples of this nature must be kept in mind during application of this principle noting the architecture implementers' (design engineers) perspective and perception of complexity.
2. Form, Function and the Laws of Physics/Nature Union Principle by Frank Lloyd Wright with addition from Ahlman
Descriptive: Form, function and the laws of physics/nature union.
Prescriptive: Marry form and function by architecting them as "one", in unison with the
laws of physics/nature. The architect must approach them with a singular vision,
concurrently, as opposed to popular credos like "form follows function".
It appears Louis Sullivan coined the phrase "form follows function" which was heavily misinterpreted as a Frank Lloyd Wright statement. Actually, Wright's version of this statement is "form and function are one". I have taken it one more step explicitly and added the laws of physics and nature. Many would argue this is simply part of "function", but to me, there are significant degrees of difference in functional performance between different approaches to an architecture which do not emphasize, or treat as important, the laws of
physics/nature. The architect, who applies knowledge and analysis regarding the laws of
physics and nature, will achieve a better solution. Often an architecture that embodies this principle is known as "elegant". An elegant architecture demonstrates significant style
(aesthetics), simplicity (ease of function, form and understanding) and does not merely
meet, but exceeds functional requirements and system goals. In the end, it is typically the "simplest" approach and architecture, which often exceeds users expectations. And elegant designs often cause one to say, "That is so simple, why didn't I think of that?"
True architectural elegance is typically universal, not simply appreciated by a few, rather a
large majority. It is also timeless and magical. It creates an emotional response, which is
greater than its mere function deserves. Architectural elegance for determining or
maintaining a heading is exemplified by the non-complex, aesthetically pleasing and
"magical" magnetic compass versus the example of the complicated, complex, "clunky"
looking poor performing (very inaccurate) South Pointing Chariot, which only attempts to
maintain a heading. The Chinese reportedly invented the South Pointing Chariot around
500 BC. View the complex differential system of the South Pointing Chariot in Figure 10
versus the simple form and function of the magnetic compass in Figure 11, which truly
integrates the Laws of Physics. Also, note the resultant reduction complexity.
Figure 10: South Pointing Chariot.
Figure 11: Magnetic Compass.
3. Balanced Architecture Principle by Ahlman
Descriptive: A "balanced" architecture is absent of extremes and embodies the necessary
compromises.
Prescriptive: Insure the first and second level design parameters of a system architecture
The Balanced Architecture principle is a first order principle, which feeds or is utilized to achieve synergy. It does not entail all of the facets or complete holistic view required to achieve synergy, but it is an important component. Significant experience is required to apply this principle because it requires a feel for the numbers purely by inspection, not more significant numerical analysis. This is "zero-eth" order analysis as taught in systems engineering. Understanding what is extreme is difficult without a healthy dose of application and real-world experience on the product being architected. Ultimately, application of this principle serves to highlight the need for further analysis with respect to the potential compromises that the extreme aspects may affect negatively.
4. Synergy Principle
Descriptive: "Synergy- In essence, the whole is greater than the sum of the parts"
(Mid-17th century. Via Latin from Greek sunergia, from sunergein "to work together," from, ultimately, ergos "work.")
Prescriptive: Parts, things, people, organizations "work" together to optimize the whole,
the system, rather than the individual parts.
This principle is at the heart of system architecture and engineering as well as life. All too
often we optimize the singular parts or even singular attributes of a system, instead of the
whole, which results in performance less than the sum of the parts because they do not
work together. A quick review of a completely separate but analogous situation highlights this principle. Many top professional sports teams reinforce this fundamental truth when a team is "stacked" with a significant number of elite athletes, yet a collective group of less
talented individuals often beats them. One team has created synergy; the other has not.
Creating synergistic systems is especially challenging at OEM-A, which has had a strong
heritage of component design and yet such a complex product system (the automobile).
Fortunately, a systems approach has been growing at OEM-A. Essentially, it is the