PFC/JA-95-33
Active Spectroscopic Diagnostics
for ITER Utilizing Neutral Beams
E.S. Marmar
September 1995
To be published in the proceedings of the International School of Plasma Physics "Piero Caldirola" Workshop on Diagnostics for ITER, Aug. 28 - Sept. 1, 1991, Varenna, Italy. This work was supported by the U. S. Department of Energy Contract No.
DE-AC02-78ET51013. Reproduction, translation, publication, use and disposal, in whole or in part by or for the United States government is permitted.
ACTIVE SPECTROSCOPIC DIAGNOSTICS FOR ITER UTILIZING NEUTRAL BEAMS
Earl S. Marmar
MIT Plasma Fusion Center Cambridge, MA 02139 USA
INTRODUCTION
The use of neutral beams, combined with visible spectroscopy, is widely applied to the diagnosis of tokamak plasmas. Local plasma parameters which have been measured with these techniques include low Z impurity densities (e.g. Isler, 1977; Boileau, et al., 1989; von Hellerman, et al., 1992) and impurity transport coefficients (e.g. Synakowski, et al., 1990), ion temperature and rotation (e.g. Fonck, et al., 1984), internal magnetic field, (and thus current density and safety factor (Levinton, et al., 1989; Wrobleski and Lao, 1992; Wolf, et al., 1993)), and electron density fluctuations (eg. Durst, et al., 1992). Very recently, the first measurements of the energy distribution of slowing-down D-T fusion a particles have been reported (McKee, et al., 1995). An examination of the proposed measurement requirements for ITER (ITER 1995), as developed by the ITER JCT in consultation with the ITER Diagnostic Experts Group and diagnosticians from around the world, reveals several obvious candidates for application of diagnostic neutral beams (DNB's). Of these, the one for which there appears to be no alternative whatsoever, is measurement of the thermalized helium density profile in the confinement region. Since helium ash accumulation is one of the key physics issues to be tested in long pulse (> 1000 second) operation, the inability to measure this quantity accurately in real time would be a significant handicap and could conceivably compromise some of the main ITER missions. A diagnostic beam, combined with charge exchange recombination spectroscopy (CXRS) will be able to provide this measurement.
Assuming appropriate spectroscopic and neutral particle diagnostics can be designed to observe the DNB, additional enhanced profile measurement capabilities that will become available include ion temperature, plasma rotation, and low Z impurity concentrations, including Be, C, 0 and Ne. Ion temperature and rotation measurements in the plasma core can (and should) be available using high resolution X-ray spectroscopy (Hill, et al., 1992; Bitter, et al., 1993; Widman, et al., 1995). However, these are inherently chord integral measurements, and may require seeding the plasma with a medium Z impurity, such as argon or krypton. The low Z impurity density profiles probably cannot be obtained by any means other than the DNB/CXRS combination. While detailed knowledge of beryllium,
carbon, oxygen and neon profiles is not quite as important as the a ash question, knowing these quantities will be extremely useful, and the only alternative information in the core plasma will come from profiles of radiated power and Zeff. Two additional important
uses of DNB's, on presently operating tokamaks, are to measure internal magnetic field (and thus q profiles) via the Motional Stark Effect (MSE) and to measure fluctuations via Beam Emission Spectroscopy (BES). In both of these cases, it is the radiation resulting from excitation of beam neutrals which is observed. For CXRS, the cross section for population of the desired upper level in the H-like ion is a strongly decreasing function of interaction energy. As a result, even though beam attenuation will be very significant, the optimum energy for CXRS is in the range from 100 keV/amu to 150 keV/amu for hydrogenic beams. The excitation cross sections for MSE and BES are weaker functions of neutral energy than for charge exchange recombination, so energies in the range of 400 to 600 keV/amu, or perhaps higher, are advantageous for those applications. As a result, a DNB which is optimized for CXRS will not be so well suited for MSE; assuming NBI heating is available on ITER, it is possible that one of the heating beams (with time modulation) would be better suited to MSE. Given the need for high time resolution, it is likely that BES would be most useful in measuring fluctuations near the periphery of ITER plasmas; BES will not be analyzed quantitatively here.
CHARGE EXCHANGE RECOMBINATION SPECTROSCOPY Alpha Ash Measurements
As the measurement of the a ash density profile is the primary motivation for wanting to add a diagnostic neutral beam to ITER, we focus our considerations first on that application. As has been previously pointed out (von Hellerman and Summers, 1993), beam attenuation in the large, high density ignited ITER plasma will be severe. This, combined with the rapid decrease of charge exchange population of excited He II as the neutral energy increases above 50 keV, implies that the signals from the core of the plasma will be relatively weak. In all cases presented in this paper, the plasma has been modeled as follows (ITER Diagnostic Group, 1995): R = 8 m, a = 3 m, T = T = 20 x [1
-(r/a)2
]2 keV, ne = no x [1 - (r/a)2]-, nHe = .1 x ne, Zeff 1.5.
Figure 1 shows the results of penetration calculations for a range of neutral hydro-gen beam energies, assuming perpendicular injection along the midplane. The plasma parameters used are those of the high density, fully ignited case, with central density no = 1.4 x 10²⁰ m-3. For the beam attenuation calculations, ionization due to electron im-pact (Janev, et al., 1987), proton imim-pact (Fite, et al., 1960; Gilbody and Ireland, 1964) and charge exchange (Freeman and Jones, 1974) have been taken into account. The enissivity in the H-like He line of interest is given by:
E = ne nHo (OuV)c ph/m3/s/nm, (1) VH, AAD
where (ov)cz is the effective rate for emission of the n = 4 -+ 3 transition at A = 468.6 nm,
taken from (Fonck, et al., 1984), VH is the neutral velocity and A.AD is the doppler width due to the ion thermal distribution. The neutral beam is assumed to deliver an equivalent current density of 103 amp/M2 (before plasma attenuation), independent of beam energy, with a cross-section of .2 x .2 m. At 125 keV, this corresponds to a beam power of 5 MW. For a detection geometry where the optics view the beam tangentially (at r = 0), the line
100
10- 1
1-2 103104
1-50.0
0.5
1.0
Minor
1.5 2.0Radius (m)
2.5
3.0
Figure 1. Neutral hydrogenic beam transmission as a function of minor radius for the high density, fully ignited scenario. The curves are parameterized by beam energy in keV/amu.
1018
10171016
10 15
10140.0
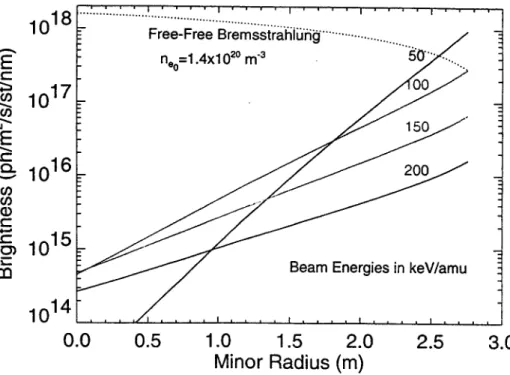
0.5 1.0 1.5 2.0 Minor Radius (m) 2.5 3.0Figure 2. Brightness in the He+ (n = 4 -- 3) line at A = 468.6 nm, as a function of minor radius, for 4 different neutral energies. The continuum due to free-free bremsstrahlung at the same wavelength is shown by the dashed curve.
0
E
C 0 0 CZ U_Beam Energies in keV/amu
200 15 10 -ne 1.4x1 020 m-3 C E Co_ c 0. CO C
c,)
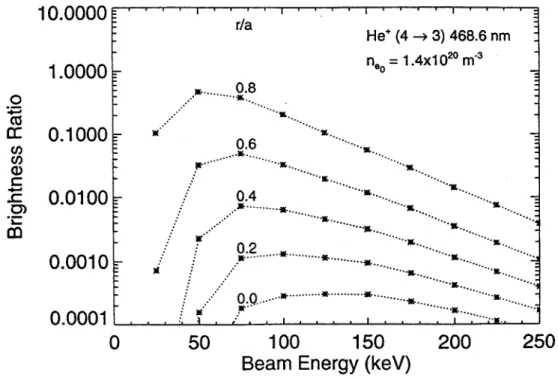
Free-Free BremsstraIi ...-... n =1.4x10²⁰m. 00 150 _e i200brightnesses which would result are shown in figure 2. For comparison, the continuum due to free-free bremsstrahlung (Kadota et al., 1980), is also shown. Figure 3 shows the same data, plotted to give the ratio of the bremsstrahlung to the CXRS signal, as a function of beam energy for several radial locations. In the center of the plasma (r/a = 0), the continuum will be more than 3 orders of magnitude brighter than the CXRS signal, even for the optimum beam energy of about 125 keV. In order to pull the signal out of this large background, it will be necessary to modulate the DNB.
10.0000... r/a He' (4 - 3) 468.6 nm n1= 1.4x1 020 m3 1.0000 0- 0
cc
0.1000 e~r 0.6-... ...0... 0.0100 -04 -0.2 0.0010 * .... 0.0001 . . 0 50 100 150 200 250Beam Energy (keV)
Figure 3. Ratio of the bremsstrahlung continuum divided by the charge exchange signal for He+, as a function of neutral energy. The 5 curves are for different values of fractional minor radius (r/a).
The signal to noise ratio of the measurement is fundamentally limited by the
fluctu-ations in the continuum signal (von Hellerman and Summers, 1993). The minimum level of these fluctuations is determined by photon statistics. In order to estimate this, it is
assumed that the optical system has an etendue of 2 x 10⁻⁷ m2 _ st (determined by the spectrometer), and an overall transmission and detection efficiency (mirrors, fibers, lenses,
detectors) of 1% (R. Fonck, private communication). To measure the density of
thermal-ized helium in the discharge, we integrate over the doppler broadened spectrum of the line; at T, = 20 keV, the full width at half maximum will be ~ 2 nm. With these assumptions,
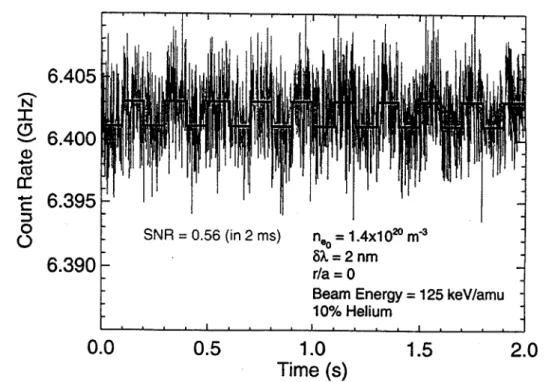
for the high density case, and a beam energy of 125 keV, the detected photon count rate will be - 6 x 10⁹ ph/s. Figure 4 shows the signal which would result, for a beam which is modulated at 5 Hz (0.1 seconds on, 0.1 seconds off) with 1 msec time averaging. In
general, the signal to noise ratio (SNR) is given by:
SNR= SCV , (2)
where S,, is the charge exchange signal, Sb is the continuum signal (both in photon/s) and t is the integration time. Taking the difference between two successive 0.1 second averages (t = 0.2 s) would, in this case, yield SNR ~ 5, as shown in figure 5.
In applying these calculations, an immediate concern is that, while counting statistics will certainly determine the minimum contribution to the noise, this minimum may not be achieved in the real experiment. It is heartening, in this regard, that CXRS measurements of the slowing down spectrum of D-T produced a particles have been recently reported from TFTR (McKee, et al. 1995). In the TFTR experiment, spectra out to about 0.6 MeV have been measured, even though the signal level at these energies was 1% or less of the bremsstrahlung continuum. In addition, time modulation of the beam during a shot was not available, so the data were taken on successive shots, one with the beam on, the second with it turned off. It is also worth noting that monitoring the continuum intensity simultaneously with the charge exchange measurements was crucial for the TFTR measurements. Similarly, on ITER it will be necessary to monitor the continuum in order to detect slow changes in the bremsstrahlung intensity. The presently planned ITER diagnostic set includes such a system, to measure Zeff. It might be convenient to use the same tangential view for both the CXRS and visible bremsstrahlung front end optics. Ion Temperature Measurements
Measuring ion temperature profiles, as well as those of rotation velocity, is in some ways simpler than measuring impurity density, since the absolute density of the donor neutral particles in the observation region need not be known, nor is it necessary to measure absolute brightness. However, because the desired information is contained in the spectral shape, there is a requirement to increase the spectral resolution of the measurement, by about a factor of 10. Thus, instead of the 2 nm which is required for the a ash density measurement, ~ 0.2 nm resolution, along with the need for multiple spectral channels, is required. From equation 2, it is apparent that, for the same SNR, a factor of - 10 will
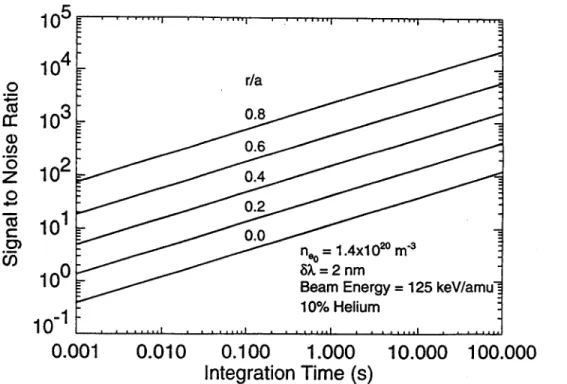
be lost in time resolution. Figure 6 summarizes the signal to noise for the thermal ash density measurements, which can be achieved with beam energy of 125 keV, as a function of integration time for several minor radii. All of these cases are calculated for the high density plasma (no = 1.4 x 10²⁰ m-3).
Assuming that SNR of 10 is sufficient, an integration time of about 2 seconds will be required for the central a ash density measurement; the situation improves rapidly as the radius of observation increases (due to the decrease of beam attenuation), so that at r/a = .5, a similar SNR can be achieved with 0.1 second time resolution. The results for ion temperature measurement are similar, except for the factor of 10 increase required. It would thus appear that, at least for the highest density operation, central T (as well as rotation) measurements will require very long integration times (10 seconds or longer), but profile information for r/a > 0.4 should be available with much higher time resolution. Things also improve rapidly if the plasma density is lowered, for two reasons: first, the beam transmission is roughly oc e(a/Aj), where A\ is the beam ionization mean free path, which is inversely proportional to density; second, the bremsstrahlung emissivity is oc ne One further consideration, with regard to measurement uncertainties, has been pointed out by von Hellerman (1993). Because of the exponential dependance of transmission on ionization, uncertainties in the ionization rates themselves lead to increasing uncertainties
1-III.
SNR = 0.56 (in 2 ms) 0.5 6.405 6.4006.395
1.0
Time (s)
1.5
Figure 4. Simulation of signal which could be expected if the noise is due solely to photon counting statistics. The square wave shows the expected signal if there were no noise. The 2 nm spectral width is chosen to look at thermalized He density, not temperature or rotation.
N M C 03
0
6.403
6.402
6.4011
6.400[
0.00.5
1.0
Time (s)
1.52.0
Figure 5. Results of averaging the simulated data of figure 4. The boxes indicate 0.1 ages, from successive times with the beam first off and then on.
second
aver-n = 1.4x10²m- 3
8= 2 nm
r/a =0
Beam Energy = 125 keV/amu
10% Helium 4--0
0
-~I
6.3900.0
712.0
0
03
00
07
- Signal (no noise) -SNR =5.5 (in .2 s)
105 4-101 r/a 0. 1 e 0
2
~ 0 -0=.m410
Beam Energy = 125keV/amu-10% Helium 1
0.001 0.010 0.100 1.000 10.000 100.000
Integration Time (s)
Figure 6. Signal to noise ratio, as a function of measurement time resolution (total of beam-on plus beam-off), for different values of normalized minor radius. These calculations are relevant to the
ther-mal & ash density measurement (6A = 2 nm). As discussed in the text, SNR for ion temperature measurements is reduced by one order of magnitude.
in the beam density as the attenuation increases: the fractional uncertainty in transmission is equal to (a/A2) -[6(As)/AJ], where S(A;)/A2 is the fractional uncertainty in A,.
The use of very high power, short pulse beams, based on ion-diode technology, has also been proposed
(Rej,
et aL., 1992; Bartsch, et al., 1995). The goal would be to develop beams with S x 109 W power and pulse length in the microsecond range. The beam would be pulsed repetitively, at up to 30 pulses per second.Compared
to the 5 MW conventional beam, the high power beam would yield signal increases of 103 for CXRS measurements. In this way, the signal to noise ratios obtained with a 1 pus beam pulse would be comparable to those obtained with the conventional beam in 1 second.CXRS measurements on Be, C, 0 and Ne will also be possible (and desirable). The effective cross sections increase with the Z of the target. At 125 keV/amu, the effective rate for C VI emission at A = 529.2 nm is about a factor of 5 greater than that for He II at 468.6 nm
(Fonck,
et aL., 1984; Zinov'ev and Korotkov, 1989). Since the expected helium density is more than a factor of 10 greater than that of C, the signal to noise ratios for C will be, if anything, slightly smaller than those shown for He.Fast Alpha Distribution
As already mentioned above, the spectrum of slowing-down D-T fusion produced 's
(Ea ; 0.6 MeV) was recently measured on TFTR, using CXRS (McKee, et al., 1995). (Higher energy spectra were also obtained on TFTR (Fisher, et al., 1995), using a lithium pellet charge exchange technique, observing outgoing neutrals produced in the pellet ablation cloud.) In principle, similar CXRS measurements could be undertaken on
ITER. The signals rapidly decrease with increasing a energy, and the expected density
of tail a's also decreases with energy. It is likely that CXRS measurements of the core non-thermal a distribution become impractical for energies greater than that where the density in a 0.2 MeV bandwidth is about 10% of the thermal density.
MOTIONAL STARK EFFECT
The final diagnostic application of DNB's considered here is the measurement of in-ternal magnetic field, and thus q profiles, by taking advantage of the motional stark effect
(MSE). As the high energy neutrals traverse the plasma, crossing the magnetic field, the
atoms, in their rest frame, experience an electric field, E = v x B. The resulting stark
effect shifts the energy levels in the atom, and line emission (e.g from Balmer-a) is split into multiple components. The various lines are also polarized, depending on the relative directions of v x B and the optical view (von Hellerman and Summers, 1993; Wroblewski and Lao, 1992; Levinton et al., 1989).
.0 0.5 1.0 1.5 2.0
Minor Radius (m)
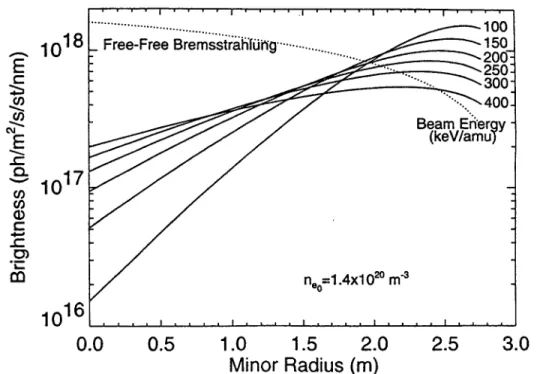
Figure 7. Balmer-a brightness in the unshifted o stark component, (polarized perpendicular to the electric field) as a function of minor radius for several beam energies. For comparison, the bremsstrah-lung continuum brightness profile is indicated by the dotted line.
In order to see a component of the poloidal magnetic field, as well as to provide a doppler shift to move the lines spectrally away from the edge neutral emission, it is necessary that the view of the beam not be tangent to the toroidal direction. Since beam attenuation remains as an issue for MSE, we again assume perpendicular injection along a major radius in the midplane, with a viewing angle of 45*. Figure 7 shows the results of a simulation, similar to those done for CXRS, giving the brightness in the central, unshifted
1018 E C,) E C) co 1017
1016
0 --... ---... .... 10 0 _Free-Free Bremsstrah0g-... 15 : --. .250' 300 ~ .. 400 Beam Ereray -(keV/amul n,0=1.4x1 020 m3 2.53.0
a component of Ha. The spectral width is determined by the doppler broadening; here we
assume this is dominated by the viewing cone for each spatial channel, taken to be ±0.8*.
The excitation cross-section, which for these energies is dominated by proton impact, does not fall as rapidly with increasing neutral energy as the CXRS rates. Consequently, because of the improving beam penetration, it is advantages to go to higher energies. For the highest electron density case considered (n0 = 1.4 x 10²⁰m~3), the on-axis signal reaches its maximum for an energy slightly in excess of 400 keV. Again the bremsstrahlung continuum is brighter than the signal of interest, but only by about a factor of 10 at r/a = 0. The measurement itself requires splitting the light into multiple polarization components, so for a given total intensity, the ultimate signal to noise ratio will be somewhat smaller than for CXRS. However, given the intensities in figure 7, it should be possible to measure poloidal field profiles with excellent time resolution (< 0.1 s).
CONCLUSIONS
A number of possible applications for diagnostic neutral beams on ITER have been considered. The optimum beam energy for charge exchange recombination spectroscopy is - 125 keV. Using such a beam, with about 5 MW injected power, CXRS should yield
quantitative measurements of the thermalized a ash density profiles. Concurrently, the availability of such a beam, and the associated spectroscopic diagnostics, will allow for measurements of other low Z impurity density profiles (Be, C, 0, Ne) as well as ion temperature and rotation profiles. For temperature and rotation, on-axis measurements will be difficult, and long integration times will be necessary (> 10 s); for r/a > 0.4, all of these measurements should yield accurate results with excellent time resolution. It is crucial, with respect to all these measurements, that the spectroscopic diagnostics collect as much light as possible, since the signal to noise ratio improves with the square of the number of detected photons. For the same reason, the time resolution which can be achieved, for a given SNR, improves rapidly with decreasing density, since the bremsstrahlung continuum emissivity is proportional to ne2
DNB's can also be used to measure internal magnetic field, through the motional stark effect. In this case, the optimum beam energy is closer to 500 keV, requiring a separate beam from that used for CXRS. Consideration should be given to using one of the heating beam sources (operating in hydrogen, with modulation) for this purpose.
ACKNOWLEDGEMENTS
The author is pleased to acknowledge helpful discussions with G. McCracken, J. Terry, J. Goetz, M. Greenwald, M. von Hellerman, R. Fonck, B. Stratton, C. Barnes, P. Thomas, M. Sasao, A. Costely, V. Mukhovatov, and K. Young.
This work is supported by U.S.DoE Contract No. DE-AC02-78ET51013.
REFERENCES
M. Bitter, et al., 1993, in Atomic and Plasma-Material Interaction Processes in Controlled Thermonu-clear Fusion, R.K. Janev and H.W. Drawin (editors), Elsevier Science Publishers, Amsterdam,
page 119.
A. Boileau, et al., 1989, Plasma Phys. Contr. Fusion 31 779.
R.D. Durst, et al., 1992, Rev. Sci. Instrum. 63 4907. R.K. Fisher, et al., 1995, Phys. Rev. Lett. 75 842. W.L. Fite, et al., 1960, Phys. Rev. 119 663. R.J. Fonck, et al., 1984, Phys. Rev. A 29 3288.
E.L. Freeman and E.M. Jones, 1974, Atomic Collision Processes in Plasma Physics Experiments I, UKAEA Report CLM-R137, Culham Laboratory, Abingdon, England.
H.B. Gilbody and J.V. Ireland, 1964, Proc. Roy. Soc. A-277 137. K.W. Hill, et al., 1992, Rev. Sci. Instrum. 63 5032.
R.C. Isler, 1977, Phys. Rev. Lett. 38 1359.
ITER, 1995, Report S CX MI 3 95-03-23 F 1, Minutes of the Second Meeting of the ITER Physics
Ex-pert Group, Naka, Japan.
ITER Diagnostic Group, 1995, Report S 55 RE 1 95-07-11 F 1, ITER Information: Updated Background
Information relating to Diagnostic Task Agreement.
R.K. Janev, et al., 1987, Elementary Processes in Hydrogen-Helium Plasmas, Springer-Verlag, Berlin. K. Kadota, et al., 1980, Nucl. Fusion 20 209.
F. Levinton, et al., 1989, Phys. Rev. Lett. 63 2060.
G. McKee, et al., 1995, Phys. Rev. Lett. 75 649. E.J. Synakowski, et al., 1990, Phys. Rev. Lett. 65 2255. D.J. Rej, et al., 1992, Rev. Sci. Instrum. 63 4934.
M.G. von Hellerman and H.P. Summers, 1993, in Atomic and Plasma-Material Interaction Processes in Controlled Thermonuclear Fusion, R.K. Janev and H.W. Drawin (editors), Elsevier Science
Pub-lishers, Amsterdam, page 45.
K. Widman, et al., 1992, Rev. Sci. Instrum. 66 761. R.C. Wolf, et al., 1993, Nucl. Fusion Lett. 33 663.
D. Wroblewski and L.L. Lao, 1992, Rev. Sci. Instrum. 63 5140. A.N. Zinov'ev and A.A. Korotkov, 1989, JETP Lett. 50 307.