Active Portfolio Management Adapted For the Emerging Markets
by
Dohyen Nam
B.A. Business Administration Yonsei University, 2000
SUBMITTED TO THE MIT SLOAN SCHOOL OF MANAGEMENT IN PARTIAL FULFILMENT OF THE REQUIREMENTS FOR THE DEGREE OF
MASTER OF SCIENCE IN MANAGEMENT STUDIES
MASSACHUSETTS INSTITUTE
OF TECHNOLOGY AT THE
MASSACHUSETTS INSTITUTE OF TECHNOLOGY
JUN 15 2011
JUNE
2011LIBRARIES
C2011 Dohyen Nam. All rights reserved.
ARCHIVES
The author hereby grants to MIT permission to reproduce and to distribute publicly paper and electronic copies of this thesis document in whole or in part
in any medium now known or hereafter created.
Signature of Author:
May 6, 2011 MIT Sloan School of Management Certified by:
S.P. Kothari
Gordon Y Billard Professor of Management
- Thesis Supervisor
Accepted by: _
Michael A. Cusumano
SMR Distinguished Professor of Management
Program Director, M.S. in Management Studies Program MIT Sloan School of Management
Active Portfolio Management Adapted For the Emerging Markets
by
Dohyen Nam
Submitted to the MIT Sloan School of management on May 6, 2011 in partial fulfillment of the
requirements for the Degree of Master of Science in Management Studies
ABSTRACT
In the emerging markets with a fast growing economy but a not quite efficient capital market, investors try to find a constant excess return against the benchmark from active portfolio management. In this paper, after defining what an active portfolio is, we tested various alpha generating strategies empirically in the emerging markets and reviewed possible asset allocation models as implementation methods for those alpha generating strategies.
For finding adaptable alpha strategies for the emerging markets, an empirical study was
carried out for four possible alpha generating strategies - value and growth strategy,
Fama-French multi-factor strategy, residual earning strategy, and momentum strategy - in 14
emerging countries. The results from alpha testing for fundamental strategies showed a positive correlation between the alpha return and the multi-factor used in size and book-to-market ratio in most Asian countries. Also, the results for technical strategy commonly showed mean-reversion effect in the short run in most emerging countries.
Following this empirical test results, we discussed the two possible asset allocation models adapted for active portfolio management to implement alpha generating strategy: Treynor-Black Model and Treynor-Black-Litterman Model. These two models allow us to input the alpha return and risk obtained by the empirical test results in order to complete active portfolio management.
Finally, we expect the completion for active portfolio management adapted for the emerging markets with the empirical test results and the implementation methods.
Thesis Supervisor: S.P. Kothari
TABLE OF CONTENTS
A b stract...3
1. Introduction ... 7
2. Active Portfolio Management...12
2. 1 Main Concepts of portfolio management...13
2.1.1 The Capital Asset Pricing Model...13
2.1.1.1. Mean-Variance Portfolio Analysis...13
2.1.1.2. Separation theorem and Capital Market Line...16
2.1.1.3. Capital Asset Pricing Model (CAPM)...19
2.1.2. Efficient Market Hypothesis...20
2.2. Study of portfolio management on Emerging markets...22
2.2.1. Empirical Evidence of inapplicability of the CAPM on Emerging Market..22
2.2.2. The status of the EMH on Emerging markets...24
2.3. Definition of active portfolio...26
2.3.1. Alpha and Information Ratio...26
3. Alpha Generation strategy...30
3.1. Fundamental Valuation Strategy...30
3.1.1. Traditional approach: Value stock vs. Growth stock...31
3.1.2. Fama and French three factors Model...34
3.1.3. Residual earnings Model/Abnormal earnings growth Model...38
3.2. Technical trading Strategy...42
3.2.1. Momentum Trading Strategy...43
3.2.2. Moving average technical trading rule...44
4. Empirical Evidence of alpha generating strategies in the emerging markets...47
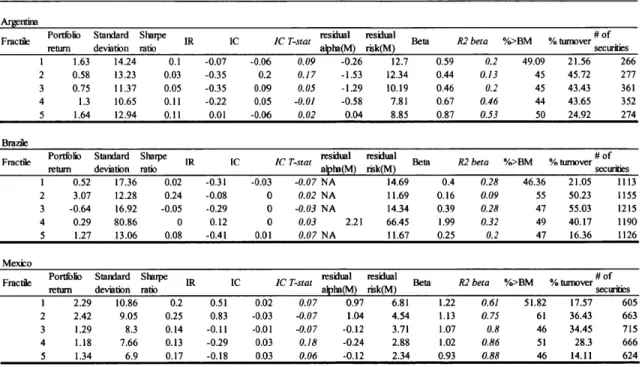
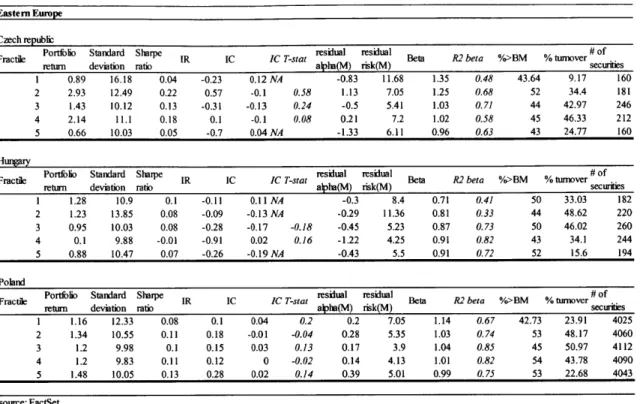
4.1. Sample, Portfolio Strategies and Evaluating Methodology...47
4.1.1. D ata... 47
4.1.2. Research Design...49
4.1.3. The results of empirical tests...53
4.1.4. Empirical evidence of fundamental and technical analysis...74
5. Implementation methods for alpha generating strategies: Asset allocation...77
5.1. Portfolio C onstruction...77
5.1.1. Treynor-Black Model...78
5.1.2. Black-Litterman Model...82
6. C onclusions... 90
1. Introduction
In the current financial market, the presence of an active portfolio management is a controversial issue for investors. Many famous managers boast of achieving a high residual return for several years of active portfolio management. However, the names of successful managers constantly change over time. Therefore, it may be impossible for the managers to maintain a positive long-term alpha return. Moreover, the average return for passive managers who invest in the market index outperforms those for the average active managers. Despite this fact, investors still pursue active portfolio management to get a higher return constantly than the market return from their own alpha generating strategy. Especially, in the emerging markets which is a fast growing region, investors believe that there are a lot of opportunities for managers to catch the alpha strategies from the experience of developed markets because the emerging market follows the track of the developed markets.
From this intuition, we focus from the start to the end on the active portfolio management adaptable for the emerging markets. To complete the active portfolio management, managers need to go through several steps. First, managers define the active and passive portfolio management and define the alpha. Second, they find the alpha generating factors for the emerging markets. Finally, after finding the possible alpha generating factor, they construct an optimal portfolio through asset allocation model.
The objective of this paper is to verify the alpha generating strategies in the emerging market through the empirical tests and to construct an efficient active portfolio using the
First, we define active portfolio management. We deal with basic concepts of portfolio management theory academically. We study CAPM which is related to the risk of an individual security to its expected returns and Harry Markowitz's mean-variance portfolio theory, including the efficient frontier in order to find an optimal portfolio in theory. Additionally, we enlarge the study to Tobin's Separation theorem to set the market portfolio as the optimal risky portfolio. After studying CAPM, we look over Efficient Market Hypothesis. If the market is a strong-form efficient market, there is no excess return because the stock price reflects all information. However, if the status of the emerging market is not strong-form efficient market, we can find various alpha strategies because the market is not perfectly efficient. After looking at the main concepts of portfolio theories, we focus on the emerging markets and find empirical evidence of inapplicability of the CAPM on Emerging markets. Moreover, we find evidence of whether the emerging market is weak- or semi-strong- or semi-strong-form efficient from the empirical results conducted by other researchers targeting the emerging markets. After confirming the probability of the existence of alpha generating strategies from the research and setting the benchmark which represents the market or optimal portfolio, we define the alpha generating strategy using information ratio, information coefficient, and residual return and risk.
Secondly, we study and pre-design several alpha generating strategies. We divide strategy into two categories: fundamental valuation strategy and technical strategy. Fundamental valuation strategy is related to the firm specific information. Many researchers set their portfolio strategy using various internal factors such as book to price, P/E ratio, EPS, Market Capitalization, and etc. to find constant alpha. Depending on the market development,
investors use different factors to generate alpha return. We try to find suitable variable sets according to efficiency levels of emerging markets and make the alpha strategy using the signal from those variables. Traditionally, value and growth approach based on the firm's accounting information is a well known fundamental strategy and we categorize the value and growth stocks through the book-to-market ratio in the emerging market and investigate which conditions are needed for making alpha return through this approach. Additionally, we look over the Fama and French three factors Model. This factor model is very famous in the academic field. Through this model, we may find excess return which can't be explained by CAPM. We investigate whether the combination of size and book value factor captures residual return and we make the active portfolio from those factors. Moreover, currently, many investors focus on earnings quality and try to analyze the firm's financial statements in a more sophisticated way in order to capture a firm's sustainability of earnings. Residual earnings model may capture alpha return by investing in good firms with sustainable earning potential. Therefore, we may make another active portfolio from residual earning model in the emerging markets. In technical strategy, we look over the momentum strategy and moving average trading rule. Momentum strategy focuses on a stock's historical performance. We study the momentum strategy created by Jegadeesh and Titman and classify the winner and loser stocks from the historical stock price in the emerging market. Then we set the active portfolio with momentum scheme. Moving average trading rule is another technical approach.
Moving average rule relies on a comparison of a short-run moving average with a long-run moving average in order to catch the signals. Honestly speaking, although this is not a portfolio strategy but a trading rule, we expect that the trading policy followed by moving average rule may capture the alpha return especially in the emerging market which is not perfectly efficient.
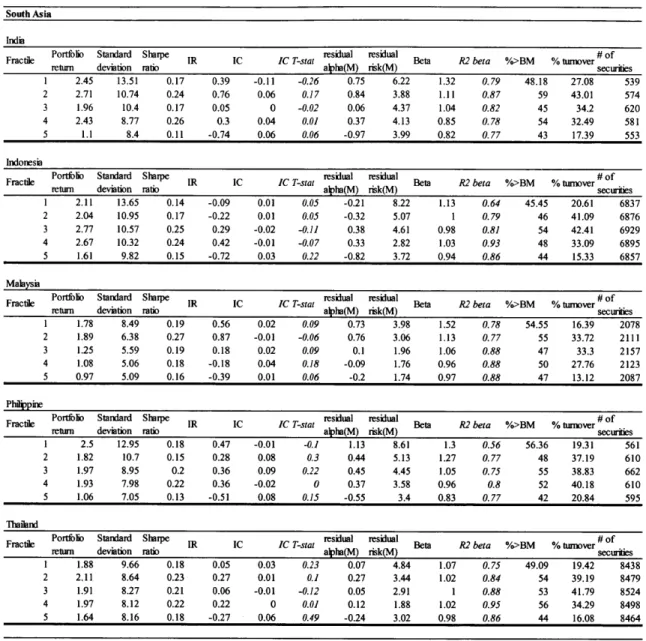
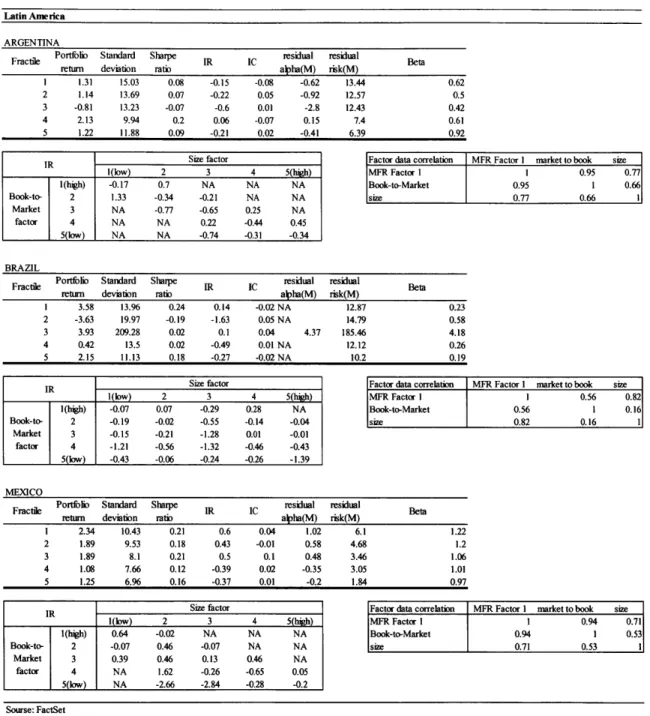
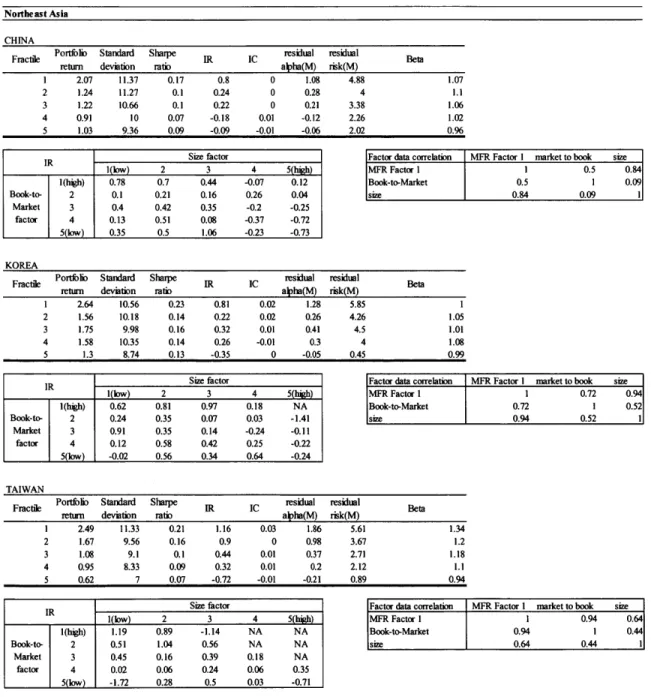
The third step is to run the empirical tests in the emerging market. After we select the possible alpha generating strategies from the research, we run the empirical tests to verify whether those alpha generating strategies are well adapted for the emerging markets. Among the countries included in the emerging market index, we choose the main countries where the financial data is available and where it is credible to do the empirical tests. Empirical tests will be focused on the evidence of the alpha generating for each strategy. We can verify whether the strategy makes the constant alpha from empirical results of the information ratio (IR), information coefficient (IC), and residual return and risk in the emerging market.
The final step of the paper is to research the efficient implementation methods in order to adapt our alpha strategies confirmed from the empirical tests into the active portfolio management. Alpha strategies focus on finding alpha generating factors in the emerging markets. However, to make an efficient portfolio from the strategies, we need the implementation tools which are represented by the asset allocation methods. As we have indicated in the first chapter, the basis of the asset allocation methods is Markowitz's mean-variance portfolio theory. However, due to several restrictions, Markowitz's portfolio optimization is not the proper method for active portfolio management in practice. Therefore, we need to research the advanced asset allocation model in order to efficiently implement the alpha strategies. We introduce the Treynor-Black Model and Black-Litterman Model which are widely used in investment banks in the emerging markets. Then we show how to work our finding of residual alpha and risk from the empirical tests into the Treynor-Black and Black-Litterman Models. Through the research, we will make a suitable methodology to get the desirable input sources adapted in the emerging markets.
Following these processes, we find proper alpha generating factors from the empirical test results. The results from alpha testing for fundamental strategies showed a positive correlation between the alpha return and the multi-factor used in size and to-market ratio in most Asian countries. The portfolio consisting of small firms with high book-to-market ratio, constantly generates alpha return against the benchmark in Asian countries. Also, the results for technical strategy commonly showed mean-reversion effect in the short run in most emerging countries. Return on the portfolio consisting of firms with high historical performance in the short period of time tends to reverse the return to mean.
From these findings, we catch the size factor and value factor from fundamental analysis and mean-reversion factor from technical analysis. Alpha generating factor is the main ingredient for progress for the next step of active portfolio management because expected residual return and risk can be derived from the alpha generating factor. Then, we discussed two asset allocation models which are Treynor-Black and Black-Litterman model as portfolio construction methods adapted for active portfolio management. As a result, we completed active portfolio management adapted for the emerging markets with the alpha generating factor from the empirical test results and the portfolio construction methods from the active asset allocation models.
2. Active Portfolio Management
In this chapter, we need to define the active portfolio management. Before studying the active portfolio management directly, we deal with basic concepts of portfolio management theory academically.
First, we look over the main concepts of portfolio management. We study Harry Markowitz's mean-variance portfolio theory including the efficient frontier in order to define the portfolio risk and return, establish the relationship between risk and return, and finally find the optimal portfolio in theory and we look into Tobin's Separation theorem dealt with risk-free asset and risky asset which is necessary for understanding the concept of capital market line. Then, we study the CAPM formula which is related to the risk of an individual security to its expected returns
After studying CAPM, we enlarge the research for the Efficient Market Hypothesis. Efficient Market Hypothesis is important for the study of the active portfolio management in emerging markets because, according to the status of emerging market based on EMH, we can decide which factors are more reasonable sources for generating alpha in the emerging markets. For example, if the emerging market denies weak-form efficiency, we can generate alpha strategy from historical price information. In other words, if the emerging market is weak-form efficient but is not semistrong-form efficient, we need to use the firm's reported financial information to find proper alpha strategy.
empirical research about the evidence whether CAPM theory is applicable for the emerging market or not. Moreover, we research whether the emerging market is weak- or semistrong-or strong-fsemistrong-orm efficiency based on EMH. If we can deny the emerging markets are not strong-form efficient or we cannot explain the security return by the CAPM formula, we can confirm the existence of alpha generating portfolio strategies. Afterwards, we define the active portfolio management from the definition of alpha and introduce information ratio to measure the quality of alpha.
2.1. Main Concepts of portfolio management
2.1.1. The Capital Asset Pricing Model
2.1.1.1. Mean-Variance Portfolio Analysis
Markowitz's mean-variance portfolio selection model is the most important inception
in modern finance theory, especially in the investment field (Markowitz, 1952). According to
his theory, the rational investors want to maximize the discounted value of future returns. However, those expected returns include an allowance of risk. Therefore, the rational investors should focus on not only expected return but also risk. Markowitz measured the expected return by the discount value of uncertain future returns and the risk by the standard deviation of its expected value. The more important concept is that the returns from securities are not independent but inter-correlated. Therefore, if the investors invest in a large number of securities, there is a diversification effect. We can show this analytically. Assume there are
by ai, portfolio weight of security i denoted by wi, and covariance of security i and
j
denoted by aYi.
Then Markowitz showed that the expected return and variance of the
expected return on portfolio is
N r = wiri N N p=
wiwY.
i ijWhere,
Nwi= 1,
ai
=Pijaiaj(-
15 Pij
51)
Also, Markowitz demonstrated that a quadratic program with an objective function of
maximizing an optimal portfolio.
Max (rp
- XaC2)Where:
A
= risk aversionIn this formula, because the correlation coefficient of two securities is between -1
and 1, the standard deviation on portfolio is always less than the simple weighted average
standard deviation of the securities. We call it the diversification effect. Therefore, through
rp and up we can plot risk and return on each portfolio in the mean-variance plane. The set
of all obtainable portfolios is as in Figure 1.
Figure 1
Expected
Efficient Frontier
Return
A portfolio
.B portfolio
C portfolio
All attainable portfolio
Risk
As shown in Figure 1, an investor can invest in any portfolio which plots inside the
circle such as A, B, and C portfolio in the mean-variance plane. However, the rational
investor chooses the portfolio A rather than B because A portfolio shows higher return and is
less risky than B portfolio. In other words, B portfolio is dominated by A portfolio. Another
key concept of the Markowitz's mean-variance portfolio selection model is the efficient
frontier. The highlighted upper boundary shown in Figure 1 is called the efficient frontier that
means the portfolio set on the efficient frontier shows the highest expected return for a given
level of risk and the lowest risk for a given level of expected return.
The mean variance portfolio selection model and efficient frontier are the basic
concepts of portfolio management. Keeping in mind this concept, we expand the two main
academic theories related to the active management: the William Sharpe's capital market line
and James Tobin's separation theorem.
2.1.1.2. Separation theorem and Capital Market Line
J. Tobin advanced the area of the portfolio theory using Keynesian model of liquidity
preference (Tobin, 1958). He introduced the genius concept which is an essential ingredient of the Capital Market Line: an inverse relationship between the demand for risk free asset and interest bearing asset and the opportunity locus.
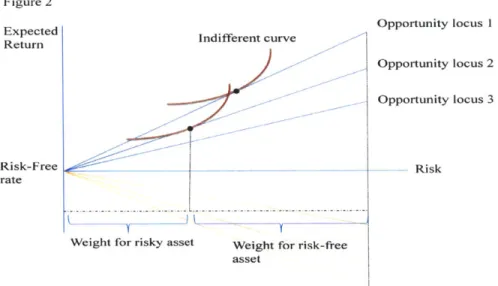
Prior to looking over an inverse relationship and opportunity locus, we need to know about the indifferent curve. The investor's preference for portfolio selection is represented by his or her own indifferent curve which maximizes the expected value of his or her utility. Under the assumptions that an investor prefers higher expected return to lower expected return and exhibits risk aversion, the shape of the investor's indifference curves between mean and standard deviation will be settled by his utility-of-return function and show a concave upward-sloping. Surely, we need another assumption that the probability distribution between mean and standard deviation is approximated by normal distribution in order to draw a conclusion. Figure 2 shows the indifferent curve on the mean-variance plane.
To draw the opportunity locus, we set the portfolio A consisting of a proportion w of risk-free asset and (1 -w) risky asset. The expected return on a portfolio A is
E(Ra) = wrf + (1 - w)r,
Where, rf = return of risk - free asset
rp = return of risky asset
a= w2a + (1 -w)2 + 2w(1 - w)afp
Where, of = standard deviation of risk-free asset
UP = standard deviation of risky asset
cyfp = covariance between risk-free asset and risky asset
Since of and ofp are equal to 0, we simplify the standard deviation on a portfolio
A
a= (1 -w)p
When we look over the relationship between E(Ra) and aa, we can derive
E(Ra) = wrf + aa
UP
Therefore, we can draw the linear line on the mean-variance plane. Tobin defined this
linear line as the opportunity locus. Eventually, Tobin asserts that the tangent point between
the indifferent curve and the opportunity locus is optimal portfolio with risk-free asset and risky asset.
In figure 2, we can identify the relationship more clearly.
Indifferent curve'
Weight for risky asset Weight for risk-free
asset
Opportunity locus I
Opportunity locus 2 Opportunity locus 3
- Risk
Then if we combine Figure 1 with Figure 2,
Figure 3 Expected Return Risk-Free rate Opportunity locus 1 Opportunity locus 2 Effici ror tier
Opportunity locus 3 A attainable R portfolio /-Risk Figure 2 Expected Return Risk-Free rate
As we see from the above figure, there is no opportunity locus above the efficient frontier. Even though we can draw the opportunity locus 2 or 3, those risky portfolios are dominated by the portfolio on the opportunity locus 1. There are no investors who want to invest in the risky portfolio below the opportunity locus 1 because the portfolio has a lower expected return given by certain risk level or higher risk with the same expected return. Therefore, we can ignore other opportunity lines except for opportunity locus 1 which meets the efficient frontier. W. Sharpe defined this opportunity locus 1 as the capital market line and tangent point between CML and efficient Frontier as optimal portfolio which ensures that the aggregate of all investors' holdings will itself be efficient. In the equilibrium world in which
all investors behave rationally and the market is perfectly efficient, there is no reason for investors to hold a different risky portfolio. The most important point in this concept denies the existence of active portfolio management.
2.1.1.3. Capital Asset Pricing Model (CAPM)
CAPM is widely used practically by estimating the cost of capital for the firm and evaluating the performance of portfolio management. W. Sharpe focused on the question "How are the capital asset prices determined in the individual security level?"(Sharpe, 1964) He constructed a market equilibrium theory of asset prices under condition of risk. It is called Capital Asset Pricing Model. CAPM states that an individual asset's rate of return divided into two parts: the perfectly correlated return on the market portfolio and uncorrelated return with the market return. We can define p as the correlation between the individual security and the market portfolio.
Cov(rp, rm)
P Var(rm)
Therefore, we can obtain the regression of the rate of return on the individual security p.
Rp = Rf+ (Rm - Rf)@p + ap+Ep
When we calculate the expected value, expected residual return on the security p should be zero. Therefore, finally we can get CAPM formula
E(Rp) = Rf + (E(Rm) - Rf)pp
This formula tells us that the expected return on individual security is determined by risk-free rate, market risk premium, and beta. The fact that there is no residual excess return explains that investors should hold the market portfolio under the assumption that all
investors have the same expectations and the market is perfectly efficient. As a result, in this paper, we can use the expected return on the individual stock from the CAPM as a benchmark return and the market portfolio as a benchmark portfolio in order to measure the residual return and risk.
2.1.2. Efficient Market Hypothesis
As mentioned above, the CAPM works only under the assumptions of all investors' rational behavior and perfect market efficiency. Even though there is a lot of research about behavioral finance and empirical evidence of this topic, we decide the behavioral finance as out of our scope and focus only on the market efficiency.
forms of market efficiency. The Efficient Market Hypothesis is that the markets are extremely efficient so the price of individual security reflects all available information. In other words, the individual security reflects new information as soon as it is published. Therefore, we cannot predict tomorrow's security price because we cannot know tomorrow's information. The Efficient Market Hypothesis is closely related to random walk theory. If it is true, the market does not allow investors to eam constant alpha which is above-average market return without bearing higher risk than the market. Thus, the efficient market hypothesis supports the CAPM formula.
Since the theory was published, many scholars including Fama (Fama, 1964) have run empirical tests about the Efficient Market Hypothesis. The scholars mainly dealt with the informational efficiency and security price behavior in various manners in the developed markets. After the empirical tests, the EMH was classified by 3 forms depending on the information levels: weak-form, semistrong-form, and strong-form EMH.
The weak-form of the EMH express that the current security price reflects all information implied by the historical prices. Therefore, technical analysis only using the historical trends of price does not create added value under the weak-form efficiency. The second form is the semistrong-form of the EMH. This form states that the security price reflects all generally available public information. Therefore, investors cannot earn the excess return with the fundamental analysis through the published financial statement of the firm. As well, the information needed for the public announcement such as stock splits and dividend change is immediately reflected on the security price. Final version of the EMH is the strong-form of the EMH. The strong-strong-form of the EMH states that the security price already reflects
not only public information but also internal, unpublished information. As a result, the investors cannot earn extra profit from any of the valuable information. Empirically, every nation has a different form of the EMH. Especially, as the capital market develops, information efficiency level increases. Therefore, the market moves from weak-form to strong-form according to the pace of capital market development. If the market has fully developed and become strong-form of the EMH, active portfolio management would have disappeared. However, very little support has ever existed for the extreme interpretation of the strong-form EMH even in the developed market. Moreover, nowadays, research showed that the emerging capital market located some points between weak-form and semistrong-form of the EMH (Alexakis et al., 2010; Alexakis, Patra, & Poshakwale, 2010; Aquino, 2006; Balaban & Kunter, 1997; K. Cheung & Coutts, 2001; Grieb & Reyes, 1999; Kawakatsu & Morey, 1999; Ozdemir, 2008; Siourounis, 2002). In the next chapter, we search the empirical evidence about the application of CAPM and the status of EMH in the emerging markets in order to confirm the possibility of the alpha strategy in active portfolio management.
2.2. Study of portfolio management on Emerging markets
2.2.1. Empirical Evidence of inapplicability of the CAPM on Emerging Markets
Practically, the CAPM has been criticized by many researchers in that the expected return for the portfolio is accounted only for the systematic risk which is measured by beta if the portfolio is completely diversified.
developed market. Richard J. Dowen (Dowen, 1988), who focused on the research whether sufficiently large portfolio could eliminate all non-systematic risks, concluded that even sufficiently large portfolio constructed only by beta would have the level of non-systematic risk and therefore those portfolios are substantially riskier than that estimated by the CAPM. However, even though Fama and French (Fama & French, 1992; Fama & French, 1996) concluded that there is virtually no relationship between the beta and the expected return in a short period, the research for the re-examination of the cross-section of expected stock returns conducted by S.P. Kothari et al (Kothari, Shanken, & Sloan, 1995) showed that there is a significant relationship between the beta risk and expected return on the annual basis. After 70s, in the developed market, many researchers insisted that the beta could use a useful tool of portfolio construction but not as an only tool.
Compared with the developed market which is a more efficient market, the emerging market is far less appropriate for the CAPM theory. The asset price cannot be explained only
by the market risk. In fact, there are many other factors to affect the asset price such as P/E
ratio effect, size effect, seasonality, and book to market effect. Inapplicable of the CAPM in the emerging market means there is enough room for catching the sustainable excess return.
Empirically, many researchers have tested the empirical evidence to verify the CAPM in the emerging market especially in Asian stock markets for the last two decades. K.A. Wong et al (Wong & Tan, 1991) tested the empirical relationship between portfolio returns and the various measures of risks which are systematic, unsystematic, and total risk in the Singapore market using the weekly data, the same as Fama and MacBeth (Fama & MacBeth, 1973) research. They concluded that the application of the CAPM in Singapore
market is improper because there are no significant relationships between stock returns and any types of risks. The research conducted by K. Bark (Bark, 1991) implied almost the same conclusion even in the Korean Stock market. She used the same methodology of Fama and MacBeth and concluded that there is no significant evidence of a positive trade-off between market risk and return and residual risk plays an important role in the stock return. She analyzed that the emerging market is not efficient yet and the investors hold highly undiversified portfolios. Above this, various empirical researchers carried out in the emerging markets including Hong Kong, Taiwan, and Singapore during the 1990s (Chan, 1997; Y Cheung & Wong, 1992; Y Cheung, Wong, & Ho, 1993; Wong & Tan, 1991). Almost all researches got similar results that the systematic risk could not account for the expected returns either on the weekly or the monthly basis.
According to those empirical tests of the application for the CAPM, especially in the emerging markets, there are other factors except on the beta on the effect of stock's expected return. In other words, the active portfolio management works well in the emerging market and investors have more opportunity to earn the constant residual excess returns on their portfolio using proper alpha strategy in the emerging market than in the developed market. In the next section, we will find another reason for active portfolio management well adapted for the emerging market through the market efficiency level.
2.2.2. The status of the EMH on Emerging Markets
Since 1970, various empirical tests have been tested to verify the Efficient Market Hypothesis usually in the developed market. While the emerging capital market started to
open to the foreign investors and eased the regulations, empirical tests of the EMH has been tested for the emerging market since the last decade.
Most of the research was focused to confirm the weak-form of the EMH. In this section, we mention about various empirical tests and methodologies and estimate the current market efficiency in the emerging market.
A. Antoniou et al (Antoniou, Ergul, Holmes, & Priestley, 1997; Cooray &
Wickremasinghe, 2008) researched the phenomena that investors use technical analysis to make an alpha although investors believe that the emerging capital markets are weak-form efficient. They analyzed the market efficiency with the level of trading volume of the company in the emerging market and concluded that prices on stocks with high volume cannot predict future returns with the past sequence of prices but future prices of stocks with low volume can be predictable using moving average model in the Istanbul stock market. More recently, Arusha V. Cooray et al (Cooray & Wickremasinghe, 2008) examined the efficiency in the South Asian stock markets including India, Sri Lanka, Pakistan, and Bangladesh. Using classical root tests, they concluded that all those 4 countries' stock markets support weak-form efficiency hypothesis. Additionally, they examined semistrong-form efficiency through Cointegration and Granger causality tests and as a result refute the validity of the semistrong-form efficient market hypothesis for the emerging markets. Several researchers have studied the empirical tests about the EMH specially to verify that the emerging market is weak-form efficient with various methods such as the augmented Dickey-Fuller test and Variance-ratio test. As a result, almost all results supported a weak-form EMH of the emerging market. Very recently, C. Alexakia et al (Alexakis et al., 2010) examined the
predictability of stock prices in the Athens Stock Exchange by using the published information such as accounting information. In other words, their objective is to confirm whether the emerging market becomes a semistrong-form efficient market. Research showed that the portfolio selected by financial ratios produces a higher return than the benchmark. Therefore, the stock prices do not fully reflect on those published accounting information and hence it is not supported by the semistrong-form EMH.
According to those various researches, in contrast with the developed market, the emerging market is not quite efficient. Nowadays, even though the emerging market is rapidly developing, the efficiency level in the emerging market is still low. As a result, investors can make alpha profits from the portfolio using the fundamental analysis. Even though the past sequence of prices is not quite useful for the estimation of future prices in a short period, technical analysis adjusted by other factors such as trading volume will be meaningful to make sustainable alpha profits.
2.3. Definition of active portfolio
2.3.1. Alpha and Information Ratio
Through the previous chapters, we look over the portfolio theories and, under the perfect capital market, the active portfolio management does not survive and all investors invest their money in a combination of risk-free asset and the market portfolio which has the highest expected return given the level of risk depending on an investor's indifferent curve. However, according to the empirical evidence in the emerging markets, the researches
implied that there are various alpha generating strategies to capture consistent alpha, record high information ratio and value added in the emerging market. In this section, we define the active portfolio with residual return (alpha) and risk, information ratio, and information coefficient.
Basically, the objective for active portfolio management beats the market on a regular basis. Therefore, before we define the active portfolio management, we need to define the benchmark. As mentioned above, the CAPM states that expected return on the security is decided by the beta which is the market risk factor and hence defined that the expected residual return equals to zero. Therefore, in the individual stock level, the expected return from the CAPM formula is a good candidate as a benchmark return of the security. In the portfolio level, W. Sharpe defined the aggregate sum of all securities in the market as the market portfolio and the market portfolio as an optimal combination of the risky asset. Therefore, benchmark of the portfolio is the nation's index. This is reasonable for the emerging market because the nation index of the emerging countries is usually calculated to use the market capitalization method. Using the benchmark defined by the CAPM, we can define the active portfolio as the portfolio with expected residual excess returns.
Then we can define the alpha. Ex ante Alpha is the expected residual returns and ex post alpha is the average of the realized residual return compared to the benchmark. When we
study the CAPM, we defined the return of portfolio p through below formula.
Rp = Rf+ (Rm - Rf)@p + Cp + Ep
, = ap + Ep
Where, a1p= the average residual return
Ep= the stochastic component of error term
The CAPM assumed expected residual return E (0p) is equal to 0. However, if there is constantly positive Op, we can confirm the portfolio has an alpha.
The residual risk is the risk exposure after excluding the known or systematic risk. This value is calculated by the below formula
IVar(rp)
-
P2 xVar(rm)
Where, rp: the return of the portfolio
rm: the return of the market or the benchmark
If the portfolio has high alpha, is this a good active portfolio? We cannot answer directly. If the portfolio requires higher residual risk in order to make alpha, investors easily know that the portfolio is not managed efficiently. Therefore, when active managers construct the active portfolio, they need to consider information ratio denoted by IR which is a ratio of annual residual return to annual residual risk. The information ratio for portfolio P is
IRp =
(AP
Where, op = portfolio residual risk.
IR is related to the t-statistic for the portfolio's alpha which is simply a ratio of the
annualized estimated alpha to the annualized standard error of the estimate. Therefore, IR is a good parameter to measure whether the alpha differs from zero.
According to Active portfolio management written by Grinold et al. (Grinold & Kahn, 2000), IR could be calculated by the general formula called the fundamental law of active portfolio which explains IR in terms of breadth and skill.
IR = IC x Vli
Breadth denoted by BR is the number of independent forecasts of residual return per year and Information coefficient denoted by IC is the correlation coefficient between expected residual return and actual residual return. If we define the actual market direction as variable x and the forecast as variable y, then IC is
N
IC = Cov(xt, Yt) = xtyt
t=1
Where xt, yt-N(0,1) and N = N bets on market direction.
According to the empirical observations conducted by Kahn and Rudd (Kahn & Rudd, 1995) in the US stock market, top-quartile active portfolio strategies got over 0.5 of IR on the after-fee basis.
After this chapter, we will investigate various possible alpha strategies adapted in the emerging markets. With the alpha formula above mentioned and the empirical tests, we can verify whether the active strategies create excess value on the portfolio. If so, we can find out how valuable those strategies are from the IR and IC analysis.
3. Alpha Generation strategy
After we define the alpha, we investigate several alpha generating strategies in this chapter. As we look at the alpha in the previous chapter, if investors select stocks which have constantly higher returns compared to the expected returns calculated by the CAPM, we can conclude that those strategies will generate alpha return. Many active portfolio managers seek to select those stocks using the firm-specific information or using the firm's past performance. We call the strategy using the firm-specific information the fundamental valuation strategy and the strategy using the firm's past performance the technical trading strategy.
In this chapter, we study three fundamental valuation strategies and two technical trading strategies academically. We investigate the basic concepts of those strategies, search the method of how investors selected the stocks using those strategies, look into the empirical evidence conducted by many researchers in the developed market, and finally check what those concepts mean in the emerging markets.
3.1. Fundamental Valuation Strategy
Traditionally, the fundamental approach is one of the well-known strategies to generate alpha return in the field of active portfolio management. Basically, many investors run various valuation models using the finn's accounting data in order to find the firm's proper value. Since the early 1900s, many scholars developed the valuation methods using various accounting numbers as an input data. Many empirical and academic researches determine that book value, earnings, and cash flows are the most valuable variables to
evaluate the firm's proper value and to decide whether the current price is overpriced or underpriced among various useful accounting numbers. In this chapter, we consider three well-known valuation approaches: value vs. growth which uses the book-to-market ratio, Fama-French three-factor model which uses book-to-market ratio and market capitalization, and Residual Income valuation model which uses book value to the equity, earnings, and cost of equity. We study the basic concepts of those three fundamental valuation strategies and the results of the empirical evidence in the developed markets.
3.1.1. Traditional approach: Value stock vs. Growth stock
If returns on stocks which share unique characteristics always outperform or
underperform to the market return and investors capture those characteristics, we can make an active portfolio with a sustainable alpha.
Since Benjamin Graham (Graham & Dodd, 1934), who is recognized by many active investors as the father of the fundamental valuation analysis, introduced the concept of value portfolio strategy, many scholars have studied about the feature on value stocks and growth stocks from the firm's accounting data and tested whether the return on value stock portfolio or growth stock portfolio can show constant excess return not explained by CAPM and whether this excess return can be predictable.
To define the value and growth stocks, many scholars have tested empirically the relationship between the individual stock returns and various variables such as earning per share, cash flow per share, book value per share, and dividends per share. After various
researches, typically, value stocks are defined as the stocks with low P/E ratio and high book-to-market ratio. In comparison, stocks with relatively high P/E ratio and low book-book-to-market ratio are classified as growth stocks. Through the historical performance analysis conducted
by many researchers in developed markets, the returns on value portfolio usually outperform
the returns on growth portfolio.
Fama and French (Fama & French, 2007; Fama & French, 2007) explained this anomaly driven by standard economic forces. Typically, the return on a stock is broken into a dividend return and a capital gain return:
1
+
Rt+1=Dt+1 Pt+1Pt
Pt
Where, Rt+1: return at time t+1
Dt+i a dividend yield at time t+1
: a capital gain return at time t+1
Pt
They divide the capital gain return into the growth in book to equity from earning retentions and mean reversion in profitability and expected returns. In other words, the capital gain return is divided by two components: growth in book value and the growth in P/B ratio.
P
t+1/Bt~B
B~
P t+1 B PBt+) (Bt+1)
Pt Pt/
\ Bt(
/ \ PBt
Where, PBt+1: Price to Book ratio at time t+1
return, expected growth of book value, and expected growth of P/B ratio. We already define the value stocks as stocks with high book to market ratio which are low P/B ratio and the growth stocks as stocks with high P/B ratio. Intuitively, growth stocks represent the fast-growing and profitable firm. Price of growth stocks already reflect the firm's good features. However, the fast growth rate and high profit margin cannot be maintained for a long time because those firms encounter intense competition. In contrast, possibly unprofitable firms which are classified as the value stocks strive to reduce costs and increase the margin in order to survive. As a result, the stocks classified as the growth stocks will decrease the sustainable growth potential and reflect their future prices until the stocks are reclassified as the value stocks. On the other hand, stocks classified as the values stocks will track in the exact opposite way. Due to the mean reversion phenomena, the return on value stocks has shown a constantly better performance than that on growth stocks.
In the sense of CAPM formula, value strategies which consist of stocks with low P/B ratio are fundamentally riskier, so value stocks need higher expected return than growth stocks in order to compensate for bearing risk. Therefore, there is an additional expected value not explained by the market risk.
Through various empirical tests conducted in many developed countries, the fact that the value strategies can create benchmark excess returns called alpha is widely accepted (Barber & Lyon, 1997; Capaul, Rowley, & Sharpe, 1993; Fama & French, 1992; Graham & Dodd, 1934; Lakonishok, Shleifer, & Vishny, 1994). However, we need to find the robust empirical evidence to verify that the value strategies also create the alpha in the emerging market due to the different capital market structures. Among the emerging markets, most
Asian countries have rapidly grown during the past decade. In contrast to the well diversified industry in the developed market, a few big companies monopolized the specific industry and grew rapidly through the business diversification policy. For example, in Korea, aggregate market capitalization of only 10 big companies comprises over 50% of the total market capitalization in the Korean Stock Exchange and Market capitalization of Samsung group which is the biggest company group, comprised nearly a quarter of the total market in 2010. More important, those few big companies have grown fast in the past few years and still maintain a higher growth rate than the market average. We can easily observe these phenomena in the emerging nations with the fast economic growth rate. For these phenomena, we can infer that the fast-growing stocks classified with the growth stocks may maintain their competitiveness and constantly outperform the value stocks if the nation's GDP growth rate is still relatively high. However, the important thing is that if either the value stocks or growth stocks constantly outperform the benchmark, we can find the sustainable alpha from value or growth strategies.
In the later chapter, we will conduct empirical tests about the value and growth strategies with the firm's financial statement data in order to verify whether there is an adaptable alpha strategy using value-growth classification method in the emerging countries.
3.1. 2. Fama and French three factors Model
Before considering Fama and French three factors Model, we look over the Arbitrage Pricing Theory. The Arbitrage Pricing Theory (APT) formulated by Ross (Stephen A. Ross,
formula, the theory makes up for the practical weakness of CAPM which asserts that the only single factor called beta is required to measure risk. The APT estimates the expected stock return from the linear relationship between the return and the several risk factors, not only one factor. The APT asserts that the expected excess return on the stock is determined by the relationship with the firm-specific risk factors. The APT postulates a multi-factor model. Therefore, we define the expected return on the stock expressed as
E(ri) = Rf +
s
1Factori + @2Factor2 + ... + pkFactorkIn other equation,
k
E(ri) =
PnFactorn
n=1
Where,
On: the exposure of stock i to factor n Factorn: the factor forecast for factor n
After the APT was published and got attention from academic scholars, many researchers have tested in order to find the other factors which affect the stock return because the APT doesn't specify other risk factors except for the market risk. Among various multi-factor models, Fama and French three-multi-factor model is a well known multi-multi-factor model academically and empirically.
In the previous section, we knew that the average return on stocks is related to firm-specific information such as size, earning/price, cash flow/price, book-to-market equity, past sales growth, etc. Therefore, the CAPM cannot explain the stock returns due to the patterns in
average returns related to those factors which are called anomalies. Fama and French (Fama
& FrencH, 1996) showed the anomalies are mostly captured by three main factors - size, book-to-market equity, and the market, and developed the three-factor model. They assert that the expected return can be explained by the return to three factors which are the market premium which is the same concept of CAPM, the size effect which is the difference between the return on a portfolio of small capitalization stocks and the return on a portfolio of large capitalization stocks, and the value premium which is the difference between the return on a portfolio of high book-to-market equity and the return on a portfolio of low book-to-market equity. Therefore, the expected return on portfolio i is,
E(ri) = Rf + Pi[E(Rm) - Rf] + siE(SMB) + hiE(HML)
Where,
p1:
the exposure of stock i to the market factor[E(Rm) - Rf]: market premium
si: the exposure of stock i to size factor
E(SMB): small minus big (the expected difference of the return on small stocks and the return on big stocks)
hi: the exposure of stock i to value factor
E(HML): high minus low (the expected difference of the return on high book-to-market equity and the return on low book-to-market equity)
We already discussed the reason why value stocks generally record a higher average return than growth stocks in the previous section. Although there is some criticism asserted by Kothari et al (Kothari et al., 1995) that the premium of high book-to-market firms is due to survivor bias by the data source, the empirical evidence of value premium is robust
in many developed countries and in different time periods.
The size premium is more intuitive. The investors require more premiums on the small sized firms than on the large sized firms to compensate for the high risk embedded in the small stocks. Many empirical researches for alpha strategies show that the investors make the constant alpha return when they make the portfolio constructed by value strategy combining with the size factors. As a result, through Fama and French three-factor model, investors believe that they can capture the constant excess return on the individual stocks which cannot be explained by the CAPM and achieve the active portfolio management with the constant alpha return.
However, we need more research to get empirical evidence whether this three-factor model is also well adapted in the emerging capital market. Practically, a few companies have been growing rapidly under the government aid in the first stages of the past growth period of most emerging markets, especially in Asia. Then, those companies have expanded and diversified their businesses. As a result, those companies have classified the large capitalization group and the stock prices of those companies also have increased rapidly. In this point of view, we need to verify whether the size factors in the emerging markets work in the same direction as in the developed market. In a later chapter, we will run the empirical test of multi-factor model brought by Fama and French three-factor model in order to verify whether a portfolio using multi-factor model in the emerging market creates sustainable alpha return in the emerging markets.
3.1. 3. Residual earnings Model/Abnormal earnings growth Model
In the sense of Efficient Market Hypothesis, we acknowledge the emerging market is not supported by the semistrong-form efficiency. Therefore, investors can make the constant alpha using the firm's published accounting information. According to modern finance theory, the firm's current price reflects on the present value of the future expected dividends. The dividend discount valuation model is a very powerful tool to decide whether the stock price is undervalued or overvalued. However, forecasting dividends is very difficult especially for high growth firms which rarely pay dividends. Moreover, management decides how much the company will pay. Because of the discretionary decision made by management, it is another reason why investors have trouble forecasting future dividends. To overcome these shortcomings, many scholars focused on creation of wealth rather than distribution of wealth. Therefore, the concept of free cash flow is introduced. Free cash flow is cash flow from operations that results from investments minus cash used to make investments. Nowadays, most analysts and money managers use the Discount cash flow valuation model to estimate the firm's value. However, the free cash flow is not a value-added concept because a firm reduces free cash flow by increasing investments which add value and increases free cash flow by reducing investments. Additionally, the free cash flow fails to recognize value generated that does not involve cash flows. Therefore, other scholars focused on value drivers with the accounting-based information to improve the DCF valuation model.
From the viewpoint of value creation rather than value distribution, earning (net income) is the basic indicator to evaluate value creation. Therefore, many analysts still try to estimate the firm's net income in order to judge the proper price. Practically, most active
portfolio managers constructed their portfolio with low forward price-to-earnings ratio a decade ago in Korea and this concept is widely used in the early stages of most emerging markets. Basically, the first step of currently widely used DCF valuation model is to estimate the firm's earnings. Therefore, a firm's earnings is the most important and essential variable
in the valuation. However, as the emerging markets are widely opened to international investors and are more and more efficient, it is quite difficult for investors to get a constant alpha return using only earnings forecasting. Therefore, even in the emerging markets, the investors need to consider not just quantitative earning numbers but the quality of earnings. We look at how much earnings the firm creates after paying the cost of equity through the residual income concept.
Ohlson (OHLSON, 1995; Ohlson, 2001) introduced the accounting-based (residual income) valuation model using contemporaneous and future accounting data such as earnings, book values, and dividends. In the sense of accounting theory, the financial statements show the information of the changes in owner's equity. Through the bottom-line items -book value and earnings- in the balance sheet and income statements, we know that the change in book value is equal to current earnings minus dividends which are the net of capital contribution. Ohlson refers to this relation among book value, earnings, and dividends as the clean surplus relation. He developed the residual income model by replacing dividends with earnings and book value in the dividend discount model. Analytically, the dividend discount model is
expressed as
0o
Et[Dt+il
t (1+ r)i
Pt: firm value at the beginning of time t
Et[-]: expectation operator conditioned on time t information Dt: net dividends paid at time t
(1+r): constant discount rate
As we mentioned before, the residual income model assumes the clean surplus relation which is
Bt
= Bt-1+ Xt - Dt
WhereBt: book value of equity at time t Xt: earnings for the period from t-l to t
Ohlson also defined the residual (or abnormal) earnings as earnings minus a charge for the use of capital as measured by beginning of book value multiplied by the cost of capital which is
RIt = Xt - rBt-1
Where
RIt: residual earnings at time t r: cost of capital
Bt-1: book value of equity at the beginning of time t
Since Et[Dt+i] is substituted to Et[Bt-1 + Xt - Bt], we can derive Pt as
Pt Et[Dt+i] Et[Bt+i-1 + Xt+i - Bt+il
Then, it can be
Pt Et[Xt+i - rBt+i] Et[Bt+o]
t +(1+
r)i
(1 + r)*
i=1 Ohlson assumes,Et [Bt+o]-
0 as i
-*
oo
(1 + r)"0 We obtainPt = Bt +
.tRti
1(1 + r)i
Under the clean surplus relation, firm value is decided by current book value and the present value of expected residual earnings. The residual income is somewhat similar to the excess return concept. The residual income refers to the excess return after paying the required return on equity. In other words, the residual income means the value added beyond the market expectation. As a result, the price of firms with high expected residual income not just high net income should reflect the high quality of earnings intuitively if the market is the semistrong-form efficient about the firm's reported financial statements. Otherwise, investors can make the active portfolio using the mispricing based on the residual income valuation model. Mostly, the reported earnings are rapidly reflected on the price even in the emerging markets. However, there is not enough evidence that the firm values which are similar reported earnings are differentiated by earning quality in the emerging markets due to the high portion of individual investors of total market participants. In a later chapter, we verify
whether the evaluation of earnings quality gives investors sustainable alpha returns through empirical tests in the emerging markets.
3. 2. Technical trading Strategy
Technical trading strategy is the one of two main streams of the portfolio management field. The basic concept of technical trading strategy is that the future return on stocks is closely related to the past return on stocks. According to Efficient Market Hypothesis, even in the emerging markets, many researchers insist that the emerging market is weak-form efficient which means the current stock price reflects all information about the past returns. However, this controversial issue is not over yet because many other scholars show the robust excess return by the technical analysis through various empirical tests. Among numerous technical analysis methods, we will study two well-known and outstanding technical trading strategies which is based on other technical analysis: momentum trading strategy introduced by Jegadeesh, Titman (N. Jegadeesh, Titman, & National Bureau of Economic Research., 1999; N. Jegadeesh & Titman, 1993), DeBont, and Thaler (Bondt & Thaler, 1985; DE BONDT & THALER, 1987) and moving average trading strategy introduced by Brock, Lakonishok, and LeBaron (Brock, Lakonishok, & LeBaron, 1992).
Of course, there are other breakthrough technical strategies such as Innovation
Regime-Switching Model. However, in this paper, we focus on the traditional technical strategies in order to verify whether the investors still have a chance to make the sustainable excess return by information from past returns especially in the emerging markets rather than optimize or maximize the portfolio return using sophisticated technical analysis.
3. 2.1. Momentum Trading Strategy
In capital markets history, numerous studies examine whether the stock returns are related to past performance because if so, investors could achieve abnormal excess returns by the trading strategies. Through various academic studies, stock returns are followed by random work theory in a short moment. However, in a longer time period, research shows the stock returns are predictable based on past returns. The strategies using past performance are called momentum trading strategy.
Basically, the momentum trading strategy generating abnormal excess returns depends on the time horizon, volume, level of market development, etc. Empirically many researchers have tested the predictability of future returns from past returns under the different time horizons and in various markets. Among those empirical studies, the studies by Jegadeesh and Titman (N. Jegadeesh & Titman, 1993) and DeBont and Thaler (Bondt & Thaler, 1985; DE BONDT & THALER, 1987) are very interested in the opposite results by different time horizon. DeBont and Thaler insist on mean reversion due to the overreaction to information that the long-term past losers outperform long-term past winners over the subsequent three to five years. By contrast, Jegadeesh and Titman assert momentum consistency due to delayed price reactions to firm-specific information. Therefore, they insist that firms with high returns over the past three to twelve months continue to outperform firms with low past returns over the same period.
In this paper, we are not going to find out whose research is more applicable in the market. The most important fact of their studies is that the momentum strategies that select
stocks based on their past returns can generate abnormal excess returns regardless of whether stock prices overreact or underreact to information. Additionally, we need to consider whether the trading strategies using the past returns are applicable for the emerging market too. Studies conducted by Jegadeesh and Titman (1993) and DeBont and Thaler (1985, 1987) were tested in the US market. Rouwenhorst (Rouwenhorst, 1998) broadened the empirical test of the momentum strategy internationally. He tested 12 European nations using the same method with Jegadeesh and Titman and had results that were similar to theirs
Actually, as the market goes in a more efficient way, it is more and more difficult for investors to find suitable momentum strategies using the past returns. Thus, the momentum trading strategy might not be a good strategy for active portfolio management in the current developed market. However, we need to verify whether the momentum strategies are still useful for generating alpha in the emerging markets. In a later chapter, we will run an empirical test whether the momentum trading strategy can drive constant alpha returns through the similar method conducted by Jegadeesh and Titman in the emerging market.
3. 2.2. Moving average technical trading rule
Another well-known technical analysis is the moving average technical trading rule introduced by Brock, Lakonishok, and LeBaron (Brock et al., 1992). As we mentioned in the earlier section, technical analysts attempt to forecast prices by the study of past prices in that the market's behavior patterns do not change much over time and the market has the long-term trends. Although future events are very different from past events, investors tend to respond to those events in a similar manner as in past events.