Adaptive Evolution within Gut Microbiomes of Healthy People
The MIT Faculty has made this article openly available.
Please share
how this access benefits you. Your story matters.
Citation
Zhao, Shijie, et al. "Adaptive Evolution within Gut Microbiomes of
Healthy People." Cell Host & Micorbe, 25, 5 (may 2019) 656-667. ©
2019 Elsevier Inc.
As Published
http://dx.doi.org/10.1016/j.chom.2019.03.007
Publisher
Elsevier BV
Version
Author's final manuscript
Citable link
https://hdl.handle.net/1721.1/125160
Terms of Use
Creative Commons Attribution-NonCommercial-NoDerivs License
Adaptive evolution within the gut microbiomes of healthy people
Shijie Zhao1,2,3,*, Tami D. Lieberman3,4,5,6,*,+, Mathilde Poyet1,3,4, Kathryn M. Kauffman5,Sean M. Gibbons1,3,4,7,8, Mathieu Groussin1,3,4, Ramnik J. Xavier3,4,9, Eric J. Alm1,3,4,5,10,+ 1. Department of Biological Engineering, Massachusetts Institute of Technology, Cambridge,
Massachusetts, USA
2. Department of Biology, Massachusetts Institute of Technology, Cambridge, Massachusetts,
USA
3. Center for Microbiome Informatics and Therapeutics, Massachusetts Institute of Technology,
Cambridge, Massachusetts, USA
4. Broad Institute of MIT and Harvard, Cambridge, Massachusetts, USA
5. Department of Civil and Environmental Engineering, Massachusetts Institute of Technology,
Cambridge, Massachusetts 02139, USA
6. Institute for Medical Engineering and Sciences, Massachusetts Institute of Technology,
Cambridge, Massachusetts 02139, USA
7. Institute for Systems Biology, Seattle, Washington 98109, USA
8. eScience Institute, University of Washington, Seattle, Washington 98195, USA
9. Gastrointestinal Unit and Center for Computational and Integrative Biology, Massachusetts
General Hospital, Boston, Massachusetts, USA
10. Lead Contact
SUMMARY
Natural selection shapes bacterial evolution in all environments. However, the extent to which commensal bacteria diversify and adapt within the human gut remains unclear. Here, we combine culture-based population genomics and metagenomics to investigate the within-microbiome evolution of Bacteroides fragilis. We find that intra-individual B. fragilis populations contain substantial de novo nucleotide and mobile element diversity, preserving years of within-person history. This history reveals multiple signatures of within-person adaptation, including parallel evolution in sixteen genes. Many of these genes are implicated in cell-envelope biosynthesis and polysaccharide utilization. Tracking evolutionary trajectories using near-daily metagenomic
+ Correspondence should be addressed to: E.J.A. (ejalm@mit.edu) or T.D.L. (tami@mit.edu). *These authors contributed equally to this work.
AUTHOR CONTRIBUTIONS
S.Z., T.D.L., and E.J.A. designed the study; S.Z. performed B. fragilis experiments; M.P. and M.G. performed experiments for other Bacteroides; K.M.K performed the phage experiments; S.M.G, R.J.X., and E.J.A. coordinated acquisition of metagenomic data. S.Z. and T.D.L. analyzed the data and wrote the manuscript with input from all authors.
HHS Public Access
Author manuscript
Cell Host Microbe
. Author manuscript; available in PMC 2020 May 08.Published in final edited form as:
Cell Host Microbe. 2019 May 08; 25(5): 656–667.e8. doi:10.1016/j.chom.2019.03.007.
A
uthor Man
uscr
ipt
A
uthor Man
uscr
ipt
A
uthor Man
uscr
ipt
A
uthor Man
uscr
ipt
sampling, we find evidence for years-long coexistence in one subject despite adaptive dynamics. We investigated one adaptive mutation, common in our cohort, in public metagenomes and found that it emerges frequently in Western, but not Chinese microbiomes. Collectively, these results demonstrate that B. fragilis adapts within individual microbiomes, pointing to factors that promote long-term gut colonization.
INTRODUCTION
The human gut microbiome harbors a large potential for within-person bacterial evolution and adaptation. Commensals can stably colonize a person for decades (Faith et al., 2013), and during this time billions of bacterial mutations are generated daily (Table 1). Should adaptive mutations arise and be detectable within individual microbiomes, they are likely to indicate genes and pathways whose fine tuning is critical for long-term bacterial persistence in the human body (Feliziani et al., 2014; Lieberman et al., 2011). In bacteria, adaptive evolution can be detected by the independent recurrence of similar mutations in genes under selection (parallel evolution or convergent evolution) or by an increase in mutational frequency that is inconsistent with neutral drift (Lieberman et al., 2011; Wichman et al., 2012; Woods et al., 2006). The selective forces driving within-person adaptation might be person-specific, exposure-specific (e.g. diet), or widespread, and their identification could guide microbiome-targeted therapies—including the selection or engineering of therapeutic bacteria for long-term colonization. Additionally, within-person adaptation, if it occurs, may contribute to the stability of microbiome communities and their resilience to invasion (Martínez et al., 2018).
However, relatively little is known about how commensals evolve within humans. To date, identification of contemporary adaptive point mutations has only been described during infections and in laboratory experiments. In these cases, the bacteria under study were exposed to environmental conditions clearly novel to them: the presence of antibiotics (Mwangi et al., 2007; Snitkin et al., 2013), a new host species (Didelot et al., 2016), or artificial laboratory environments (Barrick et al., 2009). However, human commensal bacteria have been colonizing mammalian digestive tracts for potentially hundreds of thousands of years (Moeller et al., 2016; Groussin et al., 2017). After long periods of evolution in a relatively unchanging environment, only neutral or very weakly beneficial mutations are expected to be available (Wiser et al., 2013; Didelot et al., 2016). Consistent with this expectation, investigations into healthy carriage of commensals have not revealed signals of within-person adaptive evolution (Golubchik et al., 2013; Ghalayini et al., 2018) and several studies have found signals of long-term purifying selection in the gut
microbiome (Schloissnig et al., 2012; He et al., 2010). Yet, gut microbiomes are
heterogeneous and individualized ecosystems that may vary over time (Lloyd-Price et al., 2017). Encounters with other microorganisms, host immune systems, and diets may impose novel selective pressures on bacteria, and it is possible that these variable forces provide the potential for within-person genomic adaptation of certain commensal species (Nemergut et al., 2013). Empirical data is needed to understand whether the environments within and between human gut microbiomes are variable enough to enable adaptation within individual
A
uthor Man
uscr
ipt
A
uthor Man
uscr
ipt
A
uthor Man
uscr
ipt
A
uthor Man
uscr
ipt
To date, technical challenges have limited characterization of within-person evolution in the gut microbiome. One major challenge of metagenomics is discriminating de novo mutations (those that arise within an individual) from variants in homologous regions shared by co-colonizing bacteria (e.g. multiple-strain colonization or the presence of closely related species with shared mobile element) (Schloissnig et al., 2012). Moreover, it is difficult to resolve the phylogenetic relationships between de novo SNPs using metagenomic-based approaches (Garud et al., 2017). Culture-based whole-genome sequencing circumvents these limitations by enabling precise measurements of mutational distances between coexisting genotypes and phylogenetic inference. However, culture-based approaches have so far been limited to a small number of closely-related isolates from the gut microbiome (Faith et al., 2013).
Here, we systematically characterize the within-host evolution and adaptation of Bacteroides fragilis, a prevalent commensal in the large intestine of healthy people. We use culture-based population genomics to identify de novo mutations and complement these analyses with comparisons to metagenomic data. We find extensive within-person diversification and multiple signals of adaptation, including within-person parallel evolution in 16 genes. Our findings provide a genome-wide understanding of B. fragilis within-person evolution, highlight the potential of commensals to adapt to individual microbiomes, and provide a roadmap for discovering genes important to commensal gut colonization and persistence.
RESULTS
Within-person B. fragilis diversity is consistent with a single colonization event
We set out to survey intra-species diversity and evolution of B. fragilis within 12 healthy subjects, all donors to the OpenBiome stool bank (ages 22–37; Table S1). A total of 30 fecal samples from these subjects were studied. These fecal samples included longitudinal samples from 7 subjects spanning up to 2 years and single samples from 5 subjects (Table S2). Subjects did not take antibiotics for at least 3 months prior to initial sampling or during longitudinal sampling. We sequenced the genomes of 602 B. fragilis isolates cultured from 30 fecal samples. Each isolate was derived from an independent single cell in the original microbiome community.
Previous investigations have suggested that each person’s B. fragilis population is dominated by a single strain (Lee et al., 2013; Verster et al., 2017). To confirm this in our donor
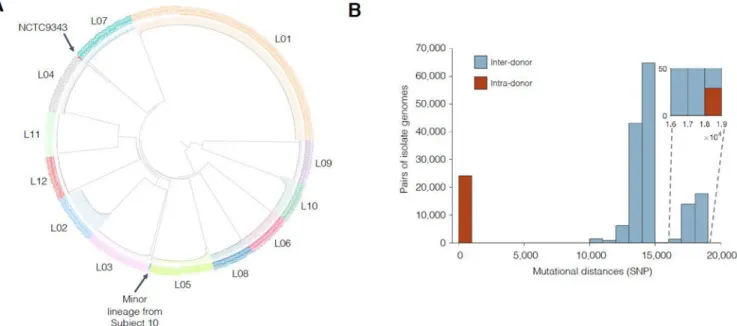
population, we compared all 602 isolates via alignment of short reads to a public B. fragilis reference (Methods). We identified single nucleotide polymorphisms (SNPs) between these 602 isolates and built a phylogeny for these isolates. Isolate genomes from different subjects differed by more than 10,000 SNPs, while genomes from the same subject differed by fewer than 100 SNPs (with one isolate exception; Figures 1A–1B). This pattern confirms that each subject was colonized by a unique lineage.
B. fragilis populations diversify for years within individuals, with occasional sweeps
To ascertain if the sublineage diversity present in each person could have emerged within the subject’s lifetime, we estimated the coalescence time of each person’s B. fragilis population.
A
uthor Man
uscr
ipt
A
uthor Man
uscr
ipt
A
uthor Man
uscr
ipt
A
uthor Man
uscr
ipt
To include mutations in accessory genomic regions, we built a draft genome for each lineage using reads from all isolates. We then identified polymorphisms and constructed person-specific phylogenies using these draft genomes (Methods, Figures 2A and S1–S3). This sensitive approach detected between 8 and 182 polymorphic positions per subject (Figure 2B), and it enabled us to estimate the rate at which B. fragilis accumulates SNPs in the human gut (Figures 2C–2D; Methods). Our molecular clock estimate of ~0.9 SNPs/genome/ year is within the range of what has been reported for bacterial species during infections of humans (Didelot et al., 2012). Combining this rate and each population’s phylogeny, we inferred that 11 of 12 lineages had B. fragilis populations that emerged from an ancestral cell between ~1.1–10 years before the initial sampling (time to most recent common ancestor, tMRCA; Figure 2E). These values are consistent with an expansion from a single cell that existed years prior to the initial sampling. Given the low acquisition rate of Bacteroides (Faith et al., 2013), it is likely that the sublineage diversity emerged within each subject. We conclude that a typical B. fragilis population diversifies for years within the human gut. One lineage, L08, was an outlier with an estimated tMRCA of 43, and we suspected that this high estimate of tMRCA was due to hypermutation. Hypermutation is an excess of
mutations due to a defect in DNA repair, is commonly observed in laboratory experiments and during pathogenic infections, and is associated with adaptation (Giraud, 2001; Jolivet-Gougeon et al., 2011; Marvig et al., 2013; Lieberman et al., 2014; Chu et al., 2017). To test this hypothesis, we examined the type of mutations accumulated and the intrapersonal phylogeny. We found that the excess of mutations in L08 relative to other subjects was due solely to an increase in GC to TA transversions within one sublineage, supporting
hypermutation (P<0.001, Chi-squared test, Figure 2F) (Jolivet-Gougeon et al., 2011). The topology of the rooted phylogeny and the tMRCA of non-hypermutator sublineages (9.9 SNPs/genome) suggest that the hypermutation phenotype emerged within this subject (Figure 2F).
We noticed that estimates of divergence time were substantially smaller than each subject’s age. These low values are consistent with colonization later in life, as well as early life colonization followed by loss of diversity through a neutral or adaptive sweep of a single sublineage. Consistent with the later scenario, we lost the ability to detect some sublineages in 3 of the 7 lineages using longitudinal samples over time (Figures S2C, S2D and S2F). Thus, the low values of tMRCA may have emerged because sweeps occasionally purge within-person B. fragilis population genetic diversity. We examine the role of adaptation, which might have driven these sweeps, in a later section.
Detection of mobile element transfer within individual microbiomes
We next assessed the relative contribution of horizontal gene transfer to within-person evolution of B. fragilis. We identified within-lineage mobile element differences (MEDs), which we define as DNA sequences with multi-modal coverage across isolates (Methods). We found MEDs in 11 of the 12 lineages (Figure 2B), including putative plasmids, integrative conjugative elements (ICEs), and prophages (Table S3). Using parsimony, we inferred 10 MEDs gained, 12 lost, and 17 ambiguous loci in ~50 cumulative years of
A
uthor Man
uscr
ipt
A
uthor Man
uscr
ipt
A
uthor Man
uscr
ipt
A
uthor Man
uscr
ipt
of ~0.05 gain/genome/year and ~0.04 loss/genome/year and genomic change estimates of ~1.3 kbp gain/genome/year and ~1.9 kbp loss/genome/year. We did not find evidence of homologous recombination in these 12 lineages.
To identify MEDs transferred from the microbiome, we compared isolate genomes and metagenomes from the same subjects. We reasoned that a transferred region should have increased coverage in the metagenome compared to the rest of the B. fragilis genome, owing to its presence in other species (Table S4, Methods). We leveraged stool metagenomes available from 8 subjects, scanning for genomic regions with high relative coverage and high identity (>3X and >99.98%, respectively; Methods). We found evidence of one inter-species MED transfer within Subject 04 (38X relative coverage in the metagenomes; Methods; Figures 3A–3B). This MED, a putative prophage, was absent from all isolates at Day 0 yet present in 68% of isolates at Day 329. This combination of longitudinal genomic and metagenomic evidence suggests that this prophage was acquired by B. fragilis during the sampling period.
This same approach enabled us to identify three additional putative inter-species transfer events (Table S4; Figure 3C). We detected no difference in coverage between isolates for these regions (no MED), but an excess of coverage in the metagenomes. We confirmed one candidate from Subject 01, an integrative conjugative element (ICE) containing a type VI secretion system (Coyne et al., 2016) (T6SS), by culturing and sequencing 94 isolates of other Bacteroides species from this subject. This ICE was present in 3 species (82 isolates) and harbored only 4 SNPs across these species, suggesting recent transfer (Figures 3D and S1B–S1C; Methods). T6SSs mediate inter-bacterial competition and have been shown to be shared by members of the same microbiome (Coyne et al., 2014; Verster et al., 2017). The prevalence of this ICE in this subject suggests it confers a strong selective advantage to its recipient species. In general, however, there are limited statistical tools for distinguishing adaptation from neutral evolution for mobile element exchanges.
Parallel evolution reveals genes involved in within-person adaptation
To systematically assess if adaptive mutations were a significant driver of within-person B. fragilis evolution, we searched for genes that underwent parallel evolution. Parallel evolution is the independent emergence of similar mutations on closely related genetic backgrounds, is a hallmark of positive selection, and is often used to identify putative targets of natural selection (Lieberman et al., 2011; Wichman et al., 2012; Woods et al., 2006). We searched for genes that accumulated recurrent mutations within at least one person, leveraging the phylogeny to only include those events in which distinct mutations occurred in different sublineages (Figure 4A). We identified 16 such genes from the 12 lineages (Figures 4B and 4C). This represents a significant deviation from a neutral model in which mutations occur randomly on the genome (P<0.001, Figures 4C; Methods). To confirm that adaptation, rather than mutational bias, was driving this clustering of mutations, we examined how many of the mutations encoded for an amino-acid change and compared this distribution to a neutral model (dN/dS, a canonical measure of selection). We found a significant enrichment for nonsynonymous mutations for these 16 genes, indicating adaptation (dN/dS = 6.03, CI = (1.57, 51.3); Methods). We did not discover additional genes under adaptive evolution when
A
uthor Man
uscr
ipt
A
uthor Man
uscr
ipt
A
uthor Man
uscr
ipt
A
uthor Man
uscr
ipt
including a search for parallel evolution across lineages (Figures S4A–S4F). We therefore conclude that some or all of these 16 genes underwent adaptive evolution within these subjects.
We found evidence of both subject-specific selection and selective forces shared across multiple subjects. Supporting person-specific selection, three Sus genes (BF1802, BF1803, and BF3581) were each mutated multiple times within one subject (P < 0.003 for each, Fisher’s exact test) and no times in other subjects. In contrast, five genes under selection were mutated in multiple subjects, with two genes even acquiring mutations at the same amino-acid residue in different subjects (BF1708 and BF2755; Figure 4A). We discuss one of these mutations in detail in a following section.
Genes under parallel evolution are involved in polysaccharide utilization and cell envelope biosynthesis
The genes under parallel adaptive evolution reveal insights into the challenges to B. fragilis survival in vivo. The 16 genes include 5 involved in cell envelope biosynthesis, a
dehydratase implicated in amino-acid metabolism, and 4 with unclear biological roles (Figure 4A). The remaining 6 genes all encode for homologs of SusC or SusD, a large group of outer-membrane polysaccharide importers (Table S5). A typical B. fragilis lineage has 75 distinct SusC/SusD pairs (out of ~4300 genes) and their main substrates are thought to be complex polysaccharides (Cerdeno-Tarraga, 2005; Martens et al., 2009). SusC proteins form homodimeric β-barrels capped with SusD lids (Glenwright et al., 2017), and the observed mutations were enriched at the interface between the barrel and lid (Figure 4D; P<0.001, Methods).
Notably, one of these SusC homologs (BF3581) has been shown to be critical for IgA-mediated colonization in mice. This locus has been designated as commensal colonization factor (ccf) (Lee et al., 2013) and was the most significant locus discovered in a genome-wide screen for colonization determinants. The essentiality of the ccf locus is thought to be related to its regulation of capsular polysaccharide synthesis genes (Donaldson et al., 2018). Therefore, while mutations altering Sus proteins might reflect pressures to utilize host or diet-derived polysaccharides (Martens et al., 2009), selection on these genes might also reflect pressure to modify the B. fragilis cell envelope directly or indirectly. Additionally, the presence of Sus proteins in the outer membrane and their co-occurrence on this list with genes involved in cell envelope synthesis (Figure 4A) hints that selection on these genes might be driven by the pressure to evade the immune system (Merino and Tomás 2015) or phage predation (Stummeyer et al., 2006).
Dense time-series reveals evolutionary dynamics and stable co-existence of sublineages To better understand within-person evolutionary dynamics, we made use of the available densely sampled metagenomic time-series from Subject 01 and Subject 03. We closely examined the evolutionary dynamics for each lineage by tracking abundant SNPs, whose evolutionary relationships were previously identified from comparing isolate genomes. We inferred the population dynamics of sublineages, defined as clades with linked SNPs
A
uthor Man
uscr
ipt
A
uthor Man
uscr
ipt
A
uthor Man
uscr
ipt
A
uthor Man
uscr
ipt
(Methods). These densely sampled time-series allowed us to track dynamics of de novo SNPs and to assess the strength of selection upon these mutations.
In both L01 and L03, we found SNPs that steadily increased in frequency, suggesting a fitness advantage of the lineages carrying them relative to their ancestors (Figures 5 and S5). Given the large population sizes of B. fragilis in these subjects (>1011; Figure S5), these relatively rapid rises in frequency are incompatible with neutral drift (Moran 1957). In L01, two linked mutations emerged around day 150 and swept a major sublinage (SL1) around day 400, increasing in frequency at a rate of 1.9% daily (Figures 5A–5B). One of these mutations was an amino-acid change in BF1802, a gene previously identified as under parallel evolution within this subject (Figures 5C–5D). The other mutation was 260 nucleotides upstream of a SusC gene not identified as under parallel evolution. In L03, the frequency of an amino-acid changing mutation in a glycosyltransferase (BF1196) rose from 0.5% at day 0 to 21% at day 144, corresponding to an average daily increase of 2.6% (Figures 5E–5F). While BF1196 did not show a signal for within-person parallel evolution, it was also mutated once in L10, suggesting this is an additional gene that may be under selection. Assuming that B. fragilis divides between 1–10 times per day, we estimate that these mutations provide a fitness gain (selection coefficients) of 0.2–2% for the two sweeping mutations from L01 combined, and 0.3–3% for the L03 mutation (Methods). These estimates are further evidence of adaptive evolution occurring within individuals in the absence of antibiotics.
Notably, in L01, the ratio between two major sublineages remained stable throughout the sampling period, despite the mutational sweep within SL1 (Figure 5C). We estimate that these major sublineages diverged ~8 years prior to sampling. This persistent coexistence suggests that the sweeping genotype, while 0.2–2% more fit than other genotypes from SL1, are not more fit than bacteria from SL2. This might result from frequency-dependent selection, ecological cross-feeding, or the occupation of distinct, perhaps spatially segregated, niches (Plucain et al., 2014; Chung et al., 2017; Good et al., 2017; Rocabert et al., 2017). The fact that 11 of 12 intragenic mutations separating these sublineages are amino-acid changing furthers the notion that they are functionally distinct.
To test if the two sublineages stably coexist in vitro, we competed combinations of isolates from different sublineages in vitro (Methods). Tracking their ratios using targeted amplicon sequencing, we found that both selected isolates from SL2 quickly outcompeted both selected isolates from SL1 (Figure 5A; Figures S5G–S5J). The growth profiles suggested active killing of SL1 in the presence of SL2 (Figure S5K). We noticed that all isolates from SL2 carried a prophage-like genomic element (MED01–2+), while only 14 of the 111 SL1 isolates were MED01–2+ (Figures 5E and S1A), and the above tested SL1 isolates both lacked this element (MED01–2-). To test the importance of MED01–2, we performed additional competition experiments including SL1 isolates that were MED01–2+ (Methods). We observed that, regardless of the sublineage-background, MED01–2+ isolates quickly outcompeted MED01–2- isolates, (Figures 5F and 5G). In contrast, we observed stable coexistence of SL1 and SL2 when both competing isolates were MED01–2+ (Figure 5H). These results supported a pivotal role of MED01–2. To confirm that MED01–2 is a prophage and is responsible for SL2’s in vitro competitive advantage, we performed phage
A
uthor Man
uscr
ipt
A
uthor Man
uscr
ipt
A
uthor Man
uscr
ipt
A
uthor Man
uscr
ipt
plaque assays using 1000 donor-recipient combinations from L01 (40 donor isolates and 25 recipient isolates, Methods). Filtrates of MED01–2+ isolates from either SL1 or SL2 formed plaques on lawns of MED01–2- bacteria, but almost no plaques were found for other combinations (Figure S5L and Table S6). These results are consistent with an advantage of MED01–2+ isolates mediated by prophage-dependent killing.
These in vitro results are at odds with the observed within-person population dynamics. The years-long coexistence of SL1 and SL2—including SL1 isolates lacking MED01–2— suggests a balancing advantage for SL1 isolates that is not captured by our experiments. Alternatively, MED01–2 may provide a much weaker fitness advantage within Subject 01. These experimental results reflect the challenge of reconstructing within-person dynamics in vitro and highlight the power of dense and deeply analyzed timeseries for observing within-person evolutionary and ecological dynamics.
Parallel evolution in BF2755 is enriched in Western populations relative to Chinese populations
Lastly, we further investigated an amino acid change that had a high incidence across subjects. The mutant allele emerged four independent times across three subjects and was found in all isolates from L12 (Q100P mutation in BF2755, glutamine to proline). The function of BF2755 is unknown, but it is predicted to be periplasmic (Yu et al., 2014) and has structural similarity to a beta-lactamase inhibitor (Das et al., 2010). The high incidence of this mutation provided the opportunity to investigate its prevalence across human populations. We leveraged four available deeply-sequenced metagenome datasets: two from China (Qin et al., 2012; Qin et al., 2014), one from the USA (Lloyd-Price et al., 2017), and one from the UK (Xie et al., 2016) (Methods).
Unexpectedly, the mutant allele was at high prevalence in Western samples but nearly absent in the Chinese samples. Among Western metagenomes with evidence of B. fragilis, 15% had reads supporting the Q100P mutation, compared with only 1.5% in Chinese metagenomes (n=162 and n=136, respectively). This between-population difference was significant (Figure 6A, p<0.0001, Fisher’s exact test) and robust to subject health status metadata (Figure S6A). To rule out the possibility that this difference was due to limited dispersal of a strain carrying this allele within Western populations, we reconstructed the evolutionary relationships among the B. fragilis strains within each metagenome (Figure 6B). We found that the occurrences of the Q100P mutations were on distinct and independent B. fragilis backgrounds (Figure 6B). In addition, 10 out of the 26 Western individuals with the derived allele showed evidence of coexistence of this mutation with the ancestral allele. This polymorphism, given that only a single lineage of B. fragilis colonizes each person (Lee et al., 2013; Verster et al., 2017), supports independent emergence of this mutation within each of these individuals. Further, a genome-wide search showed that this mutation is the most different locus between Western and Chinese populations (Figure S6B). In total, this data suggests a selective pressure to change this residue that is enriched in Western populations relative to Chinese populations.
A
uthor Man
uscr
ipt
A
uthor Man
uscr
ipt
A
uthor Man
uscr
ipt
A
uthor Man
uscr
ipt
DISCUSSION
B. fragilis populations are dominated by single lineages (Figure 1A) which diversify within each individual to form coexisting sublineages (Figure 2A). Here, we report multiple lines of evidence that these sublineages acquire novel mutations with significant beneficial effects, in the absence of antibiotic treatment and despite perhaps hundreds of thousands of years in mammalian digestive tract. This evidence includes: (1) independent, parallel acquisition of point mutations in the same gene among co-existing sublineages within individuals, concentrated in a few key pathways (Figure 4A); (2) an enrichment of amino-acid changing mutations relative to amino-acid preserving mutations, compared to a neutral model, in the target genes of parallel evolution (Figure 4C); and (3) rapid and continuous increases in the frequency of a few mutations (~2% daily increase, Figures 5B–5C and S5E-S5F).
Adaptation of B. fragilis appears to be common feature of within-person B. fragilis evolution; 9 of 12 subjects had at least one mutation in the 16 genes we identified as under parallel evolution. The tempo of evolution observed here enables the straightforward identification of genes contributing to within-host adaptation, and therefore to long-term colonization in the microbiome, from either longitudinal sampling or investigation of many coexisting isolates.
This study was limited to a single species, and we hope that it will inspire similar studies for a variety of commensal organisms. Additional studies are needed to identify whether rapid adaptation is specific to B. fragilis or a common feature of gut commensals. Evidence that our results may be generalizable is provided by a recent study using metagenomics to track microbiome evolution across species (Garud et al., 2017). This study detected that, averaged across species, single nucleotide variants at low frequency in the human population had a value of dN/dS consistent with either neutrality or adaptation—hinting at a possible microbiome-wide signature of adaptive evolution. In contrast, an investigation into E. coli within-microbiome evolution in one person uncovered only signatures of neutral diversity (Ghalayini et al., 2018). While there are many possible explanations for the discrepancy between this finding for E. coli and our results, we speculate that genetic drift plays a larger role for E. coli due to its low population size within microbiomes (Lloyd-Price et al., 2017). Future studies may identify taxonomic groups, bacterial life history strategies, human disease states, or other features that determine within-person evolutionary dynamics of commensals.
Selective forces that drive within-person adaptation
We report 16 genes in which adaptive mutations are concentrated, which warrant further study and whose identities provide hints about the nature of within-person selection. Six of the genes identified as under selection are members of the SusC/SusD family of nutrient import proteins. One pair of SusC/SusD genes (BF1802 and BF1803) have orthologs in Bacteroides thetaiotaomicron shown to be upregulated by milk oligosaccharides (Marcobal et al., 2011) (Table S5). It is possible that some of the selective pressures driving mutations in these genes are in response to host diet. On the other hand, many of these genes are implicated in outer-membrane biosynthesis or encode for nutrient importers which sit in the outer membrane. In particular, a cell-envelope biosynthesis gene (BF2848) essential for the
A
uthor Man
uscr
ipt
A
uthor Man
uscr
ipt
A
uthor Man
uscr
ipt
A
uthor Man
uscr
ipt
biosynthesis of 7 out of the 8 capsule polysaccharides was mutated in 3 lineages (Coyne et al., 2008) (Figure 4A). We speculate that these genes are under pressure to evade phage predation or alter interaction with the immune system (Merino and Tomás 2015; Stummeyer et al., 2006).
These same major pathways (capsule synthesis and SusC/SusD loci) are also controlled by invertible promoters in B. fragilis. At these loci, inducible integrases vary which gene in of a set of homologs is driven by a particular promoter. Using this mechanism and additional regulation, each B. fragilis isolate expresses only 1 of 8 capsule polysaccharides at a time (Kuwahara et al., 2004; Cerdeno-Tarraga, 2005). It is interesting that the variation provided by invertible promoters does not preclude de novo mutations in these genes from
contributing to within-person adaptation. More importantly, this overlap suggests that further elucidation of the pressures driving variation at these loci in vivo will illuminate the
pressures driving within-person evolution.
Evolutionary dynamics within and across human subjects
The same genes identified here as under positive selection within individual people show signatures of purifying selection across lineages separated by thousands of years (Figure 6C; Methods). The discrepancy in signals between timescales raises the possibility that adaptive mutations in B. fragilis may incur collateral fitness costs in the context of other selective forces (e.g., following transmission to a new human host or invasion by a new species). We propose four scenarios that might reconcile the discrepancy between timescales (Figure 6D). The non-constant selective forces could be (1) specific to some people or lineages, (2) recently introduced into the human population (emerging), (3) present only at particular times during colonization, or (4) coexisting within individual people. These models are not mutually exclusive and are agnostic to whether these forces are ecological or abiotic in nature. Our study, which was limited to 12 subjects, points to the existence of multiple of these non-constant selective forces.
A point of particular interest is whether the selective forces driving adaptation are person specific. In support of person specific selection, 11 of the 16 identified genes had mutations in only one subject. In particular, all six Sus genes under selection were mutated only in a single subject each. Furthermore, we did not find additional genes under adaptive evolution by grouping mutations from all subjects together (Figures S4A–S4F). We therefore speculate that person-specific or lineage-specific selection play important roles in shaping within-person evolution of the microbiome.
We also find evidence supporting other modes of contemporary selection. Five genes present signs of common selective forces (Figure 4A). Our finding of an amino acid frequently mutated in Western, but not Chinese, microbiomes, hints to a selective pressure that is enriched in Western populations (Figures 6A–6B). Studies tracking larger numbers of human subjects, as well as those tracking the same lineage in independent hosts (e.g. following fecal transplant), are needed to unravel the nature and specificity of pressures driving adaptation in these genes.
A
uthor Man
uscr
ipt
A
uthor Man
uscr
ipt
A
uthor Man
uscr
ipt
A
uthor Man
uscr
ipt
Implications of rapid within-microbiome evolution
Should rapid within-person adaptation be a common feature of gut commensals, as it is for many opportunistic pathogens of the cystic fibrosis lung (Smith et al., 2006; Lieberman et al., 2014; Chung et al., 2017), it may have far-reaching implications for the microbiome field. Within-person evolution, in addition to ecological forces, may need to be considered as a possible driver of community dynamics, such as increases or decreases in species
abundances over time. In particular, the eco-evolutionary force of monopolization—in which adaptation to a unique local environment enables early colonizers to prevent subsequent invasion by new potential colonizers (De Meester et al., 2016)—may need more attention in the microbiome field. Monopolization may be responsible for the observed stability of individual lineages in the microbiome and the microbiome’s ability to provide colonization resistance (Faith et al., 2013; Martínez et al., 2018). Further, pressures specific to individuals or populations may necessitate the need for careful selection or engineering of probiotic strains to maximize the potential for long-term colonization. Future work is needed to understand the importance of within-person evolution to the design of microbial-based therapeutics, as well as its interplay with ecological forces. Our work demonstrates the power of culture-based evolutionary approaches for providing insights into the dynamics of human microbiomes and for discovering genes and pathways critical to bacterial survival within the microbiome.
STAR METHODS
KEY RESOURCES TABLE
Shown in a separate file.
CONTACT FOR REAGENT AND RESOURCE SHARING
Further information and requests for resources should be directed to and will be fulfilled by the Lead Contact, Eric J. Alm (ejalm@mit.edu).
EXPERIMENTAL MODEL AND SUBJECT DETAILS
Stool samples were obtained from OpenBiome, a non-profit stool bank, under a protocol approved by the institutional review boards at MIT and the Broad Institute (# 1510271631). All 12 subjects were healthy people screened by OpenBiome to minimize the potential for carrying pathogens and had ages between 22 and 37 years and body-mass indexes between 19.5 and 26.2 at initial sampling. Subjects were de-identified before receipt of samples. Table S1 contains detailed information about each subject.
METHOD DETAILS
Study cohort and sample collection—OpenBiome received and processed fresh stool donations within 6 hours of generation. Most samples were homogenized in a buffer containing 12.5% glycerol and 0.9% sodium chloride by mass (relative ratio of buffer to stool was either 10:1 or 2.5:1 volume/mass). Some samples were homogenized in proprietary buffers (1:1 volume/mass). Homogenized samples were passed through a 330-micron filter and stored at −80°C. Subjects 01–07 had multiple samples from which B.
A
uthor Man
uscr
ipt
A
uthor Man
uscr
ipt
A
uthor Man
uscr
ipt
A
uthor Man
uscr
ipt
fragilis was selectively cultured, with time-series spanning 31 to 709 days. For Subjects 08– 12, only one sample was selectively cultured for B. fragilis. Metagenomic sequencing was performed on stool samples from 8 of the 12 subjects (319 stool samples in total). Detailed information about samples used for isolation, including handling conditions prior to sample receipt, is in Table S2 and information about samples used for metagenomic sequencing is in Table S8.
Library construction and Illumina sequencing—Samples were serially diluted in phosphate-buffered saline (PBS) and cultured for B. fragilis on Bacteroidies Bile Esculin plates (BD 221836) in an anaerobic environment. Single colonies suspected of being B. fragilis based on colony morphology were re-suspended in 50μL of PBS with 0.1% L-cysteine. For future characterization, 15μL of the re-suspension was mixed with 15μL of 50% glycerol and stored at −80°C. DNA was extracted from the remaining 35μL using the PureLink Pro 96 genomic purification kit, following the manufacturer’s instructions. Genomic DNA libraries were constructed and barcoded using a modified version of the Illumina Nextera protocol (Baym et al., 2015) (Library Prep. 1). Libraries from one sample (S01–0259, Day 709) were prepared by the BioMicroCenter at MIT using a different protocol, with lower input DNA and a final Pippin size-selection step (Library Prep. 2). Genomic libraries were sequenced either on the Illumina Hiseq platform with paired-end 100-bp reads or on the Illumina Nextseq platform with paired-end 75-bp reads by the Broad Institute Genomics Platform (Table S2).
SNP-calling and identification of major lineages—To estimate the distance between isolates across subjects and identify major lineages, we aligned all short reads to publicly available reference genome NCTC9343 (NCBI accession: CR626927.1) and identified SNPs. Reads were first trimmed and filtered using Cutadapt (Martin 2011) and Sickle (Joshi and Fass, 2011) (pe -q 20 -l 50) and aligned using Bowtie2 (Alignment parameters: -X 2000 --no-mixed --very-sensitive --n-ceil 0,0.01 --un-conc) (Langmead and Salzberg 2012). Isolates for which more than 70% of reads aligned to the reference and which had average coverage of greater than 10 reads across the genome were included for analysis (These filters excluded 1 isolate from subject 10 and 13 isolates from subject 06). Candidate SNPs were identified using SAMtools (Li et al., 2009) and filtered using methods from previous work (Lieberman et al., 2014). In particular, genomic positions were considered to be candidate SNP positions if at least one pair of isolates was discordant on the called base and both members of the pair had: FQ scores (produce by SAMtools) less than −60, at least 7 reads that aligned to each of the forward strand and reverse strand, and a major allele frequency of at least 90%. If the median coverage across samples at a candidate position was less than 10 reads or if 33% or more of the isolates failed to meet filters described above, this position was discarded. For each SNP position identified, a nucleotide call was assigned to each isolate using the major allele call across reads for that isolate at that position. If fewer than 7 reads aligned to either forward or reverse strand of a position in an isolate, or the major allele frequency was smaller than 90%, an ambiguous call was assigned to the isolate at that SNP position. See “code availability” for more information.
A
uthor Man
uscr
ipt
A
uthor Man
uscr
ipt
A
uthor Man
uscr
ipt
A
uthor Man
uscr
ipt
We generated a neighbor-joining tree from the concatenated list of variable positions from conserved genomic regions present in all B. fragilis isolates from all subjects. When computing the distance between each pair of isolates, we only used variable positions that had unambiguous nucleotide calls from both isolates. This tree showed 12 major clades corresponding to the 12 subjects and one minor clade containing a single isolate from Subject 10 (Figure 1A). Within each major clade, all isolates differed from one another by fewer than 100 SNPs. We therefore operationally defined a lineage as a set of isolates that differ by fewer than 100 SNPs and refer to specific genotypes within a lineage as
sublineages. All lineages differed by over 10,000 mutations (Figure 1B); given the molecular clock estimated by this work, this represents at least thousands of years of evolutionary distance.
De novo assemblies of lineage genomes and within-lineage SNP identification —To enable us both to detect variants within genes carried only in a subset of lineages and to detect gains and losses of genomic regions that are specific to single lineages, we created a pan-genome for all isolates from each major lineage. For each major lineage, we
concatenated reads (trimmed and filtered) from all isolates and used this concatenated file as the input for de novo genome assembly via Spades v3.10.0 (parameter: --careful)
(Bankevich et al., 2012). To limit the memory required for assembly, we used 0.25 million pairs of reads from each isolate (~7x coverage). Isolates prepared by the Library Prep. 2, as well as a few isolates with apparent cross contamination (genome assemblies built only using reads from single isolates were larger than 6MB) were excluded in building assemblies. Isolates not used to build the genome assemblies are indicated as such in the metadata associated with the uploaded raw data (see Data availability). Statistics of these genome assemblies are in Table S1. Assembly genomes were annotated using Prokka v1.11 (Seemann 2014). Lineage pan-genomes successfully assembled regions present in only a single isolate (e.g. Figures S1A, S2C, S2E and S3A) and enabled detection of mutations that would have been missed by comparison to a single reference (e.g. mutations in CL4395, Figure 4A). A genome assembly of the minor lineage from Subject 10 was built using all reads from this isolate.
Within-lineage mutations were identified by alignment of short reads to the corresponding lineage genome assembly, using the same parameters as described in the previous section. For lineage 10, the major allele frequency filter was set to 95% to exclude an apparent false positive. Candidate positions in MEDs were also discarded (see below for information on MED identification). Detailed information of intra-subject SNPs from the 12 subjects is listed in Tables S6.
The gene content across the 12 major lineage genomes and the NCTC9343 reference varied between 10%−20% (Using the Szymkiewicz-Simpson similarity coefficient and taking gene length into account, Table S9).
Toxin detection—None of the B. fragilis genome assemblies showed evidence of pathogenicity. We compared the genome assemblies of the 12 major lineages and 1 minor lineage to the Virulence Factors Database, which contains >2400 virulence factors (Chen et al., 2004), via BLAST using a threshold bit score of 200. We found only two hits to the
A
uthor Man
uscr
ipt
A
uthor Man
uscr
ipt
A
uthor Man
uscr
ipt
A
uthor Man
uscr
ipt
database: Cps4J in L11 and ospC4 in L01. Both hits were not toxins previously
characterized for B. fragilis. In contrast, this method identified 171 hits to known B. fragilis-related toxins from 30 out of 88 B. fragilis genomes from National Center for Biotechnology Information (NCBI).
Phylogeny of isolates from each B. fragilis lineage and identification of ancestral alleles—We used parsimony to reconstruct the evolutionary relationship between isolates from the same lineage. For each major lineage, a phylogeny of all isolates was built using a list of concatenated intra-subject SNPs, the closest lineage as an outgroup, and the dnapars program from PHYLIP v3.69 (Plotree and Plotgram, 1989). When
parsimony could not resolve which allele was more likely to be ancestral, we inferred the ancestral allele to be the majority nucleotide at this genomic position across all other lineages with this genomic region. If a region was unique to a lineage, we assigned the ancestral allele that minimized the average mutational distances to the most recent common ancestor (dMRCA) for all isolates (3 cases).
dMRCA of each B. fragilis major lineage, molecular clock, and tMRCA—To calculate dMRCA for each subject at each time point, we counted the number of positions at which the called allele was different than the ancestral allele for each isolate, assessing only SNP positions that were polymorphic among isolates from the particular time point, and averaged the results. For each lineage with multiple time points, we computed the average number of new SNPs brought in per isolate from a later time point compared to the collection of SNPs identified at the initial time point. We then used linear regression to estimate the rate of evolution. The slope of the regression is our estimation of the evolutionary rate (Figure 2C). This method allows us to combine longitudinal data from different lineages to compute a molecular clock. In addition, we computed a molecular clock for L01, used tip-to-root distances overtime and obtained similar estimate (Figure 2D). Each tMRCA was calculated by dividing dMRCA by the estimated molecular clock (Figure 2E). We stress that tMRCA is not an estimate of time to colonization, but simply an estimate of the age of the coexisting diversity. While potential systematic false negative and false positive SNPs may have impacted tMRCA values, these sources of error would have had a similar impact on our molecular clock estimation, as SNP-calling was consistent throughout. Other possible sources of error in estimating tMRCA include incorrect designation of ancestral versus derived allele and undersampling of the population, though collector curves for dMRCA indicate that sampling was usually sufficient (Figures S7A–S7L). Interestingly, collector curves for the number of de novo SNPs reflect that the number of SNPs identified did not saturate (Figures S7M–S7X).
Mutation spectrum of hypermutator sublineage—SNPs were categorized into 6 types, based on the chemical nature of the single nucleotide changes (Figure 2F). For L08, we computed the frequency of each type separately for the hypermutator sublineage and non-hypermutator sublineages (Figure 2F, purple and yellow bars). For the remaining lineages (L01-L07 and L09-L12), we computed the mutation spectrum for each lineage and
A
uthor Man
uscr
ipt
A
uthor Man
uscr
ipt
A
uthor Man
uscr
ipt
A
uthor Man
uscr
ipt
the non-hypermutator sublineages (Chi-squared test, P<0.001), as well as the mean across the other 11 lineages (Chi-squared test, P<0.001). No significant difference was found between the 11 other lineages and the non-hypermutator sublineages from L08 (Chi-squared test, P=0.4). When excluding the GC-TA type of mutation from the analysis, we found no significant difference between the hypermutator sublineage in L08 from the 11 other lineages (P=0.11, Chi-squared test), suggesting that the hypermutation phenotype was exclusively due to an increase in GC-TA mutations.
Metagenomic library construction and Illumina sequencing—Genomic DNA was extracted from stool samples for metagenomic sequencing by the Microbial Omics Core at the Broad Institute using MoBio PowerSoil kits (Qiagen 12955–4) according the
manufacturer’s instructions. Genomic DNA libraries were constructed and barcoded by the Broad Technology Labs from 100–250pg of DNA using the Nextera XT DNA Library Preparation kit (Illumina) according to the manufacturer’s recommended protocol, with reaction volumes scaled accordingly. Pooled libraries were sequenced on the HiSeq platform with paired-end 100bp reads by the Broad Technology Labs.
Identification of Mobile element differences (MEDs)—We aligned short reads to the assembled genome of each major lineage as above and identified candidate regions that were at least 500nt in length, had low relative coverage (< 0.2X) at every nucleotide in at least one isolate, and had >0.9X coverage at every nucleotide in at least one isolate. For L01, we excluded isolates from the final time point, as these isolates’ genomic libraries were prepared differently than the other isolates and therefore had different coverage pattern genomewide.
To account for the fact that single mobile elements could have been separated into multiple pieces in the genome assembly, we grouped regions suspected to emerge from the same event. We clustered sequences that had identical presence/absence patterns across all isolates, where presence was defined by >0.4X average relative coverage over the region. On 3 occasions, we noticed regions that had the same presence/absence pattern but had different coverage distribution across isolates, suggesting they came from distinct mobile elements. In these cases, we separated these clusters of sequence regions into clusters with consistent coverage distribution patterns. Detailed information of all MEDs is in Table S3.
MED gain and loss rates—We used parsimony to infer whether a MED was a gain or loss event. For each MED, we inferred events on the phylogenetic tree generated from whole genome data. If a single change of one type (e.g. gain) could explain the distribution, but more events were required for the other type (e.g. loss), the MED was categorized as such (Table S3; Figure 2B). Seventeen MEDs were classified as unknown because either: multiple gain or multiple loss events were required to explain the distribution (e.g. MED01–2); or both a single gain event and a single loss event were consistent with the distribution. Interestingly, one putative MED from L11 appeared to have been lost many times among isolates during culture (Figure S3D). To estimate lower bounds for the rates at which gain and loss events change B. fragilis genomes, we weighted each observed MED j by its frequency within lineage i (fij). We then divided the weighted sum of events by the total time of diversification, estimated by the sum of tMRCA at initial sampling. The following
A
uthor Man
uscr
ipt
A
uthor Man
uscr
ipt
A
uthor Man
uscr
ipt
A
uthor Man
uscr
ipt
equation was used for gain and loss events, separately: ∑i∑jfij/∑itMRCAT0, i. To estimate the absolute contribution of gain and loss events to the size of B. fragilis genomes, we accounted for length of each MED ∑i∑j Lijfj /∑itMRCAT0, i
Inter-species mobile element transfer—For each lineage, we scanned the assembled genome for regions with high average relative coverage when aligning metagenomic reads to the lineage genome assembly (>3X). The coverage of metagenomic reads over the B. fragilis assembly varied over as much as 1000 folds due to reads from homologous regions of different species. Therefore, to normalize against the true expected coverage of the B. fragilis genome, we divided observed coverage at each position by the mean coverage across positions between the 30th percentile and 70th percentiles (median was not precise given the low coverage in some samples). To identify recent transfer events, we searched the genome for candidate regions >5000 nucleotides in length and in which the consensus genome from metagenomes was <0.02% different from the consensus genome from isolates of the same subject. We found 14 candidate regions in 3 lineages. We found only two candidate regions that overlapped with MEDs, all of which were in Subject 04 (representing one MED). Information about these candidate regions is listed in Table S4.
We identified two genomic regions (31 Kb and 62 Kb, respectively) that were candidates for inter-species mobile element transfer in Subject 01. These two regions contained distinct ORFs homologous to conserved genes from type 6 secretion system of genomic architecture 2 (Figures S1B–S1C), consistent with a single transfer event. This transfer event was inferred to be an integrative conjugative element (ICE) because it contains the tra genes associated with integrative conjugative elements and a tRNA gene at one edge of a transfer region (Table S4). To test if the putative ICE was indeed transferred between species, we cultured and sequenced the genomes of 94 Bacteroides isolates from this subject. We examined 53 Bacteroides vulgatus isolates (43 isolates one B. vulgatus lineage, 10 isolates from a different B. vulgatus lineage, Figures S1B–S1C), 25 Bacteroides ovatus isolates, 4 Bacteroides xylanisolyens isolates, 10 Bacteroides stercoris isolates and 2 Bacteroides salyersiae isolates. We sequenced these isolates as described for B. fragilis and aligned reads to the mobile element candidates, using the same parameters for B. fragilis. Strikingly, both genomic regions were present (average coverage >10 reads) in all B. ovatus, B.
xylanisolyens, and B. vulgatus isolates profiled, but absent in all isolates of the other two species. The perfect co-occurrence of these two genomic regions further supports that they were from a single transfer event.
Parallel evolution—We counted a gene as under parallel evolution if, in at least one subject, the gene had multiple independent SNPs and more than 1 SNP per 2,000 bp (to account for the fact that long genes are more likely to be mutated multiple times by chance). Cases in which two SNPs in the same gene always occurred together in the same isolates were not included as parallel evolution (one case from L04). To identify nucleotide positions that mutated multiple independent times within a person, we leveraged the parsimony phylogenies described above. We inferred the genotypes of all internal nodes using the
A
uthor Man
uscr
ipt
A
uthor Man
uscr
ipt
A
uthor Man
uscr
ipt
A
uthor Man
uscr
ipt
S3C). All genes under parallel nucleotide evolution also underwent parallel evolution involving distinct amino acid residues within at least one lineage. To determine whether the number of genes under parallel evolution represented a significant departure from what would be expected in a neutral model, we performed for each subject 1,000 simulations in which we randomly shuffled the mutations found across the lineage genome assembly and calculated how many genes showed a signature of within-person parallel evolution (Figure 4B). To compare genes from different assemblies, coding sequences identified by Prokka from all lineages were clustered using CD-HIT with at least 98% identity and 90% coverage (Fu et al., 2012). Detailed information for each gene under parallel evolution is in Table S5 and gene clusters are listed in Table S9. Simulations performed for metrics of cross-subject parallel evolution did not yield additional signatures of adaptive evolution (Figures S4A– S4F).
dN/dS—Mutations were categorized as synonymous (S) or non-synonymous (N) based on open-reading frame annotations created by Prokka (Seemann 2014). To calculate dN/dS for sets of de novo mutations emerged within subjects (Figure 4C, first two categories), we normalized the observed N/S ratios by the expected N/S ratios. For any given set of SNPs, we calculated the expected N/S for these SNPs, accounting for both (1) the different probabilities of acquiring nonsynonymous mutations for different types of mutations and (2) the codon compositions of the genes in which these SNPs occurred. This method is similar to what we have done previously (Lieberman et al., 2014), but accounts for different codon composition between genes. 95% confidence intervals were calculated using binomial sampling.
To compute dN/dS for mutations across lineages (Figure 4C, third category), we leveraged publicly available sequences. We downloaded fastq files of 55 publicly available B. fragilis isolate sequencing runs. We then identified mutations across these genomes and the 12 major lineages from this study (one isolate per lineage) using the same approach and parameters described above (Identification of major lineages and SNPs). The NCTC9343 genome was used as reference and ancestor. Expected N/S ratio was calculated with the same method described above, using all the SNPs identified across lineages.
We calculated dN/dS for cross-lineage mutations in individual genes (Figure 6C). Since lineages are separated by tens of thousands of SNPs (Figure 1) and the molecular clock for B. fragilis is ~1 SNP/genome/year (Figure 2C–D), this metric reflects selection over thousands of years. Expected N/S ratio was calculated with the same method described above, using only cross-lineage SNPs identified within the particular genes. For 3 genes not present in the NTCT9343 genome (Figure 4A), we used the de novo assemblies to recruit reads from the publicly available sequences. No cross-lineage SNPs were identified in these 3 genes and dN/dS was not reported for these genes.
Annotation of genes under selection—To discover homologs of the sixteen genes under within-person parallel evolution, we used blastp to search against the RefSeq database, excluding proteins from B. fragilis genomes. Top hits with 3–4 letter gene names were searched against the B. fragilis genome to confirm whether they are true orthologs. We used the organisms from which these gene names were initially described to avoid false
A
uthor Man
uscr
ipt
A
uthor Man
uscr
ipt
A
uthor Man
uscr
ipt
A
uthor Man
uscr
ipt
propagation of misannotation. We also used PaperBLAST to aid in identifying candidate gene names (Price and Arkin, 2017). Cellular localizations were predicted using CELLO (Yu et al., 2014).
Conservation scores for each mutated residue was predicted using the Consurf web service (Ashkenazy et al., 2010). For each gene, we used blastp to find homologs from the RefSeq database (first 100 hits; sequence similarity from 35% to 95%; query coverage > 80%). A multiple sequence alignment (MSA) was created using Clustal omega from the EMBL-EBI web service (McWilliam et al., 2013) (default parameters). We then used each MSA to generate conservation score at each amino-acid residue using Consurf (default parameters). Detailed information is in Table S5.
SusC and SusD protein structures and interface residues—Available crystal structures of a SusC homolog (BT1763) from Bacteroides thetaiotaomicron (Glenwright et al., 2017) was used to visualize the mutations observed in Sus genes under parallel
evolution. We aligned the five B. fragilis SusC proteins under parallel evolution and BT1763 using Clustal Omega from the EMBL-EBI web service (McWilliam et al., 2013) (default parameters). For all non-synomymous mutations, we identified their aligned positions on the BT1763 crystal structure. Two amino acid residues aligned to the first 211 amino-acid region, which encodes for a plug domain and is not available in the crystal structure of BT1763 (Glenwright et al., 2017). Eight non-synonymous mutations from Sus genes under parallel evolution are marked in red in Figure 4D, using PyMol software (Schrödinger, LLC, 2015).
To test if the mutated residues were enriched at the interface between SusC and SusD, we used the PDBePISA web service (Krissinel and Henrick, 2007) (default parameters) to classify residues on the BT1763 crystal structure as in contact or not in contact with the SusD homolog. Of 806 residues, 119 were inferred to be interface residues. Among the 8 residues that were mutated in parallel, 4 of them were predicted to be interface residues in both programs, a significant enrichment (P=0.02, Fisher’s exact test). A similar result was obtained using the PyMol function InterfaceResidues (cutoff=1.0; P=0.02, Fisher’s exact test).
Enrichment of membrane proteins—For all genes from the 12 major lineage genome assemblies, we used CELLO (Yu et al., 2014) to predict the cellular localization. Genes were considered to be membrane-related if they were annotated as inner membrane, periplasmic, or outer membrane. To compare our observation to the null expectation, we performed simulations. For each of the sixteen genes, we randomly selected one gene from the genome assembly of the lineage in which parallel evolution was identified. If a gene had parallel mutation in multiple lineages, we randomly chose one of the lineages. The cellular localization of n SNPs was assigned based on the CELLO prediction of this randomly picked gene, where n is the number of SNPs the original gene had across lineages. The proportion of SNPs from membrane-related genes was inferred using all sixteen such randomly picked genes (repeat genes not allowed). This procedure was repeated 1000 times
A
uthor Man
uscr
ipt
A
uthor Man
uscr
ipt
A
uthor Man
uscr
ipt
A
uthor Man
uscr
ipt
the sixteen genes under selection, 79% of the SNPs are from membrane-related genes, a significant deviation from the null distribution (P<0.001).
Signatures of subject-specific adaptation—Fisher’s exact statistic was used to test subject-specific adaptation, comparing the number of SNPs in a tested gene within a particular lineage, the number of SNPs in other genes within this lineage, the number of SNPs in this gene from all other lineages combined, and the number of SNPs in other genes from all other lineages combined. We tested 10 genes that were present in multiple subjects but mutated only in one subject. The p-values for BF1802, BF3581, BF1803, are all less than 0.005, suggesting person-specific adaptation.
Mutation dynamics from metagenomes—Metagenomic reads from Subject 01, acquired as described above, were aligned to the assembled genome of L01 using the same parameters described for aligning isolates reads. We tracked the frequency of each SNP found in 4 or more isolates from L01; SNPs found in fewer isolates were not abundant in the metagenomes. For each of the 21 SNPs that met this threshold, we calculated the frequency of reads at each position that agreed with the mutation (derived) allele. As the total
metagenomics sequencing coverage was limited and B. fragilis represented only ~5% of reads on average (Figure S5A), not every SNP was covered at every time point. For each SNP, we visualized its dynamics by using time points with non-zero read counts and smoothing the trajectory using the Savitzky-Golay method with a span of 25 and degree of 0 (Figure 5B).
To plot a schematic of the population dynamics of different sublineages (Figure 5C), we averaged frequencies of SNPs that were shared by a particular sublineage to estimate the relative abundance of this sublineage. To fill the time points where no stool community was sampled, we generated a continuous relative abundance trajectory for each sublineage using Fourier curve fitting (Matlab model fourier8). To visualize parent and child sublineages separately, we subtracted the relative abundance of a parent sublineage by the sum of relative abundances of its child sublineages. When the combined relative abundance of child
sublineages exceeded that of their parent sublineage, we set the frequency of the parent sublineage to 0. After Day 180, we manually set the frequency of the SL1 parent genotype to zero, and reduced discontinuities caused by this assignment by an additional Fourier curve fitting step (Matlab parameter: fourier8). The imputed relative frequencies were then renormalized so that they sum up to 1. We also examined L03’s dynamics during
colonization using 74 metagenomes collected over 144 days (Figures S5C–S5F). The same methods were used as described above, with the exception that mutations in at least 3 isolates were able to be tracked, owing to the higher relative abundance of B. fragilis in Subject 03 (Figure S5C).
Selection coefficient was inferred using 1 + sg= f, where f r epresents the change in genotype frequency, g represents the number of generations and s represents the selection coefficient.
Competition experiments—We performed competition experiments using pairs or trios of isolates from different L01 sublineages. Frozen stocks were restreaked on brain heart
A
uthor Man
uscr
ipt
A
uthor Man
uscr
ipt
A
uthor Man
uscr
ipt
A
uthor Man
uscr
ipt
infusion plates (Sigma-Aldrich 53286–500G) supplemented with haemin and vitamin K (BHIS) and revived for two days. Isolates were cultured concurrently using the following procedure in order to ensure reproducibility. Single colonies were inoculated in 1 mL of BHIS liquid media (hour −64). After 24 hours of growth, each pure culture was diluted 1:100 into 1 mL of BHIS liquid media and grown for another 24 hours. At hour −16, each pure culture was diluted 1:5 and grown for another 16 hours. All operations were performed in an anaerobic chamber and bacteria were grown at 37 °C.
Synchronized and saturated pure cultures were mixed at hour 0. Co-cultures were diluted 1:100 in 1 mL of BHI liquid media and grown at 37 °C anaerobically. At indicated points, 80 μL aliquots of each co-culture was taken for OD measurement and targeted amplicon sequencing. For the experiments shown in Figures S5G–S5K, time points were taken at 0, 6, 9, 12, 15 and 22 hours. For the experiments shown in Figures 5E–5G, we passaged the co-culture for another round of dilution at hour 18, and timepoints were taken at 0, 9, 18 and 27 hours.
Targeted amplicon sequencing—To determine the relative abundances of different sublineages in co-cultures, we picked two mutations from BF1802 that distinguished sublineages: D526N (T to C) mutation distinguished SL1 from SL2, and T340M (A to G) separated SL1-a-1–1 from all other sublineages (Table S7). We designed two sets of primers that covered these mutations: ATCTTCTATCGCCTGCCGTG-3’ and
CGTGTATTCCGCCCTCTACC-3’ for D526N and
5’-GCCAAAAACAAGGCAAATGACG-3’ and 5’-GGTCGCTTCCTTACGGGTAT-3’ for T340M. Each primer was linked to an Illumina adapter overhang nucleotide sequence (See online manual: Illumina 16S Metagenomic Sequencing Library Preparation). The co-culture was first incubated in alkaline PEG solution at 95 °C for 10 minutes (Chomczynski and Rymaszewski 2006). The target sequences were amplified individually using the KAPA HiFi HotStart Ready Mix, 2 μL lysis product, and 0.5μM of forward and reverse primers.
Libraries were diluted 30X and barcoded using 2.5 μL diluted PCR products as template for PCR, the KAPA HiFi HotStart Ready Mix, and 0.5μM Nextera primers (Baym et al., 2015). Amplicon sequencing libraries were sequenced on the Illumina Miseq platform with paired-end 250-bp reads by the Broad Institute Genomics Platform. Sequencing reads were aligned to the assembled genome of L01 using the same parameters described for aligning isolates reads. Relative abundances were inferred by counting the number of nucleotides assigned to different sublineages at the targeted mutation loci.
Phage plaque assay—All pairs of donor-recipient assays were performed on three different media: BHIS, BPRM and BPRM+Bile (Media recipes can be found in Table S6). At hour 0, selected isolates from the freezer were restreaked on three different media plates. At hour 48, 10 colonies from each restreak were picked and inoculated into 500 μL of the corresponding liquid media. We then transferred 10 μL of the well-mixed pre-inoculum into 3.5 ml of media in a deep well 48-well culture block. Media for overnight cultures was aliquoted into tubes and culture blocks aerobically and these were transferred into the anaerobic chamber immediately prior to inoculation. To prepare donor filtrates at hour 73,