HAL Id: hal-01381108
https://hal.archives-ouvertes.fr/hal-01381108
Submitted on 15 Jun 2018
HAL is a multi-disciplinary open access
archive for the deposit and dissemination of
sci-entific research documents, whether they are
pub-lished or not. The documents may come from
teaching and research institutions in France or
abroad, or from public or private research centers.
L’archive ouverte pluridisciplinaire HAL, est
destinée au dépôt et à la diffusion de documents
scientifiques de niveau recherche, publiés ou non,
émanant des établissements d’enseignement et de
recherche français ou étrangers, des laboratoires
publics ou privés.
Are ditch networks optimised for mitigating rill erosion
in cultivated Mediterranean landscapes? A numerical
experiment
Florent Levavasseur, Jean-Stéphane Bailly, Philippe Lagacherie
To cite this version:
Florent Levavasseur, Jean-Stéphane Bailly, Philippe Lagacherie. Are ditch networks optimised for
mitigating rill erosion in cultivated Mediterranean landscapes? A numerical experiment. Land Use
Policy, Elsevier, 2016, 50, pp.441 - 448. �10.1016/j.landusepol.2015.08.033�. �hal-01381108�
The erosion of cultivated soils poses a significant threat to com- munities and agricultural areas, especially in Mediterranean areas where high rainfall intensities, depleted topsoil organic matter contents and low vegetation coverage due to land use (e.g., vine- yards and orchards) increase the erosion risks. Among the range of dis-services induced by erosion, the occurrence of rill erosion in
∗ Corresponding author at: AgroParisTech, UMR LISAH, F-34060 Montpellier, France.
E-mail addresses: fl[email protected] (F. Levavasseur), [email protected] (J.S. Bailly), [email protected] (P. Lagacherie).
why Mediterranean farmers have historically adopted soil conser- vation practices to mitigate rill erosion, including building terraces that reduce slope and runoff velocity (Ramos and Porta, 1997; Roose and Sabir, 2002; Blondel, 2006; Bevan and Conolly, 2011; Stanchi et al., 2012; Tarolli et al., 2014), building ditches that inter- cept runoff (Ramos and Porta, 1997; Roose and Sabir, 2002; Tarolli et al., 2015) and benching terraces to stop runoff on hill-slopes (Wheaton, 2001; Nasri, 2007). However, these practices repre- sent non-negligible settlement costs and generate indirect costs for farmers by reducing field sizes, decreasing field accessibility and inducing additional maintenance work (Martnez-Casasnovas and Ramos, 2006; Petanidou et al., 2008).
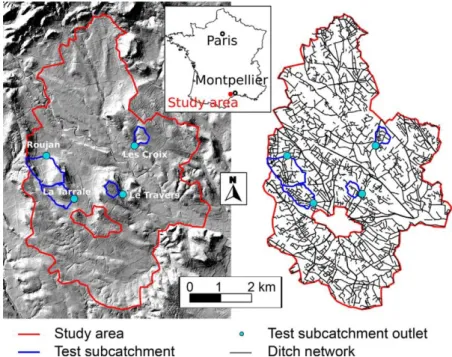
Fig. 1. Study area. Left: hillside view of the study area. Right: ditch network map. The location of the four sub-catchments and corresponding outlets used for the network simulation.
As pressures from the market continue to increase, the search for a good compromise between these costs and the efficiency of measures for protecting soils from erosion is accelerating (Douglas et al., 1996). Tarolli et al. (2015) proposed a morphometric index derived from LiDAR as a support for scheduling a correct ditch net- work to reduce erosion. In their work they proposed only a few simple examples of different ditch systems. To extent this approach, numerical experiment can be proposed to explore the effects of a wide range of ditch network geometries on soil erosion. In this case, numerical experiment consists in coupling a soil conservation fea- tures simulator and an erosion model. It has been successfully used by Gumiere et al. (2015) to optimise the location of vegetative filters regarding their efficiency in reducing erosion.
This paper proposes a numerical experiment-based approach that tests actual soil conservation practices for their closeness to a cost-efficiency compromise. This approach is applied to the ditch networks of the Languedoc vineyard catchments (Levavasseur et al., 2014). In this experiment, the costs are approximated based on the densities of the ditches, and the rill erosion risks are summarised by a modified stream power index (Moore et al., 1991). In four small sub-catchments located in the Peyne catchment (Languedoc – southern France), the actual ditch networks are compared to a set of virtual networks that are produced by a network simulation algorithm that browses a large range of densities and optimises the network geometries with regard to rill erosion protection. Finally, the approach is completed by quantifying the role of the ditch net- work in reducing erosion over the entire Peyne catchment. 2. Study area
2.1. Main characteristics
The study area is located in the downstream portion of the Peyne catchment in southern France (Fig. 1, left), which covers
an area of 40 km2 and is mainly covered by vineyards (60%) with
shrubs, cereal fields and fallow fields occupying the remaining areas. The average field area is approximately 0.5 ha. The altitude varies between 28 m and 128 m, and three main geomorphological
units can be distinguished, plateaus in the southern and north- western areas, hill-slopes with slopes greater than 10% in the centre of the area and an alluvial plain. The climate is Mediterranean with an annual precipitation of 600 mm to 800 mm and two short, intense rainy seasons in the autumn and spring. Given the charac- teristics of the catchment, soil erosion can be high, with an average erosion rate of 10.5 t/ha/y and a high spatial variability (Paroissien et al., 2010). Four headwater sub-catchments were selected within the study area (Fig. 1, right) for hosting the numerical experiments. These catchments have various areas, slopes, land cover and ditch network densities (Table 1).
2.2. Ditch networks
The ditch network of the study area was exhaustively mapped during previous studies (Bailly and Levavasseur, 2012; Levavasseur et al., 2012, 2014). The width and depth of the ditches varied from approximately 50 cm to several meters. The mean density of the ditch networks was 96 m/ha. The minimum and maximum val- ues of the ditch network density, calculated using 250 m × 250 m pixels, were 0 m/ha and 231 m/ha, respectively. This ditch net- work mainly consisted of agricultural and roadside ditches, but also included sunken paths and channelised rivers that were considered as ‘ditches’ for simplification. In the Languedoc vine- yard plain, the ditch networks are often associated with terraces and were built over a century ago to remove excess water from fields and eliminate the highly visible threat of rill erosion. This assumption was recently confirmed by surveying farmers in the study area (Levavasseur, 2012), which indicated that 50% of the ditches were perceived as erosion-limiting landscape features and 80% of the ditches were declared as being yearly maintained for preventing the overflow that generates rill erosion. This driver is clearly illustrated in Fig. 2 for a particular event.
2.3. Spatial data
Three types of spatial data were involved in the proposed approach. (i) A stereo-photogrammetric 5 m resolution Digital
Roads: 1.1% Tracks: 0.4% Le Travers 18 5 Agriculture: 91.3% 87 Natural areas: 4.2% Roads: 1.2% Tracks: 1.3% Residential: 2.0%
Elevation Model (DEM) provided by the local government. Pre- processing was applied to this DEM to remove sinks and ensure continuous water flow paths (Wang and Liu, 2006). (ii) The lat- tices of the field boundaries that were digitised from an airborne
image of the study area were acquired in 2007. (iii) A 5 m resolu- tion land use map with a simple classification (agriculture, natural area, track, or road) was obtained by visually interpreting the image evoked above.
Fig. 2. Observations in a vineyard in southern France on a hillslope during a rain event in March 2011 (103 mm in a day, 208 mm in four days) and one and a half months later (in April). Picture 1: the ditch is filled and does not stop runoff from the upper terrace. Picture 2: runoff flows on the lower terrace. Picture 3: runoff causes gully erosion on the lower terrace. Pictures 4 and 5: one and a half months later, the ditch was dredged and could intercept runoff.
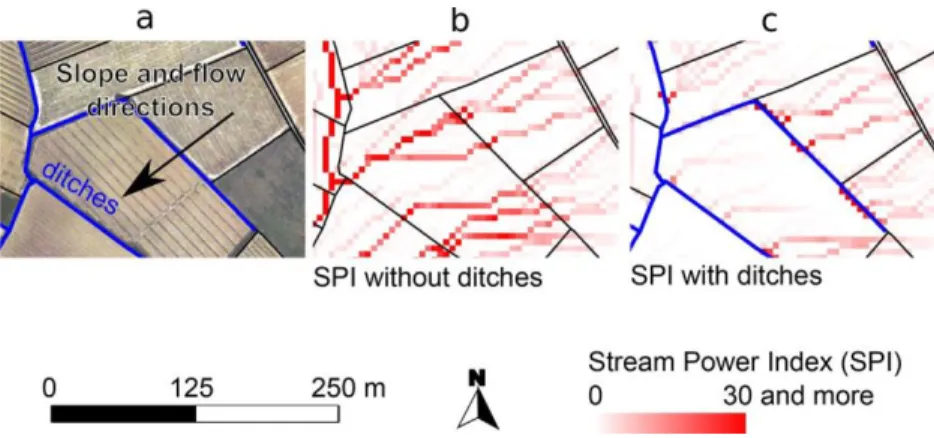
Fig. 3. Computation of the Stream Power Index (SPI): (a) aerial photograph of a site and the resulting SPI computation, (b) without considering the ditch network in the DEM or (c) when burning the ditch network in the DEM.
3. Methods
The general principle of the proposed approach is to compare the geometry of the actual ditch network with the geometries of many
Next, the SPI was successively upscaled to field and catchment scales using spatial aggregations of the SPI values. Upscaling to the field scale was performed as follows:
n
1 other possible ditch networks (Levavasseur et al., 2012) regarding
their abilities to mitigate rill erosion. Thus, this approach requires (i) an indicator for quantifying rill erosion risks for a given ditch net-
SPIj =
n × SPIi (2)
i
work, (ii) an algorithm that simulates ditch networks over a large range of densities and spatial configurations and (iii) a protocol for setting the numerical experiment on a given catchment. These three points are detailed below.
where SPIj is the mean SPI value of field j, SPIi is the SPI value of pixel
i located in field j, and n is the number of pixels in field j. To avoid boundary and rasterisation effects, the pixels located less than 5 m from a field boundary were excluded from this aggregation process. Next, the SPI was upscaled to the catchment scale by aggregating
the field SPI values (SPIj ) as follows:
1 3.1. Rill erosion risk assessment
The risk or rill erosion was evaluated using a modified version
SPIk =
j Aj
× SPIj × Aj (3) j
of the Stream Power Index (SPI) that has been widely used for map- ping soil erosion risks where soil conservation practices should be implemented (Moore et al., 1991). The SPI at a given location was expressed as follows:
SPI = kA × tan ˇ (1)
where SPI is the Stream Power Index, ˇ is the slope, and A is the upstream drained area. The k coefficient was introduced to account for possible water infiltration in the upstream drained area, which attenuate the soil erosion risks. This coefficient varies between 0 and 1 according to the land use of the upstream drained area. First, we calculated the SPI at each pixel of a modified 5 m resolution DEM that was obtained by burning the ditch network in the initial DEM. Burning was performed by decreasing the elevation value at each pixel overlapping the ditch network (Saunders, 1999). The slope was computed as the first derivative of the elevation from an adjusted polynomial surface formed by 3 by 3 windows cen- tred on the pixel (Zevenbergen and Thorne, 1987). The upstream drained area was computed as the area of the catchment with the pixel as the outlet. According to previous hydrological modelling studies that were conducted in the same area (Moussa et al., 2002; Chahinian, 2004), the k values were fixed at 1, 1/5, 1/15 and 1/80 for the pixels that mainly included roads, tracks, cultivated areas and natural areas, respectively.
Fig. 3 illustrates the impacts of ditch networks on the compu- tation of the SPI on a hillslope (Fig. 3a). Without the ditch network (Fig. 3b), runoff is concentrated along the hillslope, which results in high SPI values within the fields (red pixels). Conversely, when the ditch network was present (Fig. 3c), the ditches intercepted runoff and resulted in low SPI values (white pixels).
where SPIk is the aggregated SPI value of sub-catchment k, Aj is the
area of field j in sub-catchment k, and SPIj is the mean SPI values
of cultivated field j in sub-catchment k. Because we focused on the rill erosion perceived by farmers, this aggregation was restricted to cultivated fields.
3.2. Simulation of the ditch networks
A previously developed simulation ditch networks algorithm (SDNA) (Bailly et al., 2011) was adapted to account for the rill erosion risks. In the following section, we summarise the main characteristics of the basic algorithm and describe the modifica- tions that were performed. Additional details can be found in Bailly et al. (2011).
When using the SDNA, it is assumed that the ditches are located at the field boundaries. The ditch networks are thus represented by connected and directed sub-graphs of the planar lattice that repre- sent the cultivated field boundaries within a cultivated landscape. The role of the SDNA is to select whether each lattice element is a ditch or not according to a stochastic drainage process. The initial SDNA builds tree-structured sub-graphs with a defined root (the outlet of the catchment) and a set of disconnected reaches that should be known. It performs the connexion between disconnected reaches and the outlet while (i) accounting for the slope direction of each lattice elements, (ii) considering a given network length (or a drainage density) and (iii) maximising the proportions of the reconnected reaches. This algorithm uses random network initial- isation and a simulated annealing algorithm, which are both based on random pruning or branching processes, to converge the multi- objective properties of the networks. Thus, the following steps are used to build a set of possible ditch networks: valuation of the pla- nar lattice of the field boundaries by the slope directions obtained
Fig. 4. Conceptual diagram of the modified simulation ditch network algorithm.
from a DEM (step 1), selection of an outlet among the lattice nodes and of known reaches among the lattice edges (step 2), running the branching/pruning processes until the target network length is attained (step 3), and saving the resulting ditch network (step 4). Steps 3 and 4 are iterated until the required number of possi- ble ditch networks is produced. The erosion-adapted SDNA differs from the basic SDNA when considering the maximum SPI value cal- culated at each edge of the lattice representing the field boundaries (Fig. 4). This value is used in step 2 to select the initial disconnected reaches among the reaches with the greatest SPI values (i.e., that best minimise rill erosion risks). In addition, this value is used in step 3 to orient the addition or deletion of ditches on the lattice edges through the branching/pruning process. For example, a ditch that becomes useless (low SPI value) following the addition of an other ditch upstream is removed during the pruning process.
Because the tree sub-graph geometry is constantly modified during this process, the SPI must be recalculated for each lattice edge at each iteration, which significantly increases the computing time relative to the basic SDNA. This algorithm was developed in R using the RSAGA library (Brenning, 2008). For example (Fig. 5), it took 15 min to produce a set of 3 ditch networks representing
between 30 and 300 reaches in a 1 km2 sub-catchment when using
a usual 2 GHz dual core PC. 3.3. Numerical experimental design
A set of 100 possible ditch networks was generated for each of the four studied sub-catchments. For a given sub-catchment, the target network lengths (i.e., densities) were randomly selected between the length of the outlet segment (a few decametres) and the cumulative length of the field boundaries (up to 30,000 m
per km2 ). However, the sampling favoured small lengths (i.e., the
two first terciles) to better explore the larger spaces of the pos- sible networks when the small lengths were imposed. Assuming homogeneous ditch building costs and the costs of maintaining the ditches for a specified length, the costs of the ditch network
at the sub-catchment scale mainly varied with the densities of the networks (i.e., the length of the ditch network).
Each of the simulated ditch networks was evaluated for its abil- ity to mitigate erosion using the catchment-pooled SPI presented above. Finally, the erosion mitigation that resulted from the actual ditch networks of the four sub-catchments was compared with the simulated networks, allowing a Pareto optimality frontier delin- eation into the network density and erosion risk space. Because it was not possible to apply this numerical experiment throughout
Fig. 5. The actual ditch network of the Roujan sub-catchment and three example simulated ditch networks with contrasting network densities.
4.3. Extension to the Peyne catchment
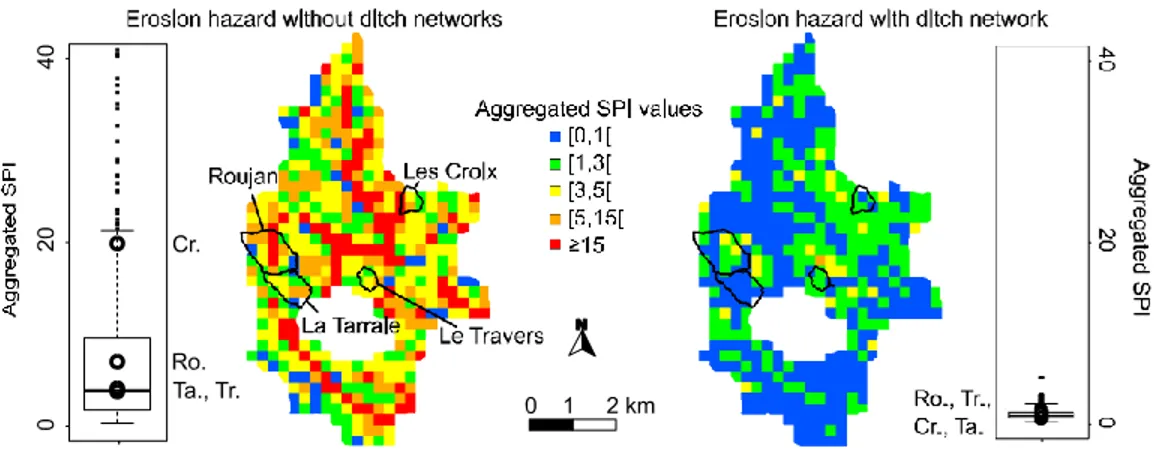
Fig. 7 shows the maps of the aggregated SPI values on a 250 m grid across the entire Peyne catchment with and without consid- ering the actual ditch network (Fig. 7a and 7b respectively). Fig. 7a exhibited large variations in the SPI that were governed by varia- tions in relief and land use within the catchment. When the impact of the ditch network was considered (Fig. 7b), the mapped SPI val- ues decreased dramatically and were less variable, as the tail of the high SPI values observed in Fig. 7a decreased. This finding con- firmed the results obtained on the four studied sub-catchments (SPI for lowest and greatest values of drainage density on Fig. 6).
5. Discussion
5.1. Diagnosis of the actual ditch networks with regard to rill erosion
Fig. 6. Relationships between the aggregated SPI and ditch network lengths depend- ing on the version of the network simulator for the four sub-catchments.
the drainage network of the Peyne catchment due to comput- ing limitations, a simplified approach that avoided the simulation step was used to obtain complementary results at this scale. This approach consisted of computing the aggregated SPI values (Eq. (3)) on a 250 m square grid that covered the entire study area. These val- ues were calculated with and without considering the actual ditch networks and were compared to each other.
4. Results
4.1. Network length vs rill erosion
The lengths of the simulated ditch networks were plotted against the sub-catchment-aggregated SPI (Fig. 6). Clear expo- nential decreases in the SPI were observed in all the studied sub-catchments. The reduced erosion rate measured by the SPI was greater for the smallest lengths and became negligible beyond the thresholds of the network length, ranging from 100 to 200 m/ha. The minimal SPI values were low and rather similar across the sub- catchments (between 0 and 1), and larger variations were observed across the catchments for the smallest network lengths (between 3.5 and 6.5).
4.2. Performances of the actual sub-catchment ditch networks for mitigating erosion
Regardless of the sub-catchment, the abilities of the actual ditch networks to mitigate rill erosion, as measured by the SPI, were simi- lar and near the maximum (minimum SPI) that was obtained by the simulations (Fig. 6). However, the minimal simulated SPI values in Roujan and Le Travers were slightly greater than those observed in la Tarrale and Les Croix. For all sub-catchments other than Roujan, these SPI values were obtained when using ditch network lengths that were similar to the lengths optimised by the erosion-adapted SDNA (near the approximated Pareto frontier), which meant that these ditch networks were optimal with regard to erosion miti- gation. Conversely, in Roujan, a simulated network yielded a SPI similar to that of the actual network with a length that was 30% less than that of the actual one (77 m/ha vs 110 m/ha).
The results obtained from the four studied sub-catchments and from the entire Peyne catchment showed that the ditch networks played a major role in limiting the risks of rill erosion in cultivated fields because the SPI values dramatically decreased and became homogeneous when the actual ditch networks were considered. Furthermore, we showed that mitigation of the rill erosion risk was obtained for minimal drainage networks lengths in four sub-catchments, which suggests that the actual ditch net- work geometries resulted from an optimisation process conducted by farmers over the centuries. This highlights the importance of erosion mitigation as the first priority when building ditches in Mediterranean cultivated landscapes (Ramos and Porta, 1997; Roose and Sabir, 2002; Gardner and Gerrard; Paroissien et al., 2010; Stanchi et al., 2012). For further confirmation, the actual and sim- ulated ditch networks were compared within a bivariate Pareto frontier optimality framework to determine whether the efficiency of ditch networks for mitigating erosion could be improved. Based on this comparison, the Les Croix and La Tarralle sub-catchments already appear fully optimised, i.e., located on the Pareto frontier. In the Le Travers sub-catchment, the ditch network density appears to be optimised regarding the rate of protection against erosion. However, this rate could decrease for a denser network. In the Rou- jan sub-catchment, the simulated ditch networks with densities that were similar to the actual densities showed lower SPI values, which suggested that a better geometry could result in better ero- sion protection. However, this apparent non-optimality may also result from the need to optimise the ditch network for another landscape function, such as groundwater drainage (see further dis- cussion). Additional studies are necessary to understand why these two sub-catchments only exhibited sub-optimal ditch networks.
5.2. Erosion modelling limitations
In the proposed approach, the risks of rill erosion were modelled using the SPI, which was further aggregated for sub-catchments (250 m × 250 m pixels). The simplicity of this index was advanta- geous for building a new version of the network simulator that produced optimised ditch networks for mitigating erosion. How- ever, the SPI only considers the local relief, upstream land use and the presence of run-off interception features and does not consider soil and climate variabilities, which may generate bias in erosion risk assessments. However, recent studies in the same region (Paroissien et al., 2010) indicated that the relief (slope) and ditches were the first features that explained multi-decennial erosion in vineyards, which confirmed the value of using SPI in this region. The extension of this method to other landscapes would likely require the use of more sophisticated approaches for
Fig. 7. Maps and boxplot of the aggregated SPI values on a 250 m square grid in the study area, which depend on the considerations of the ditch networks in the computation of the SPI.
assessing erosion, such as physically-based and spatially explicit erosion models, e.g., EUROSEM (Morgan et al., 1998) or Mhydas- Erosion (Gumiere et al., 2011). Nevertheless, some parameter calibration issues occur when using these models (Hessel and Tenge, 2008) that would require undertaking more field obser- vations (Bellin et al., 2009). Furthermore, computational solutions should be found for coupling these models with the presented net- work simulator while maintaining reasonable computing costs. 5.3. Extending to other soil conservation features
Our approach only considered building ditches as unique soil conservation practices, for which several soil conservation prac- tices are usually combined (e.g., building terraces and ditches) (Ramos and Porta, 1997; Stanchi et al., 2012). The presence of terra- ces was partially considered by using a high resolution (5 m) DEM. However, changes in terrace locations were not considered in our simulation algorithm. Further investigations should (i) include the simulation algorithm and the entire set of possible soil conservation features (ditches, terraces, embankments, grass strips, etc.) with their specific constraints and spatial relationships to each other and (ii) represent their impacts on erosion, which can be used for more sophisticated models than the SPI (see above).
5.4. Multifunctional role of the ditch networks
This study focused on the roles of ditch networks in mitigat- ing rill erosion in fields. Because ditches are involved in many landscape processes, they have many other functions and impacts that should be considered in a comprehensive evaluation. First, ditches can be made for purposes other than erosion mitigation (e.g., draining groundwater, conducting excess water). Further- more, they have secondary impacts, such as impacts on ditch-edge erosion (Elliot and Tysdal, 1999), flood intensification in down- stream areas (Moussa et al., 2002; Roose and Sabir, 2002; Buchanan et al., 2013), groundwater recharge concentrations(Dages et al., 2009), pesticide mitigation (Stehle et al., 2011) and biodiversity control (Herzon and Helenius, 2008). Thus, it is highly probable that ditch networks may not be equally optimal across all these aspects, especially regarding the unintended impacts other than rill erosion mitigation. Next, a multi-criteria analysis should be con- ducted, which requires extending the proposed approach to many other landscape processes.
5.5. Towards structure–function numerical experiments
These numerical experiments conducted to assess the efficiency of ditch networks for mitigating rill erosion in the Languedoc
vineyard could serve as a starting point for future studies involv- ing ‘structure–function-value’ chains, which are advocated by Termorshuizen and Opdam (2009) for dealing with landscape ser- vices. Comparisons between the actual spatial structures of the landscape features and the simulated potential features regarding several landscape function indicators should provide landscape managers with a method for diagnosing actual landscape struc- tures and for exploring improved solutions based on quantitative assessments, such as those presented in Fig. 6. In addition, this study should be communicated to a wide range of people to communi- cate the modelling results, which are not frequently considered in decision making regarding landscape planning.
6. Conclusions
This paper proposed an experimental numerical approach for testing how an actual ditch network on a catchment, which is viewed as a soil conservation practice, is efficient for mitigating rill erosion regarding its costs. The costs were determined according to the density of ditches, and the rill erosion mitigation efficiency was measured at the catchment scale by aggregating stream power indices from cultivated plots. This method builds a ditch density- erosion mitigation efficiency relationship using a ditch network stochastic simulator that was specifically designed for rill erosion. In addition, this method requires a DEM, a land-use map, a map of the cultivated plot boundaries and a map of the actual ditch network and outlet locations.
Finally, this method was applied to four small and contrasting vineyard catchments located in the Languedoc vineyard in southern France. A set of 100 virtual ditch networks with various ditch densi- ties were generated on each of the four sub-catchments. The actual ditch network locations were compared to the virtual network locations based on the ditch density-erosion mitigation efficiency relationships.
Overall, the results indicated that ditch networks highly miti- gate the threat of rill erosion because the stream power index values decrease exponentially with the ditch network density. In addi- tion, the results from the four contrasted sub-catchments in this study indicated that the mitigation of rill erosion risk was obtained using minimal drainage network lengths, suggesting that the actual ditch networks resulting from historical farmers are already opti- mised. This finding is re-enforced when comparing networks at the Peyne catchment scale using the stream power index maps with a resolution of 250 m and considering or not considering the actual ditch networks. For the former map, the rill erosion mitigation effi- ciency is high (low SPI values) and homogeneous, regardless of the topography, the land-cover and the ditch network density.
The proposed approach allows users to diagnose whether the efficiency of a soil conservation technique for preventing erosion (e.g., ditch networks) can be improved. In the future, this experi- ment should be extended to others soil conservation features (e.g., terraces). A multifunctional approach should also be favored in order to take into account side-effects of these soil conservation features.
Acknowledgements
This work was partly supported by funds for a PhD the- sis provided by the region of Languedoc-Roussillon. The authors thank the Conseil Général de l’Hérault for providing the DTM data.
Appendix A. Supplementary data
Supplementary data associated with this article can be found, in the online version, at http://dx.doi.org/10.1016/j.landusepol.2015. 08.033. These data include Google maps of the most important areas described in this article.
References
Bailly, J.S., Levavasseur, F., 2012. Potential of linear features detection in a Mediter- ranean landscape from 3D VHR optical data: application to terrace walls. In: IGARSS, Munich, Germany, July 22–27, pp. 7110–7113, http://dx.doi.org/10. 1109/IGARSS.2012.6352024.
Bailly, J.S., Levavasseur, F., Lagacherie, P., December 2011. A spatial stochastic algo- rithm to reconstruct artificial drainage networks from incomplete network delineations. Int. J. Appl. Earth Obs. Geoinf. 13 (6), 853–862, http://dx.doi.org/ 10.1016/j.jag.2011.06.001, ISSN 0303-2434.
Bellin, N., van Wesemael, B., Meerkerk, A., Vanacker, V., Barbera, G.G., 2009. Abandonment of soil and water conservation structures in Mediterranean ecosystems: a case study from south east Spain. CATENA 76 (January (2)), 114–121, http://dx.doi.org/10.1016/j.catena.2008.10.002.
Bevan, A., Conolly, J., 2011. Terraced fields and Mediterranean landscape struc- ture: an analytical case study from Antikythera, Greece. Ecol. Model. 222 (7), 1303–1314, http://dx.doi.org/10.1016/j.ecolmodel.2010.12.016, ISSN 0304- 3800.
Blondel, J., 2006. The design of Mediterranean landscapes: a millennial story of humans and ecological systems during the historic period. Hum. Ecol. 34 (5), 713–729, http://dx.doi.org/10.1007/s10745-006-9030-4.
Brenning, A., 2008. Statistical geocomputing combining R and SAGA: the example of landslide susceptibility analysis with generalized additive models. In: Boehner, J., Blaschke, T., Montanarella, L. (Eds.), SAGA – Seconds Out (= Hamburger Beitraege zur Physischen Geographie und Landschaftsoekologie, vol. 19). , pp. 23–32.
Buchanan, B.P., Falbo, K., Schneider, R.L., Easton, Z.M., Walter, M.T., 2013. Hydrologi- cal impact of roadside ditches in an agricultural watershed in central New York: implications for non-point source pollutant transport. Hydrol. Process. 27 (17), 24372422, http://dx.doi.org/10.1002/hyp.9305.
Chahinian, N., 2004. Paramétrisation multi-critère et multi-échelle d’un modèle hydrologique spatialisé de crue en milieu agricole (Ph.D. thesis). Université Montpellier II.
Dages, C., Voltz, M., Bsaibes, A., Prévot, L., Huttel, O., Louchart, X., Garnier, F., Negro, S., 2009. Estimating the role of a ditch network in groundwater recharge in a Mediterranean catchment using a water balance approach. J. Hydrol. 375 (3), 498–512, http://dx.doi.org/10.1016/j.jhydrol.2009.07.002.
Douglas, T., Critchley, D., Park, G., 1996. The deintensification of terraced agricultural land near Trevelez, Sierra Nevada, Spain. Glob. Ecol. Biogeogr. Lett. 25, 8–270. Elliot, W.J., Tysdal, L.M., 1999. Understanding and reducing erosion from insloping
roads. J. For. 97 (8), 30–34.
Gardner, R.A.M., Gerrard, A.J., 2003. Runoff and soil erosion on cultivated rainfed terraces in the middle hills of Nepal. Appl. Geogr. 23 (January (1)), 23–45, http:// dx.doi.org/10.1016/S0143-6228(02)00069-3.
Gumiere, S., Bailly, J.S., Cheviron, B., Raclot, D., Le Bissonnais, Y., Rousseau, A., 2015. Evaluating the impact of the spatial distribution of land management practices on water erosion: case study of a Mediterranean catchment. J. Hydrol. Eng. 20 (6), C5014004, http://dx.doi.org/10.1061/(ASCE)HE.1943-5584.0001076, ISSN 1084-0699.
Gumiere, S.J., Raclot, D., Cheviron, B., Davy, G., Louchart, X., Fabre, J.C., Moussa, R., Le Bissonnais, Y., 2011. MHYDAS-Erosion: a distributed single-storm water erosion
model for agricultural catchments. Hydrol. Process. 25 (11), 1717–1728, http:// dx.doi.org/10.1002/hyp.7931.
Herzon, I., Helenius, J., 2008. Agricultural drainage ditches, their biological impor- tance and functioning. Biol. Conserv. 141 (5), 1171–1183, http://dx.doi.org/10. 1016/j.biocon.2008.03.005.
Hessel, R., Tenge, A., 2008. A pragmatic approach to modelling soil and water conser- vation measures with a catchment scale erosion model. CATENA 74 (2), 119–126, http://dx.doi.org/10.1016/j.catena.2008.03.018.
Levavasseur, F., 2012. Structure du paysage et fonctionnement hydrologique. Appli- cation aux réseaux de fossés en zone viticole méditerranéenne (Ph.D. thesis). Montpellier Supagro – École Doctorale SIBAGHE.
Levavasseur, F., Bailly, J.S., Lagacherie, P., Colin, F., Rabotin, M., 2012. Simulating the effects of spatial configurations of agricultural ditch drainage networks on sur- face runoff from agricultural catchments. Hydrol. Process. 16 (22), 3393–3404, http://dx.doi.org/10.1002/hyp.8422.
Levavasseur, F., Lagacherie, P., Bailly, J.S., Biarnès, A., Colin, F., 2014. Spatial modeling of man-made drainage density of agricultural landscapes. J. Land Use Sci., http:// dx.doi.org/10.1080/1747423X.2014.884644.
Martnez-Casasnovas, J.A., Ramos, M.C., 2006. The cost of soil erosion in vineyard fields in the Penedès – Anoia region (NE Spain). CATENA 68 (23), 194–199, http:// dx.doi.org/10.1016/j.catena.2006.04.007.
Moore, I.D., Grayson, R.B., Ladson, A.R., 1991. Digital terrain modelling: a review of hydrological, geomorphological, and biological applications. Hydrol. Process. 5 (1), 330, http://dx.doi.org/10.1002/hyp.3360050103.
Morgan, R.P.C., Quinton, J.N., Smith, R.E., Govers, G., Poesen, J.W.A., Auerswald, K., Chisci, G., Torri, D., Styczen, M.E., 1998. The European soil erosion model (EUROSEM): a dynamic approach for predicting sediment transport from fields and small catchments. Earth Surf. Process. Landf. 23 (6), 527544, http://dx.doi. org/10.1002/(SICI)1096-9837(199806)23:6<527::AID-ESP868>3.0.CO;2-5. Moussa, R., Voltz, M., Andrieux, P., 2002. Effects of the spatial organization of agricul-
tural management on the hydrological behaviour of a farmed catchment during flood events. Hydrol. Process. 16 (2), 393–412, http://dx.doi.org/10.1002/hyp. 333.
Nasri, S., 2007. Caractéristiques et impacts hydrologiques de banquettes en cascade sur un versant semi-aride en Tunisie centrale/characteristics and hydrological impacts of a cascade of bench terraces on a semi-arid hillslope in central Tunisia. Hydrol. Sci. J. 52 (6), 1134–1145, http://dx.doi.org/10.1623/hysj.52.6.1134, ISSN 0262-6667.
Paroissien, J.B., Lagacherie, P., Le Bissonnais, Y., 2010. A regional-scale study of multi-decennial erosion of vineyard fields using vine-stock unearthing–burying measurements. CATENA 82 (September (3)), 159–168, http://dx.doi.org/10. 1016/j.catena.2010.06.002.
Petanidou, T., Kizos, T., Soulakellis, N., 2008. Socioeconomic dimensions of changes in the agricultural landscape of the Mediterranean basin: a case study of the abandonment of cultivation terraces on Nisyros Island, Greece. Environ. Manage. 41 (2), 250–266, http://dx.doi.org/10.1007/s00267-007-9054-6.
Ramos, M.C., Porta, J., 1997. Analysis of design criteria for vineyard terraces in the Mediterranean area of north east Spain. Soil Technol. 10 (2), 155–166, http://dx. doi.org/10.1016/S0933-3630(96)00006-2.
Roose, E., Sabir, M., 2002. Stratégies traditionnelles de conservation de leau et des sols dans le bassin méditerranéen: classification en vue dun usage renouvellé. Bull. Réseau Eros. 3, 3–44.
Saunders, W., 1999. Preparation of DEMs for Use in Environmental Modeling Anal- ysis. San Diego, California.
Stanchi, S., Freppaz, M., Agnelli, A., Reinsch, T., Zanini, E., 2012. Properties, best man- agement practices and conservation of terraced soils in southern Europe (from Mediterranean areas to the Alps): a review. Quat. Int. 265, 90–100, http://dx.doi. org/10.1016/j.quaint.2011.09.015.
Stehle, S., Elsaesser, D., Gregoire, C., Imfeld, G., Niehaus, E., Passeport, E., Payraudeau, S., Schäfer, R.B., Tournebize, J., Schulz, R., 2011. Pesticide risk mitigation by veg- etated treatment systems: a meta-analysis. J. Environ. Qual. 40 (4), 1068–1080, http://dx.doi.org/10.2134/jeq2010.0510.
Tarolli, P., Preti, F., Romano, N., 2014. Terraced landscapes: from an old best practice to a potential hazard for soil degradation due to land abandonment. Anthro- pocene 6, 10–25, http://dx.doi.org/10.1016/j.ancene.2014.03.002.
Tarolli, P., Sofia, G., Calligaro, S., Prosdocimi, M., Preti, F., Dalla Fontana, G., 2015. Vineyards in terraced landscapes: new opportunities from LiDAR data. Land Degrad. Dev. 26 (January (1)), 92–102, http://dx.doi.org/10.1002/ldr.2311, ISSN 1099-145X.
Termorshuizen, J.W., Opdam, P., 2009. Landscape services as a bridge between land- scape ecology and sustainable development. Landsc. Ecol. 24 (8), 1037–1052, http://dx.doi.org/10.1007/s10980-008-9314-8.
Wang, L., Liu, H., 2006. An efficient method for identifying and filling surface depres- sions in digital elevation models for hydrologic analysis and modelling. Int. J. Geogr. Inf. Sci. 20 (2), 193–213, http://dx.doi.org/10.1080/13658810500433453. Wheaton, R.Z., 2001. Terracing as a Best Management Practice for Controlling Ero- sion and Protecting Water Quality. Purdue University, Cooperative Extension Service.
Zevenbergen, L.W., Thorne, C.R., 1987. Quantitative analysis of land surface topog- raphy. Earth Surf. Process. Landf. 12 (1), 47–56.