HAL Id: cea-02339279
https://hal-cea.archives-ouvertes.fr/cea-02339279
Submitted on 14 Dec 2019HAL is a multi-disciplinary open access archive for the deposit and dissemination of sci-entific research documents, whether they are pub-lished or not. The documents may come from teaching and research institutions in France or abroad, or from public or private research centers.
L’archive ouverte pluridisciplinaire HAL, est destinée au dépôt et à la diffusion de documents scientifiques de niveau recherche, publiés ou non, émanant des établissements d’enseignement et de recherche français ou étrangers, des laboratoires publics ou privés.
Evaluation of the Steam Generator clogging phenomena
kinetics by γ-Ray counting
P. Schindler, P-G. Allinei, L. Loubet, V. Pointeau
To cite this version:
P. Schindler, P-G. Allinei, L. Loubet, V. Pointeau. Evaluation of the Steam Generator clogging phenomena kinetics by γ-Ray counting. 26th International Young Nuclear Congress 2018 and WiN Global Congress, Mar 2018, Bariloche, Argentina. �cea-02339279�
Evaluation of the Steam Generator clogging phenomena kinetics
by -Ray counting
Patricia Schindler1, Pierre Guy Allinei2, Laurent Loubet2, Veronique Pointeau1
1CEA-Nuclear Technology Department/Cadarache/STCP/LETH, 2CEA/ Nuclear Technology
Department/Cadarache/STMA/LMN F-13108 Saint Paul les Durance, France.
patricia.schindler@cea.fr
I. INTRODUCTION
Recently (2006), the clogging phenomena of the tube support plates (TSP) increased in some steam generator of French nuclear power plants. The evolution of the clogging is a long run, more than 10 years mainly located in the hot branch, the peripheral zone and the upper part of the steam generators. The first results of EDF investigation identify the pH as an important factor (Corredera G, 2008). All the TSP clogging affected plants run at target pH25°C of 9.2. In contrary most of the plants, having same type of SG and running at target pH25°C
of 9.6 seem not affected by TSP blockage.
While chemical cleaning is the main effective remedy against clogging, this method is expensive and time consuming. Thus, it seems of great interest to study an alternative solution to avoid clogging of the TSP and understand the parameters having in influence on the clogging deposits kinetics.
In order to cope to these issues and determine the parameters having an influence on the clogging deposits, EDF and the CEA launched since 2007 an R & D collaborative program. To carry out this experimental program, a representative test loop co-financed by EDF1 and the CEA2 was designed, built and specifically instrumented, to identify on line, the local parameters (thermohydraulic and chemical parameters) supposed to influence the very first steps of clogging. The three thermohydraulic loops which composed the experimental tests facility aim to reproduce, in a scale SG mock-up, the two-phase flow thermal hydraulic conditions met in the secondary side of a SG at the upper TSP level (277°C, 61 bars, and void fraction up to 80%).
The clogging deposits are mainly composed of magnetite (Fe3O4). With tracer injection (59Fe), -Ray emitter,
a nondestructive estimation of the deposit rates and a measure of the kinetics of deposition becomes possible on line at nominal conditions. This experimental phase begins in 2018 and focuses on radioactive tracing
1 EDF : Electricity of France
(59Fe) associated to on-line γ counting. The planned program must determine in situ, on the deposit of the SG mockup, the pH conditioning influence.
This measurement technique are widely used on CEA tests facilities, for over 30 years. First, in a two-phase liquid/vapor flow environment, to study the sodium hideout and hideout-return in the confined areas of the Steam Generator (Schindler P, 1995 August 7-10). Second, in monophasic phase flow, representative of the primary side of a PWR, to determine the contamination transfers (Blet V, 2007). CIRENE loop is one of the out-of-pile loops dedicated to the study of activated corrosion product deposits on the surfaces of the core and the steam generator (SG).
However, this is the first time this technique is used in such an environment. Due to the lack of knowledge of the instantaneous effects of the studied parameters, measurement remains a challenge with regard to modeling, measurement methods and sizing. The deposit develops in the quatrefoils, in the area between the tube and the tube support plate. The tube support plate (TSP) has a complex and massive geometry with respect to the quantity and position of the 59Fe incorporated in the deposit. For this reason, the SG mock-up environment required specific equipment.
The implementation of this type of measurement leads to a precise dimensioning of the instrumentation and associated devices. The modeling combines the 3MCNPIV code and the 4MercureV code to converge towards the most appropriate measurement configuration by associating the γ spectrometer best suited to this type of measurement.
II. CONTEXT OF THE STUDY
Clogging deposit is located at the inlet of the hole of the quatrefoils of broach tubes. This deposit develops perpendicularly to the tube or the Tube Support Plate (TSP) and forms a characteristic lipping form, which progressively reduces the hole’s section of the quatrefoils (see Figure 1).At least, two phenomena, flashing and veina contracta (Rummens H.E, 1999) (Rummens H.E, 2004), describe the formation of this lipping form. Then the secondary flow reaches the TSP, it undergoes a sudden contraction at the entrance of the foils, which causes its acceleration as well as a sudden loss of pressure. In addition, at the entrance of the foils, the main stream separates from the wall after this brutal contraction. The low velocity recirculation zone created along the wall promotes the trapping of particles. (Rummens H.E, 2004). In addition, this sudden contraction induces local vaporization (flashing) (Prusek T, 2013) which cause precipitation of soluble species. Therefore, the deposit is the result of two processes, the precipitation of soluble species at the wall, associated with the impact
3 MCNP : Monte Carlo N-Particule Transport Code
of particles formed in situ by precipitation, and particles resulting from corrosion of surfaces upstream and transported at the wall (Pointeau V, 2014).
Figure 1: Clogging phenomena in PWR’s SG (EDF source)
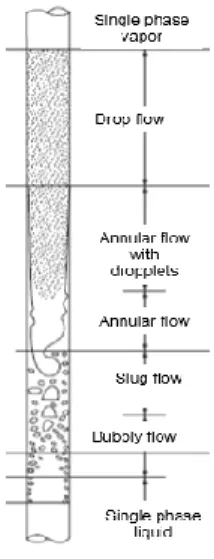
The foils of the upper tubes support plates, hot leg side and placed in the peripheral areas are considered as the most clogged. For this reason, the thermohydraulic conditions of the COLENTEC tests are preferentially representative of this zone of the steam generator. The fluid at the top of the tube bundle of the steam generator is a two-phase liquid / vapor flow, 277 °C, 61 bar, and a void fraction of up to 80%. We can therefore assume that a dispersed droplets pattern arrives at the 8th TSP (see Figure 3).
The first results of EDF investigation identify the pH as an important factor (Corredera G, 2008). All the TSP clogging affected plants run at target pH25°C of 9.2. In contrary most of the plants having same type of SG and running at target pH25°C 9.6 seem not affected by TSP blockage.
The clogging deposits are mainly composed of magnetite (Fe3O4). With tracer injection (59Fe), -Ray emitter, a nondestructive estimation of the deposit rates and a measure of the kinetics of deposition become possible on line at nominal conditions. The in-situ technique, which combines γ-spectrometry and radioactive tracing technique, has been widely used for more than 30 years in the CEA tests facilities. First, to measure the hideout and hideout return of sodium (Na) in the confined area of SG mockups ( (Brunet JP, 1987 july), ( (Schindler P, 1995 August 7-10). The tests performed under two-phase flow liquid/vapor conditions were representative of
the secondary conditions of the PWR steam generator. More recently, tests under conditions representative of the primary side of the PWR have helped to understand the transfers of contamination (Blet V, 2007).
In the case of Colentec tests, the 59Fe will allow powerful parametric sensitivity analyzes to access the impact of chemistry and thermo-hydraulic parameters on the clogging phenomenon and to have the answer of this influence online. However, this is the first time this technique has been used in such an environment and it remains a challenge.
III. COLENTEC: A THERMOHYDRAULIC AND CHEMICAL REPRESENTATIVE TEST FACILITY
Description of the experimental set-up
The experimental COLENTEC set-up consists of three thermal-hydraulic loops to reproduce the conditions encountered in the secondary side of a SG at the 8th level tube support plate (Schindler P, 2012). The fluid at the top of the tube bundle of the steam generator is a two-phase liquid / vapor flow, 277 °C, 61 bar, and a void fraction of up to 80%.
Figure 2: Schematic view of Colentec Tests Loop. Figure 3: Two phase flow pattern
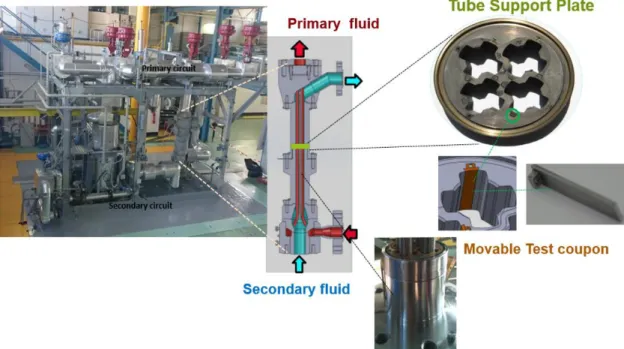
A precise description of the Colentec test set-up is given by (Schindler P, 2012). The primary circuit connects to an auxiliary boiler, which provides water at operating conditions, pressure and temperature, representative of the primary of a PWR (350°C, 155bar). This loop connects to the secondary loop by a boiler and a test section (Figure 2). The boiler placed upstream of the test section, provides the thermal-hydraulic conditions at the selected steam quality. The primary fluid, passing through the tubes of the test section, maintains a representative heat flux. A steam condenser associated to a cooler placed downstream restores the sub-nucleate
boiling conditions and a pump ensures the fluid circulation. A condensate tank, placed after the steam condenser, ensures a buffer volume. Figure 4 gives a general view of the Colentec test facility
Test section
The test section (Figure 4) is a scale mock-up of a portion of the 8th TSP. It is composed of 4-SG tubes. The TSP of the SG mockup has been designed with movable test coupons in the four quatrefoils (Schindler P, 2012), to preserve the deposits in term of mass and localization and to ensure the possibility of characterizing the deposits (Pointeau V, 2014).
The Chemical and Volume Control System
Connected at the condensate container there is a Chemical and Volume Control System (CVCS). This circuit, functioning at room temperature, measures chemical parameters (pH, Redox, O2, conductivity) adjusts the fluid
chemistry and purifies if necessary. Periodic analyzes show the evolution of iron concentration and an injection device makes it possible to adjust this concentration.
Figure 4: Colentec stet up and the SG mock up associated
IV. CIRENE AND CLARINETTE TESTS FEEDBACK
In order to determine the procedures for implementing 59Fe injections and to size γ-spectrometry techniques, we used the Cirene and Clarinette test methods carried out in 2007 (Blet V., 2007) and 1995 (Schindler P, 1995 August 7-10).
Description of Cirene test loop results
The CIRENE loop is dedicated to the study of activated corrosion products deposit on core and steam generator (SG) tubes surface areas, PWR’s primary side. Cirene loop simulates a core with four zircaloy fuel claddings representing a PWR fuel assembly geometry and a primary heat exchanger with four SG tubes. Tests reproduce the thermal-hydraulic and chemical representative conditions of a French PWR. The primary side thermal hydraulic conditions of a PWR is a monophasic liquid flow, 350°C 155 bar. Cirene 2007 tests studied the contamination transfer of corrosion products, primary side of a PWR, during nominal conditions and shutdown periods. The thermal hydraulic conditions applied favored the deposition at the upper part of the fuel assembly mock-up by sub-nucleated conditions (Blet V, 2007). The test was performed with a continuous injection at the inlet of the core section of iron and nickel solutions to be representative of the potential contamination level of a French PWR. The radioactive isotopes used for this type of tests were respectively 58Co and 59Fe. The physical half –lives of 59Fe and 58Co are respectively 44.5 days and 70.8 days. 59Fe has two -peaks, one at 1099 keV (56%) and the other at 1291 keV (44%) and 58Co only one at 811 KeV (99%). For the measured spectrum, this only 3 peaks are considered.
The use of multi-radiotracers made it possible to make assumptions about the formation of mixed oxides of nickel ferrite, simple chromite or magnetite, these species not having the same solubility temperatures. The injection tank was prepared under the same chemical conditions of the Cirene loop conditions. This radiotracer injection device has been placed downstream of the stable element injection device. The main injection rate, in terms of injected activity, is ~ 38 kBq/h including 25 kBq/h of 58Co and 12.5 kBq/h of 59Fe (see orange graph Figure 5) (Blet V, 2007). No Injection performed during the weekends. After 15 days, the injected total represents 825 kBq, 465 kBq as58Co and 360 kBq as59Fe.
The on line -measurement was performed using HP-Ge -detectors. One of the detectors was placed at the upper part of the core and a second one at the SG section inlet. The detectors were collimated by lead and the measuring set placed at 1cm of the thermal jacketing. The relationship between the detector collimator diameter and the distance to the measuring point determines the measurement angle. Under these conditions, the sensitive measurement volume corresponds to about a 25 cm height zone at each measurement locations (Blet V, 2007). The -counting was usable 2 hours after the start of the first radioactive tracer injection sequence for a counting period fixed at 3600 s.
This measurement is considered comfortably achievable because of the position of the deposit, the favorable hydraulic thermal conditions, the choice of multiple radiotracers and the volume of the loop, 50L taking into account the pressurizer of 25L, involved with respect to the flow (~ 5000 L) / h.
Figure 5 : Cirene - deposit evolution measure by γ counting ( (Blet V, 2007) Description of Clarinette test loop results
Clarinette test loop (Brunet J.P., 1987 march) was built specifically to study corrosion problems in the secondary side of the PWR' Steam generators. This loop studied the hideout and hideout return in the confined area of the PWR SG using a radio tracing technique. The program ended in 1996.
This loop was representative of the secondary side of a SG with a two-phase flow liquid/vapor. The first radioisotope used was 24Na (Brunet JP, 1987 march) (Brunet JP, 1987 july) then 22Na (Schindler P, 1995 August 7-10). 24Na has a half-life time of 15 hours, a single -peak at 1330 KeV. 22Na has a half-life time of 2.6 years
and a single peak at 1275 KeV. The use of 22Na offers a longer test period with a lower stable Na concentration. Therefore, hideout kinetics is more accurate.
The tests were performed with a 22Na volume activity established at 37 KBq/h. The Na/22Na (µg/Bq) ratio remains constant and monitored by regular secondary fluid samples. The volume of the loop was ~ 70 L taking into account a buffer tank (50L), and the flow rate was similar to that of the Cirene test loop.
The point to be measured was the confined zone between the tube and the TSP. The relationship between the detector collimator diameter and the distance to the measuring point determines the measurement angle. The on line -counting has been performed with only one NaI detector. This detector was collimated by lead and the measuring set placed at 1cm of the thermal jacketing. Under these conditions, the sensitive measuring volume corresponds to about 2 cm height zone at the measurement location. 2cm correspond also to the
thickness of the tube support plate. These measurement conditions are close to the Colentec tests because of the position of the deposit. In this case also, -counting is usable 2 hours after the beginning of the radioactive tracer injection sequence for a counting period fixed at 3600 s.
Conclusion
The results of the Cirene and Clarinette campaigns are interesting for the projection of the Colentec test program.
Clarinette tracing techniques are very close to Colentec's conditions. The activity of Colentec's standard 59Fe source is 6.4 MBq, in the same range as that of Clarinette (10 MBq). In addition, 59Fe and 22Na are both energetic γ-Ray emitters, in a very close range. 59Fe has two peaks one at 1099 Kev (56%) and the other at
1291 Kev (44%). 22Na has a single peak at 1275 Kev. The γ-counting of Clarinette was operational two hours after the first injection sequence for an acquisition time of 3600 s. We can assume also that the background noise of the area around Colentec is very close to the Clarinette background noise, because Colentec’ loop is placed in the same area then Clarinette’ loop. We notice that the quantities of radiotracer injected will be almost the same. The choice of the Ray-detectors is different, a NaI scintillator detector for Clarinette and a High Purity Germanium semi-conductor for Colentec. In clarinette’ tests, only 24 hours (1 day) are needed to determine the kinetics of sodium sequestration, because we already know the kinetics, deduced from previous tests.
In the Cirene test, the interesting point is the change in pH condition, which is the goal of the Colentec test program. Each phase of the test has a minimum duration of 4 days. The graph shows that the kinetics of deposition according to the conditions is perceptible on 1 day but that it becomes quantifiable over 2 or 3 days. As the change in chemistry and pH occurred after 8 days (phase 3), then the repercussion on kinetics deposition is measurable in a day.
In summary, if each test phase with a change in pH condition is programmed every 24 hours, to sign the kinetic variation, it will be important to obtain in situ kinetics for the reference pH. In addition, of course it will be necessary to have a sufficiently large signal in the tube support plate.
MEASURE OF THE CLOGGING PHENOMENA KINETICS
59Fe choice
The deposits are mainly composed of magnetite (Fe3O4), the -tracing consists in labeling the 56Fe by 59Fe so
radioactive isotopes have the same electronic configuration, so the identical physical and chemical properties. The only isotopic effect is the mass difference. This effect could affect the kinetics of the chemical reactions, but between 56Fe and 59Fe the difference mass is less than 5%. Moreover, the amount of 59Fe involved is negligible compared to the stable 56Fe. The saturation concentration of iron in the secondary fluid under the test conditions is 5.6 μg/L. The activity of 59Fe is 1.81015 Bq/g and the activity of the standard source 6.4 106Bq
that corresponds to 3.6 ng of 59Fe.
In the Colentec tests, it is necessary to selectively measure low levels of 59Fe activities in a radioactive
environment.59Fe is an energetic γ-Ray emitter. It has 2 peaks above 1 Mev, one at 1099 keV (56%) and the
other at 1291 keV (44%) that are detected by γ-spectrometry at very low concentrations.
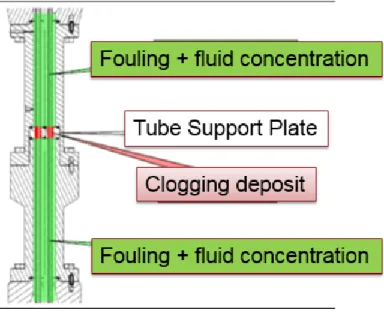
Then, to carry out a precise measurement in the deposition zone, it is necessary to be able to discern the deposited activity, the activity due to fluid and the fouling deposits (Figure 6). The validity of the measurement relies also on the focusing in a specific area, placed at the center of the TSP, to be representative of the heat flux of the 4 tubes. In short, to measure the impact of the studied parameters (chemistry or thermohydraulic) on the kinetic of clogging deposits, the active environment must not hide a local increase or decrease of 59Fe in the TSP.
The activity of testing hall should be naturally very low (40K potassium peak is above 1400 keV).
V. SIZING OF THE GAMMA SYSTEM AT THE TSP LEVEL
Gamma Spectrometry selection (Allinei PG, 2011)
The detection efficiency makes it possible to connect the peak area observed on the γ-ray spectrum with the corresponding activity of radioelement 59Fe. This depends of the energy of the γ-Ray radiation, its attenuation in the measured area, the type of detector selected and its useful volume.
The physical parameters (geometry, detector size, shielding) have been optimized to ensure maximum detection sensitivity and optimal measurement of the deposition area. Due to the general environment, a low activity of 59Fe present in the lobes with respect to the thickness of the TSP and the amount of 59Fe present in the secondary fluid, the γ measurement of 59Fe required a high degree of accuracy in sizing. It was therefore necessary to choose a detector capable of measuring then selectively locating low levels of 59Fe activity in this specific environment. This requires detectors family equipped with a large volume crystal (high sensitivity criterion). Two families of detectors are suitable:
1) The scintillators family based on a crystal associated with a photomultiplier. In addition, in this family two types of crystals are suitable for these measurements: LaBr3 and NaI.
2) The semiconductor family using a high purity germanium crystal (HP-Ge). The evaluation criterion used to select the detector was to obtain the lowest detection limit for 59Fe emission line energies (1099 and 1291 KeV). This type of detector works if the crystal (HP-Ge) is maintained at liquid nitrogen temperature (~ -195 ° C). The nitrogen tank requires regular filling. Since this constraint has repercussions in test management, it was taken into account when analyzing choices.
Back ground noise modeling
Realistic and specific modeling of this area was performed to determine the most appropriate -Ray spectrometer. Modeling of the 4-tubes steam generator mock up took into account, as much as possible, the primary and secondary thermal and hydraulic design conditions. On the secondary side, the temperature the range of void fraction is up to 85% and the average density of the two-phase flow fixed at 109 kg/m3(see §. III). As an indication, the broached plate of the 4-tubes SG mockup is 3 cm tall, representative of that of the French PWR SG. The broached holes are quatrefoil forms. The pitch of the SG mockup tube is the same as the pitch of the French PWR SG’s tubes.
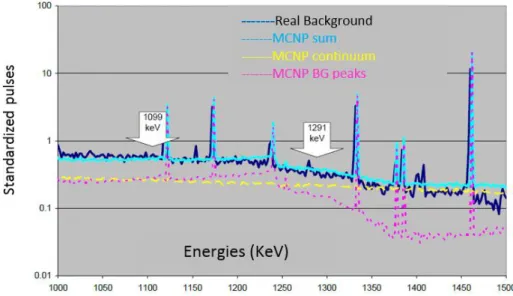
Figure 7: Background noise modeling, comparison with a real background
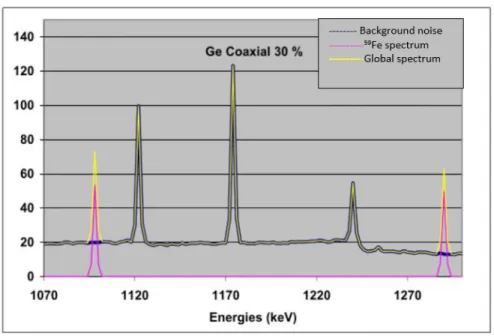
To carry out this modeling, we used the feedback coming from Cirene gamma counting techniques. The counting rate obtained for a 30% coaxial germanium detector inserted in a lead collimator is 20 c/s in the 20-2000 Kev range.
The first step of the study is to determine a natural and reliable background modeling of the detector environment (Figure 7). It is numerically determined with the MCNPIV code simulating the transport of X-rays and gamma photons. Modeling provides a spectrum very close to the measured spectrum.
This spectral distribution of the background noise is placed in the modeling of this detector. The simulated count rate is in these conditions of 1.9 10-2 c/s. In this way, we obtain the normalization coefficient that links the simulation to the actual count.
Two detectors are selected a NaI and a Ge-HP. The comparison of the detector performances requires to express the detection limits in Bq instead of c/s. The second step consists of modeling the 4-tubes SG mock up with the MERCUREV code (Figure 8), and then calculating the efficiency of the γ-detector with the MCNPIV.
For an activity of 1Bq/cm3, the modelling shows that with a HP-Ge crystal the peaks of 59Fe are visible, for a realistic counting time of 1200 s (see Figure 8). The selected detector is the detector with a High Purity Germanium monocrystal (HP-Ge). This detector is characterized by an excellent energy resolution, and during the Colentec tests, other phenomena will surely degrade the performance of the detector.
The atmosphere around the detector is 40°C and the need to ensure a thermal regulation of the NaI makes its use as complex as the use of a detector Ge cooled by liquid nitrogen.
Figure 8 : 59Fe in the global spectrum with 1Bq/cm3-Comparison between NaI and HP-Ge Detector
Detection threshold
These calculations are based on the conventional detection threshold (SD) formula:
𝑆𝐷(𝑠−1) = 4.4 ∗ √1 + 𝑅 ∗ 𝐵
𝑡 𝐿𝐷(𝐵𝑞/𝑐𝑚
3) = 2 ∗ 𝑆𝐷
𝐼𝑔𝑎𝑚𝑚𝑎 ∗ 𝐸𝑓𝑓𝑖𝑐𝑖𝑒𝑛𝑐𝑦
R: peak width at half-height, B: average background radiation on the area surrounding the peak, t: acquisition time. I gamma: intensity of 59Fe peak at the considered energy; Efficiency: counts per second in the peak for 1 photons/s/ cm3 emitted by the 59Fe source.
Table1 presents the results of the modeling, the detection thresholds are calculated for an acquisition time of 1200 s. These results indicate that the Ge is much more efficient in terms of the detection threshold. For an activity corresponding to the limit of detection, the peaks are perfectly identifiable and measurable. Figure 9
gives the 59 Fe global spectrum with 13 Bq/cm3.
59FePeak (keV) Detection threshold (s-1) Gamma emission (%) Efficiency (c/s pour 1 Bq/cm3) Detection Limit (Bq/cm3)
Ge coaxial 30% (selection modeling )
1099 2,53 10-2 56% 6,92 10-3 13,06 1291 2,1 10-2 44% 6,65 10-3 14,37
NaI 3 x 3 inch (selection modeling)
1099 2,53 10-2 56% 2,39 10-2 25,63
1291 2,1 10-2 44% 2,34 10-2 27,48 Table 1: Comparison of detection thresholds of Ge and NaI detectors (Tc 1200s)
Figure 9: 59Fe Spectrum in the global Spectrum with 13 Bq/cm3
Sizing of the radiation protection systems
The third step is to demonstrate the ability to locate a zone. The results of the MERCUREV calculations have shown that it is necessary to protect the area around the Tube Support Plate. To discriminate the signal due to the deposit, the SG mock up is inserted into a tungsten screen (
Figure 10a). To measure specifically the central area, it is necessary to adjust and then increase the thickness of the protection system on both sides of the measured area (see
Figure 10b) for a better signal-to-noise ratio. A tungsten collimator, with a single opening is around the TSP zone, the opening in the TSP axis. In addition, a lead collimator protects the -Ray detector. In this context, the detection threshold of HP-Ge increases to 58 Bq/cm3. The main objective of the study is to detect and measure the deposits in the central area, due to the representativeness of the thermal flux in this zone (see Figure 11).
The thickness of the different protection systems results of the materials, tungsten having a higher density than lead. At 20°C lead has a density of 11.35 g/cm3 and a melting point of 327 ° C compared to tungsten, which has a density of 19.3 g/cm3, a melting temperature of 3420°C and its coefficient of thermal expansion is very low.
Figure 10: Sizing of the tungsten screen at the TSP level
Figure 11: On line -counting at the SG mock up level.
Detector positioning
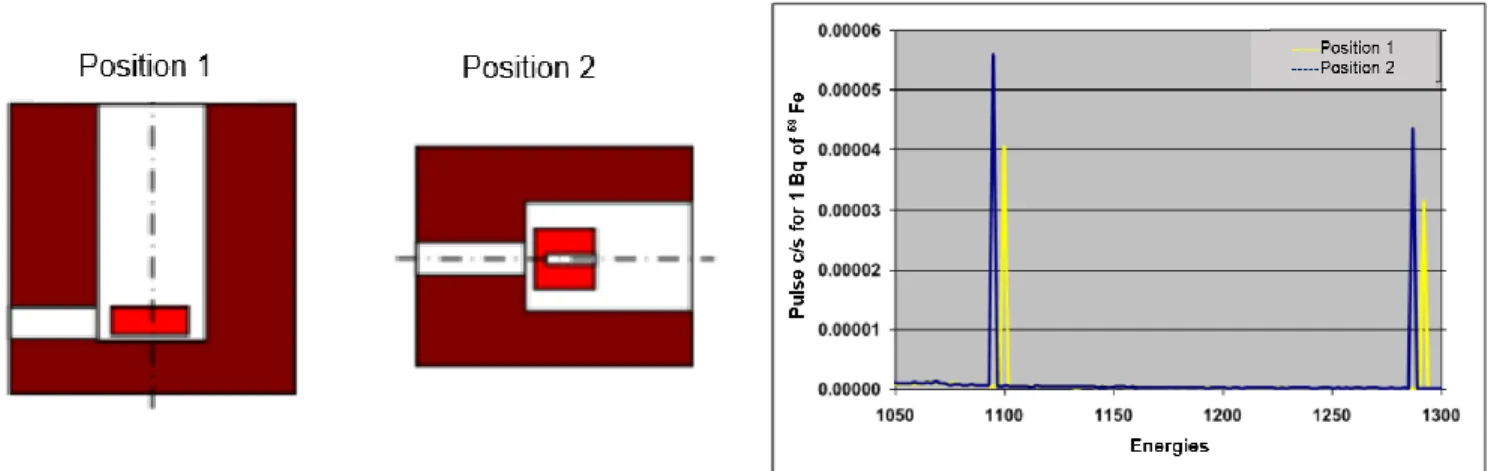
Two types of positioning are compared using MCNP code in order to determine the most efficient detection. The first detector, diameter 7cm, thickness 2.5cm, is inserted in a vertical collimator. The second germanium detector, diameter 5.5cm, length 5.5cm is inserted in a horizontal collimator.
The answer of the two types of semiconductor detectors is compared using the MCNP code (Figure 12). The goal is to determine which detector and positioning gives the best detection. To facilitate the reading of the Figure 13, the traces have been shifted. The detector inserted in a vertical collimator gives the most efficient
signal. Of course, this type of configuration, partially hidden crystal, will require a specific experimental and numerical calibration phase.
Figure 12 : Study of the -Ray detector positioning Figure 13 : Comparison of the results Deposit measurement and evolution perspectives
The fourth step is the ability to measure the evolution of activity in each lobe. It can provide additional data to understand and analyze the deposit formation mechanisms. For example, the outer lobes are not submitted to the same heat flux as the inner lobes. The influence of the heat flux could be measured on line with variated focus positions of the measurement. To obtain a measurement of each lobe, the mapping of the signal emitted by the TSP lobes was carried out by modeling. Figure 14 shows the efficiency variation of a quatrefoil for a simple rotation of the measuring system. As expected the lobe with the best measurement is the outer lobe (blue line Figure 14). The shape of the responses of the four lobes being quite similar, the result of the modeling confirms that it is not be trivial to follow on line the distribution in the 16 lobes. Such a complex distribution of activity cannot be simply determined by rotations of a measurement system around the test section. This option requires an adaptation of the measurement system, associated with a modeling reconstituting the measure by lobe. The measuring system and the data analysis associated will progressively evolve according to the first tests results.
The use of a collimator with reduced opening should allow better selectivity of the lobes (Figure 15). However, this type of collimator involves a significant reduction of photon flux detected. Its precise characteristics will be determined after the first tests. The intensity of the photon beam arriving at the detector will be known, as will the minimum aperture of the collimator compatible with realistic time measurements. An adaptation of the collimator detector will be facilitated by the change of its front part.
Figure 14: Efficiency of the-Ray detector as a
function of the measured zone Figure 15 : Collimator with reduced opening
VI. MEASUREMENT CONFIGURATION
Detectors position
The complete measurement equipment includes a γ-detector 1, placed at the TSP level, a γ-detector 2 placed upstream the SG mockup and downstream of the boiler at a pipe section level, a γ-detector 3 inserted in a low background noise shielding measuring the 50 mL fluid samples.
A lifting table raises the detector 1 (Figure 16) inserted in its collimator at the TSP level. A horizontal movement system adjusts the position of this detector. The detector 2, type 1 detector, installed in front of a pipe section (ND 80, length 80cm) upstream of the test section and downstream of the boiler, tracks in line the volume activity of the fluid. A highly efficient detector 3, placed in a very low background noise castle ensures the measurement of the volume activity of the fluid.This measurement enables the determination of the signal emitted by the fixed deposits on the TSP walls whatever the thermal-hydraulics and chemical functioning regime of the loop. Figure 16 shows the detectors implantation without the thermal jacketing.
At the start of the test campaign, liquid phase sampling is required to compare on-line measurement and fluid activity. During the test campaign, periodic samples check the evolution of the 59Fe/56Fe (Bq/μg) ratio. The volumes of 50 ml of secondary fluid are collected on a CVCS sampling line. The iron concentration is monitored by a UV spectrophotometry. At the same time, radiochemical analyzes of secondary water samples verify the instantaneous mass balances.
Figure 16: Measurement configuration
Injection systems
There are 3 points of injection (Figure 17) in the secondary circuit. The first one I1 is placed at the boiler inlet (temperature: 270°C – liquid water), the second one I2 at the SG mockup inlet (temperature: 277°C – two-phase flow), and I3 in the test section upstream the TSP. Two types of injections are possible, soluble species
or particle species, associated or not with its isotope 59Fe. The injections of iron determine the concentration
of soluble and particles species during the phase tests. The two-injection systems 56Fe and 59Fe are prepared and connected to the test loop.
The injection devices (Figure 18) consist of 8 liters ‘tank (useful volume 6l), made of stainless steel for 56Fe device, and polypropylene for 59Fe device. These are equipped with a level sensor, various tubes connected to circuits: nitrogen bubbling, nitrogen blanket, vent, and pump. The injection is carried out using a metering pump "high pressure", with a flow range from 0 to 40 ml/mn.
Figure 18: Injection devices
VII. DESCRIPTION OF THE COLENTEC TESTS
The next Colentec’ test aims to determine the influence of pH on the kinetics of clogging deposition. During the test, the secondary fluid conditioning will be representative of secondary fluid of the French PWR’SG.All pipes and components of the secondary loop are made of stainless steel (AISI 316), with the exception of the carbon steel boiler, which is supposed to provide a part of iron source term. Therefore, the total iron concentration is monitored by measuring CVCS samples by UV-spectrophotometry5. These results are verified by ICP-MA6spectrometry, performed by an accredited laboratory.
A magnetite solution is prepared in an injection tank and iron is injected when the measurement of the CVCS samples indicates a decrease in the iron concentration in the fluid. The iron injection rate is calculated to maintain the correct concentration.
5 UV : Ultraviolet–visible spectrophotometry
The injection of the 59Fe radioisotope occurs only when the thermohydraulic and chemical operating conditions are stable. The selected injection point is I2 placed at the SG mockup inlet.
The standard source activity is 6,4 MBq. It is diluted in a 6L tank. The initial injection rate is 14 KBq/h. During this test, all detectors are used. This includes the γ-detector1, placed at the TSP level to measure the signal of clogging deposits, the detector 2 placed at a pipe section to measure the fluid activity, and the γ-detector 3 inserted into a low background noise shielding for measuring the 50 ml CVCS samples an check the secondary fluid mass balance.
The 59Fe fluid activity is also monitored by measuring the CVCS samples by γ-counting. The two types of measurements implemented simultaneously, allow comparison between the offline measurements (50 mL CVCS samples) and the online measurement and then evaluate deposits at the walls. On other hand, the CVCS samples monitor the ratio 59Fe activity A(Bq/l) and 56Fe concentration C(μg/l).
During the test, the on-line γ-counting gives an indication of the deposit evolution. This raw signal is calculated taking into account the active period of the radiotracer. At the end of the test, the modelling techniques with MCNPIV and MercureV allows extracting the results of the clogging deposit only.
After a first adjustment test, the next step will be a signal processing performed online.
VIII. CONCLUSION AND PROSPECTS
The use of 59Fe as 56Fe a radiotracer is very advantageous, even if this type of measure requires precise modeling, because of the position of the clogging deposit at the wall just at the inlet of the flow hole of the tube support plate. In addition, the activity of the standard source 59Fe chosen to be handled in a ventilated chemical hood, is relatively low.
The perspectives are important and very useful for the Colentec program to follow the deposit and to determine online the influence of the various parameters having an impact on the clogging phenomenon and to check the hypotheses of the formation and the evolution of the clogging.
The deposit kinetics are accessible and in this way the impact of thermal hydraulic and chemical parameters.
59Fe can be only associated with soluble species to determine their effects on the formation and evolution of
clogging, or only associated with particle species to determine their contribution in the representability of the clogging deposit. The size of the particles involved in the phenomenon can be also studied. In this case, the injection point will be placed at the entrance of the SG mock-up to minimize the trapping effect of the particles by the boiler.
The γ-detectors and the area to be measured require specific protections. In addition, the position of the detectors requires specific adjustments. This is the only way to measure the kinetics of the deposit with sufficient precision. The MCNPIV and MercureV are the tools for sizing the measurement configuration, but also the tools for expressing the results, isolating the clogging deposition signal from the ambient noise signal. Tests with radioactive radionuclides require careful planning to match steady-state nominal conditions with the delivery date of the source. Test management is also tricky because HP-Ge detectors require regular nitrogen filling. The initiation of this type of tests using radiotracers is time consuming. The sizing and development phases must be precise and require constant adjustments.
Nevertheless, in the end, these tests open up many opportunities to advance the understanding of clogging deposit formation and to choose the right remedies.
IX. RÉFÉRENCES
Allinei PG Dimensioning study of the measurement system associated with the Colentec loop [Report]. -
[s.l.] : Personnal communication, 2011.
Blet V, Girard M, and al In situ Deposit Measurement in The Cirene out of pile Loop [Conference] // Nuclear
Plant Chemistry. - Corée : [s.n.], 2007.
Brunet JP, Campan JL Caustic concentration in tube support plate crevices of Steam Generators [Report]. -
[s.l.] : EPRI NP-5073, 1987 march.
Brunet JP, Campan JL. Hideout og sodium salts in tubesheet crevices [Report]. - [s.l.] : EPRI NP-5265,
1987 july.
Corredera G Alves-Vieira M, De Bouvier O "Fouling and TSP blockage of steam generators on EDF fleet:
identified correlations with secondary water chemistry and planned remedies [Conference] // International Conference on Water Chemistry of Nuclear React. - Berlin : [s.n.], 2008. - Vols. september 15-18.
Pointeau V, Tevissen E, Schindler P, Yang G. and al Synthesis and Caharacterisation of magnetite deposits
on tube support plate in Colentec diphasic loop dedicated to the study of SG's clogging [Conference] // Nuclear Plant Chemistry Conference. - Brighton-England : [s.n.], 2014.
Prusek T, Moleiro E, Oukacine F, Adobes A, Jaeger M, Grandotto M Deposit modelsfortubesupportplate
flow blockageinSteamGenerators [Journal]. - [s.l.] : Nucl. Eng. Des., 2013. - p418-428. : Vol. 262.
Rummens HE, Rogers JR, Turner CW The Thermal Hydraulics of Tube Support Fouling in Nuclear Steam
Generator [Journal] // Nuclear Technology 148 (3). - 2004.- pp. 268-286.
Rummens HE The thermalhydraulics of Tube Support Fouling in Nuclear Stam Generator // PhD Thesis. -
Carlton University : [s.n.], 1999.
Schindler P, Stutzman A, Brunet JP, Campan JL,and al Effect of boric acid on Intergranular corrosion
and on Hideout Return Efficiency o fsodium in the Tube support Plate crevices [Conference] // International symposium on Environmental Degration of Niclear Systems - Water Reactor. - Breckenridge USA : [s.n.], 1995 August 7-10. - p. 339.
Schindler P ,Tevissen E,Pointeau V, Ungar A. Colentec : a new approach to investigate tube support plate
Yang G, Pointeau V, Tevissen E, Chagnes A Investigations of the Tube Support Plate (TSP) clogging
phenomenom in PWR steam genrators-understanding and priorization of tis formation mechanisms [Conference] // NURETH. - Xi'an - China : [s.n.], 2017.
Yang G, Pointeau V, Tevissen E, Chagnes A A review on clogging of recirculating Steam Generator in