HAL Id: hal-01279583
https://hal.archives-ouvertes.fr/hal-01279583
Preprint submitted on 26 Feb 2016HAL is a multi-disciplinary open access archive for the deposit and dissemination of sci-entific research documents, whether they are pub-lished or not. The documents may come from teaching and research institutions in France or abroad, or from public or private research centers.
L’archive ouverte pluridisciplinaire HAL, est destinée au dépôt et à la diffusion de documents scientifiques de niveau recherche, publiés ou non, émanant des établissements d’enseignement et de recherche français ou étrangers, des laboratoires publics ou privés.
Clustering and Turbophoresis in a Shear Flow without
Walls
Filippo de Lillo, Massimo Cencini, Stefano Musacchio, Guido Boffetta
To cite this version:
Filippo de Lillo, Massimo Cencini, Stefano Musacchio, Guido Boffetta. Clustering and Turbophoresis in a Shear Flow without Walls. 2016. �hal-01279583�
arXiv:1510.09024v2 [physics.flu-dyn] 24 Feb 2016
Clustering and Turbophoresis in a Shear Flow without Walls
Filippo De Lillo,1,a) Massimo Cencini,2 Stefano Musacchio,3 and Guido Boffetta1 1)Dipartimento di Fisica and INFN, Universit`a di Torino, via P. Giuria 1,
10125 Torino, Italy
2)Istituto dei Sistemi Complessi, Consiglio Nazionale delle Ricerche,
via dei Taurini 19, 00185 Rome, Italy
3)Universit´e Nice Sophia Antipolis, CNRS, Laboratoire J. A. Dieudonn´e,
UMR 7351, 06100 Nice, France
We investigate the spatial distribution of inertial particles suspended in the bulk of a turbulent inhomogeneous flow. By means of direct numerical simulations of par-ticle trajectories transported by the turbulent Kolmogorov flow, we study large and small scale mechanisms inducing inhomogeneities in the distribution of heavy parti-cles. We discuss turbophoresis both for large and weak inertia, providing heuristic arguments for the functional form of the particle density profile. In particular, we argue and numerically confirm that the turbophoretic effect is maximal for parti-cles of intermediate inertia. Our results indicate that small-scale fractal clustering and turbophoresis peak in different ranges in the particles’ Stokes number and the separation of the two peaks increases with the flow’s Reynolds number.
PACS numbers: 47.27.-i, 05.45.-a
I. INTRODUCTION
Turbulent aerosols, dilute solutions of solid particles transported by turbulent flows, are important to the environment and to industry. From combustion processes in coal fire burners, to the dynamics of droplets in clouds, turbulent aerosols impact on our life and the earth’s climate1,2. One general feature of turbulent aerosols is their ‘unmixing’
while transported by the flow, which is relevant to several processes including: warm-rain initiation3,4, planetesimal formation in the early solar system5–7, chemical reactions and
in-dustrial processes8,9. In recent years much attention has been gathered by the dissipative
dynamics resulting from particle inertia which can induce small-scale fractal clustering also in homogeneous flows3,4,10–13. This can have relevant consequences for the rate of collision,
coalescence and reaction of particles. Another well known unmixing mechanism in tur-bulent aerosols is turbophoresis: inertial particles migrating in regions of lower turtur-bulent diffusivity, similarly to thermophoresis14, for which Brownian particles are subject to an
effective drift opposite temperature gradients. Turbophoresis has been mostly studied in presence of boundaries, because as a mechanism for particle deposition in turbulent bound-ary layers15,16 it finds applications both for industrial processes (for removing submicron sized particles from gas streams) and the environment (dry deposition in the atmosphere17).
Nonetheless, the mechanism of turbophoresis is independent of the presence of boundaries as, in principle, it only requires the presence of inhomogeneities in the flow.
In this work we investigate the phenomenology of turbophoresis in a turbulent shear flow without walls. We point out the differences between this mechanism which causes inhomogeneity at large scales and the small-scale clustering which occurs at viscous scales.
II. EQUATIONS OF MOTION AND PARAMETERS
As a paradigmatic case of inhomogeneous unbounded flow, we consider the turbulent Kolmogorov flow, obtained by sustaining the Navier-Stokes equations for the incompressible velocity field u,
∂tu+ u · ∇u = −∇p + ν∆u + F (z) , (1)
with a sinusoidal force F (z) = F0cos(z/L) ˆe1, where p is the pressure, ν the fluid kinematic
point (u = U cos(z/L) ˆe1, with U = L2F0/ν) becomes unstable above a critical Reynolds number18, Re = UL/ν > √2, and the flow eventually becomes turbulent for large Re19.
A remarkable peculiarity of monochromatic forcing is that the resulting mean velocity pro-file, hui = U cos(z/L)ˆe1, is monochromatic also in the turbulent regimes19,20. Above and in the following, the brackets h· · · i denote the average over (x, y) and over time, while f ≡ R02πLhfidz/(2πL). Due to the change of direction of the mean flow every half
wave-length, the Kolmogorov flow can be seen as an array of virtual channels flowing in alternate directions without being confined by material boundaries.
The dynamics of a small spherical particle is described by the Maxey-Riley equation21.
Here, we focus on dilute suspensions of very small particles much heavier than the fluid, whose dynamics is dominated by the Stokes drag. In this limit, the equations for the position x and velocity v of each particle simplify to
˙x = v (2)
˙v = −τ1[v − u(x, t)] (3)
where τ = (2a2ρ
p)/(9νρ) is the Stokes time, a and ρp are the particle radius and
den-sity, respectively while ρ denotes the fluid density. Eqs. (2-3) assumes a Stokes flow around the particle, implying that the particle’s Reynolds number must be very small: Rep = |v − u|a/ν ≪ 1.
Particle inertia is commonly parametrized in terms of the Stokes number St = τ /τη
based on the Kolmogorov time τη, i.e., the smallest characteristic time of a turbulent flow.
However, turbophoretic effects are expected to be determined by large-scale features of the flow, namely by the interplay between the advection and the inhomogeneities of the eddy diffusivity22. We therefore introduce a particle inertia parameter S = τ /T by normalizing
the particle response time τ with the large-scale eddy turnover time T = E/ǫ, defined as the ratio between the mean kinetic energy E and the energy dissipation rate ǫ. The parameter S is the analogous of τ+ = τ u∗2/ν, which is used in wall-bounded flows to parametrize
turbophoresis23,24 in terms of the friction velocity u∗. This amounts to measuring times in
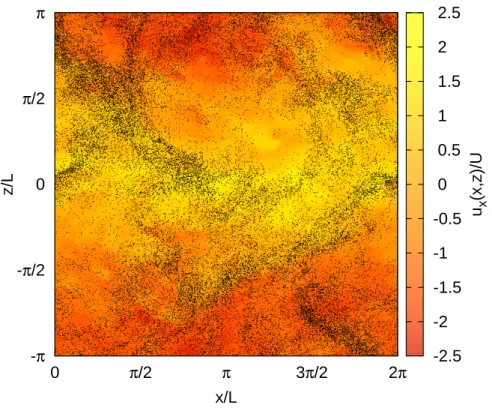
-π -π/2 0 π/2 π 0 π/2 π 3π/2 2π z/L x/L -2.5 -2 -1.5 -1 -0.5 0 0.5 1 1.5 2 2.5 ux (x,z)/U
FIG. 1. Particle distribution in a slab of thickness 2πL/10, plotted over the corresponding
stream-wise component of velocity (color map, red to yellow online). Particles inertia is S = 7.9 × 10⁻²
and Re = 990.
III. RESULTS AND DISCUSSION
A. Numerical Simulations
We performed direct numerical simulations (DNS) of Eq. (1) by means of a standard pseudospectral code with triple-periodic boundary conditions in a cubic domain of side Lx = Ly = Lz = 2π at resolution N3, with N = 128 and 256 . For each class of particles
with given inertia S, we integrated 4 · 105 trajectories according to Eqs. (2-3), with the fluid
velocity obtained by linear interpolation from grid nodes to particle positions. Eulerian and Lagrangian dynamics is integrated via a second-order Runge-Kutta scheme. DNS parameters are reported in Table I.
Large-scale inhomogeneities are clearly visible in the particle distribution in Fig. 1. To reveal the correlations of particle positions with the shear-normal structure of the flow it is necessary to consider statistically averaged quantities. Figure 2 shows typical fluid velocity and particle number-density profiles obtained by averaging over the x and y directions
N ν L F U T ǫ Re
128 1 × 10⁻³ 1.0 8 × 10⁻³ 0.23 36.3 9.31 × 10⁻⁴ 230
256 1 × 10⁻³ 1.0 1.28 × 10⁻¹ 0.99 9.36 6.41 × 10⁻² 990
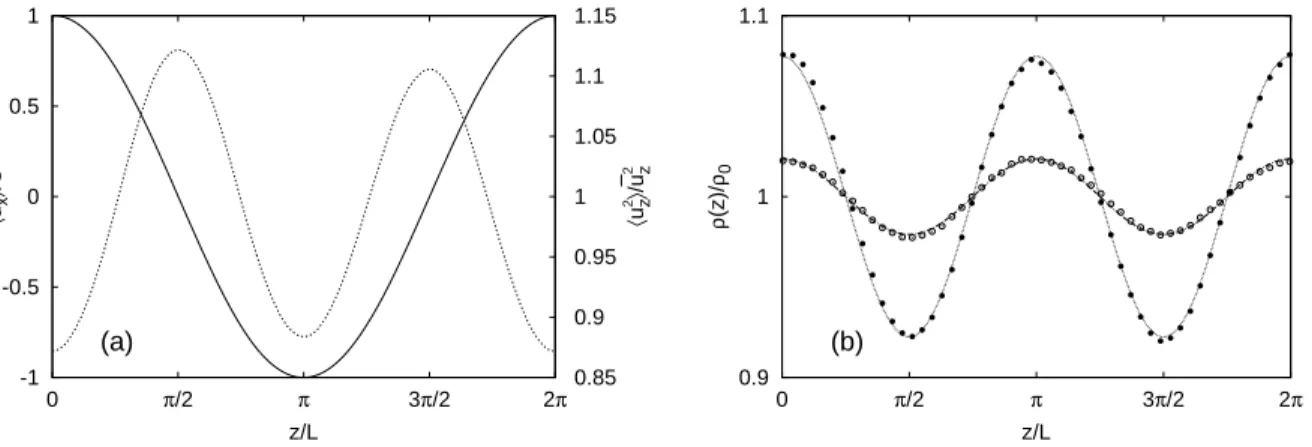
TABLE I. DNS parameters: N resolution, ν kinematic viscosity, L forcing scale, F forcing ampli-tude, U amplitude of mean velocity profile, T large-scale time, ǫ energy dissipation rate, Reynolds number Re = U L/ν. -1 -0.5 0 0.5 1 0 π/2 π 3π/2 2π 0.85 0.9 0.95 1 1.05 1.1 1.15 (a) 〈 ux 〉 /U 〈 uz 2〉/ — u2 z z/L 0.9 1 1.1 0 π/2 π 3π/2 2π (b) ρ (z)/ ρ0 z/L
FIG. 2. Fluid velocity and particle distribution profiles at Re = 990. (a) profiles of the longitudinal
velocity huxi (solid line, left axis) and the fluctuations in shear-normal kinetic energy hu2zi (dashed
line, right axis) of the flow. The small asymmetry in hu2
zi is due to the finite statistics. (b) particle
number density profiles ρ(z) for S = 7.9 × 10⁻² (filled circles) and S = 2.6 × 10⁻³ (empty circles),
compared with the functional form (4) (lines, fitted).
(normal to the shear) and over very long integration of hundreds of large-eddy-turn-over-times. The modulation of the density profiles closely reflects the structure of the mean flow: particles concentrate in the regions of maximal mean flow and minimal mean shear, away from the maxima of turbulent energy.
As it is shown in (Fig. 2), the particle density profiles are accurately fitted by:
ρ(z) = ρ0(1 + a(S) cos(2z/L)) (4)
where ρ0 = 1/Lz is the mean uniform density and the only free-parameter is a(S), which
accounts for the dependence on the particles’ inertia. In the following we discuss a heuristic argument which gives support to the empirical formula (4).
B. Turbophoresis
A common approach to derive theoretical predictions for the dynamics of inertial par-ticles is by modeling the velocity field as a Gaussian, short-correlated noise10. With this
assumption, one can write22 a Fokker-Planck equation for the probability density P (z, v)
to find a particle in z with vertical velocity v, in which turbulence is parametrized by a space-dependent eddy diffusivity κ(z) acting on velocity and derived from Eq. (3). It is then possible, in the limit of fast relaxation of the velocity distribution17,22, to obtain an equation
for the marginal distribution ρ(z) = R dvP (z, v), which reads ∂tρ(z) = ∂zJ(z), where the
flux is J(z) = ∂z[κ(z)ρ]. For the fluxless steady state one obtains the prediction ρ ∼ κ−1(z)
which, in analogy with thermophoresis25, implies that particles concentrate in the minima
of diffusivity. This behaviour is substantially different from that of a classical, passively advected scalar field θ, where the eddy-diffusivity would appear in the flux in the Fickian form J = κ(z)∂zθ, leading to a homogeneous steady state. Standard dimensional arguments
suggest that the eddy diffusivity is proportional to the mean square velocity κ(z) ∝ τchu2zi
(with τc an appropriate correlation time), so that the above result implies ρ(z) ∝ hu2zi−1.
In the case of the Kolmogorov flow, the profile of the mean square vertical velocity is found to be hu2
zi ∝ U2(1 − b cos(2z/L)), with b ≪ 1 and weakly depending on Re20. Using a
first-order Taylor expansion in b one recovers the expression (4). It is worth remarking that the above argument relies on two assumptions. First, the correlation time of the flow is set to zero. Second, the particle Stokes time τ is assumed to be small enough to justify the fast relaxation of the velocity distribution. In this limit the amplitude of the spatial modulation of the particle density profile would not depend on S, namely a(S) = b. The latter, quantitative prediction does not hold if the flow has a finite correlation time, as in our case. However, we find that Eq. (4) gives the correct shape for the density profile for particles with Stokes times both shorter and longer than the correlation time of the flow, provided that the amplitude a(S) is allowed to depend on inertia.
The analogy with thermophoresis can be exploited for particles with large inertia. In this limit, the particles can be seen as a gas in equilibrium with the turbulent environment and we can interpret the spatial variations of the mean particle vertical velocity variance, hv2
z(z)i,
as the analogous of a space-dependent temperature field17. Assuming the local diffusivity
proportional to the temperature, i.e. κ(z) ∼ hv2
expected to be ρ(z) ∝ hv2
zi−1, which is in fairly good agreement with numerical results
for large S (see Fig. 3). Moreover, we find that the particle velocity profile hv2
zi has the
same spatial dependence as the fluid one hu2
zi, but the amplitude of the spatial modulation
decreases at increasing inertia. This leads to the prediction that the amplitude a(S) in (4) is a decreasing function of the inertia for large S.
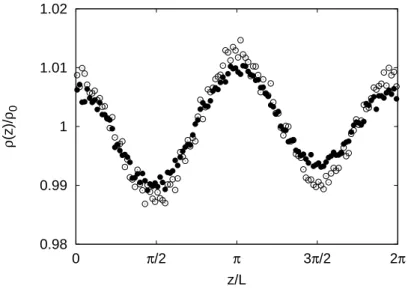
0.98 0.99 1 1.01 1.02 0 π/2 π 3π/2 2π ρ (z)/ ρ0 z/L
FIG. 3. Particle number density profiles ρ(z) for S = 4.1 (filled circles) at Re = 230. The
particle distribution is compared the prediction ρ(z)/ρ0 = hv2zi−1Lz/R0Lzhvz2i−1dz (empty circles).
Statistical fluctuations are due to the slow convergence observed for large S.
The scenario is different for particles whose Stokes time is of the order of the eddy-turn-over times in the inertial range of turbulence. Such particles are able to follow only turbulent eddies of size ℓ with a turn-over time, τℓ, longer than their Stokes time, i.e. τℓ > τ . Smaller
eddies still act as a colored noise giving raise to a space-dependent effective diffusivity responsible for turbophoresis. Conversely, eddies with τℓ > τ mix the particles almost like
tracers, thus reducing the turbophoretic accumulation. Turbophoretic unmixing is therefore enhanced as S increases, because a larger fraction of eddies contribute to it. Assuming that the profile of the effective diffusivity due to the small eddies has a monochromatic modulation one recovers the prediction (4) in which a(S) increases with S for small values of S. Hence, we expect that a(S) attains its maximum when the particle response time is of the same order of the characteristic time of the large-scale structures of the flow (S ≃ O(1)). At the heart of the arguments discussed above, there is the notion that turbophoresis
drives particles away from the maxima of turbulent energy, which correspond to maxima of the eddy diffusivity. In the case of the Kolmogorov flow, the maxima of turbulent fluctuations occur where the shear of the mean flow is maximum and the mean flow vanishes, i.e., at the borders between the virtual channels. Therefore, particles are driven toward the center of the virtual channels. This is in contrast with the case of a turbulent channel (or pipe) flow, in which turbulence is intense in the bulk and vanishes in the viscous sub-layer close to the walls. In this case turbophoresis drives the particles away from the bulk and concentrates them along the walls26–28. In this sense, the fact that turbophoresis may eventually accumulate the
particles to regions of large or small mean velocity (or mean shear) is an incidental (albeit relevant for applications) consequence of the details of the particular flow considered.
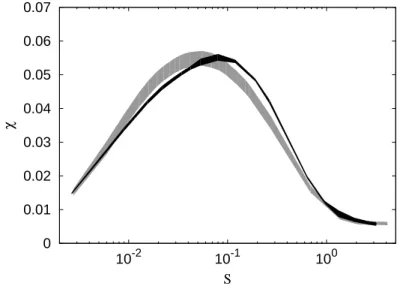
0 0.01 0.02 0.03 0.04 0.05 0.06 0.07 10-2 10-1 100 χ S
FIG. 4. Rms relative deviation χ from the homogeneous distribution plotted as a function of S for Re = 230 (grey curve) and Re = 990 (black curve). The thickness of the curves reflects the statistical fluctuations around the mean value.
The overall effect of turbophoresis can be quantified by means of the rms relative deviation of the mean density profile ρ(z) from the uniform distribution ρ0 as χ = [1/Lz
RLz
0 (1 −
ρ(z)/ρ0)2dz]1/2. For the specific profile (4), clearly we have χ(S) = a(S)/
√
2. This quantity is plotted in Fig.4 as a function of the inertia parameter. In agreement with expectations, the turbophoretic effect is not monotonic as a function of inertia. It displays a maximum at S ≃ 10−1. The shape of the curves is not strongly affected by changing Re even though
we observe, within the statistical uncertainties, a weak dependence of the position of the maximum.
Remarkably, deviations from the uniform distribution are present also for particles whose Stokes time is much smaller than the Kolmogorov time. Arguments based on local variations of the eddy diffusivity can not be used to explain the origin of such inhomogeneities, because the particle relaxation time is shorter that the shortest eddy-turnover time of the flow. The mechanism responsible for such inhomogeneities also for St ≪ 1 is related to the weak compressibility of the particle velocity field. When St ≪ 1, expanding at first order in τ the velocity of the particle one has v = u − τ (∂tu+ u · ∇u) + o(τ) (see e.g. Ref.10). The mean
vertical profile of the divergence of the particle velocity field is h∇ · vi = −τh·∇(u · ∇u)i = −τ∂2
zhu2zi. The mean divergence is positive in the maxima of hu2zi and is negative in the
minima, providing an explanation for the accumulation of inertial particles in the minima of hu2
zi, observed at very weak inertia.
C. Small-Scale Clustering
Besides the large-scale effects discussed above, inertial particles transported in a turbulent flow display small-scale clustering. Small-scale spatial inhomogeneities originate from the dissipative dynamics in the 6-dimensional position-velocity phase space (x, v)10,11. In
par-ticular, inertial particle motion asymptotically takes place on a (multi-)fractal set in phase space. A fractal dimension smaller than space dimension signals an enhanced probability to find particle pairs at short separation. Indeed, the probability to find particle pairs at separation below a certain r (smaller than the Kolmogorov scale) grows as rD2, with D
2 = 3
for uniformly distributed particles in three dimensions29. The correlation dimension D 2 is
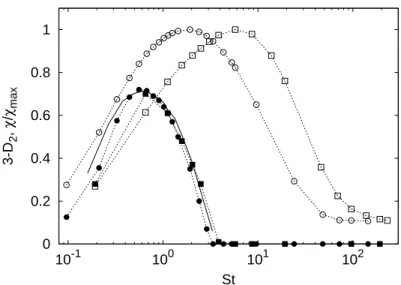
thus commonly used as a measure of clustering. In Fig. 5 we plot the co-dimension 3 −D2 as
a function of St = τ /τη for two values of Re. In agreement with previous results obtained in
homogeneous, isotropic turbulence (HIT)13, we find that the fractal co-dimension has only
a very weak dependence on Re. Moreover, we find that it is not affected by the large-scales inhomogeneities of the Kolmogorov flow30 as apparent from Fig. 5 where published data for
D2 of heavy particles from a HIT simulation13 are shown for comparison31. On the
con-trary, the turbophoretic clustering measured by χ plotted as a function of St has a strong dependence on Re: the maximum is attained for larger St as Re increases (see Fig.5).
The different Re-dependence of the two phenomena reflects their different nature. The small-scale clustering is due to the chaotic dynamics at viscous scales, therefore it is most
0 0.2 0.4 0.6 0.8 1 10-1 100 101 102 3-D 2 , χ / χmax St
FIG. 5. Correlation co-dimension 3 − D2 of particle distributions (filled symbols) and rms relative
deviation from uniform distribution χ (empty symbols, same data of Fig. 4) as a function of St (filled symbols) and for Re = 230 (circles) and Re = 990 (squares). The continuous line show the
comparison with the D2 computed for a HIT case from13at Reλ= 185.
effective at St ∼ O(1), i.e. when τ ≃ τη. Conversely, turbophoresis is the result of the
trans-port of particles across the large-scale inhomogeneities of the flow. Its effects is maximum for particles with response time of the order of the large-scale eddy turnover time T , i.e, at S ≃ 1. As the Reynolds number grows, the scale separation between the two unmixing mechanisms is expected to grow as T /τη ∼ Re1/2, as shown in Fig. 5.
IV. CONCLUSIONS
We have investigated the phenomenon of turbophoresis and fractal clustering of heavy inertial particles in the bulk of inhomogeneous flow, by performing DNS of the dynamics of heavy particles transported by the turbulent Kolmogorov flow. The emerging scenario in the limit of large Re is the following. The distribution of particles with small inertia is characterized by a strong fractal clustering at small scales, but is weakly affected by turbophoresis. On the contrary, particles with large inertia experience strong turbophoretic accumulation at large scales while remaining uniformly distributed at small scales. The turbophoretic effect is maximum for particles with Stokes time of the order of the large-scale eddy-turnover times of the turbulent flow. Conversely, small-large-scale fractal clustering is
maximal for particles with Stokes times comparable with the Kolmogorov time.
Turbophoresis is characterized by large scale particle density profiles which are strongly correlated to the inhomogeneities of the flow. In particular, particle density is maximal in the minima of the turbulent eddy diffusivity, which for the case of the Kolmogorov flow coincides with the maxima of the mean flow. This is an important difference with what observed in wall bounded flows, where turbophoresis concentrates particles in regions of minimum mean flow close to the boundaries and demonstrates that the regions of particle accumulation depend on the details of the flow.
ACKNOWLEDGMENTS
We acknowledge support from the European COST Action MP1305 “Flowing Matter”. Numerical simulations were performed at CINECA via the INFN-FieldTurb grant.
REFERENCES
1G. Hidy, Aerosols: an industrial and environmental science (Elsevier, 2012).
2M. W. Reeks, “Transport, mixing and agglomeration of particles in turbulent flows,” Flow,
Turbulence and Combust. 92, 3–25 (2014).
3G. Falkovich, A. Fouxon, and M. Stepanov, “Acceleration of rain initiation by cloud
turbulence,” Nature 419, 151–154 (2002).
4R. A. Shaw, “Particle-turbulence interactions in atmospheric clouds,” Annu. Rev. Fluid
Mech. 35, 183–227 (2003).
5S. Weidenschilling, “Dust to planetesimals: Settling and coagulation in the solar nebula,”
Icarus 44, 172–189 (1980).
6P. Tanga, A. Babiano, B. Dubrulle, and A. Provenzale, “Forming planetesimals in
vor-tices,” Icarus 121, 158–170 (1996).
7A. Bracco, P. Chavanis, A. Provenzale, and E. Spiegel, “Particle aggregation in a turbulent
keplerian flow,” Physics of Fluids (1994-present) 11, 2280–2287 (1999).
8J. Williams and R. Crane, “Drop coagulation in cross-over pipe flows of wet steam,” J.
9Y. Xiong and S. E. Pratsinis, “Gas phase production of particles in reactive turbulent
flows,” J. Aerosol Sci. 22, 637–655 (1991).
10E. Balkovsky, G. Falkovich, and A. Fouxon, “Intermittent distribution of inertial particles
in turbulent flows,” Physical Review Letters 86, 2790 (2001).
11J. Bec, “Fractal clustering of inertial particles in random flows,” Physics of Fluids 15,
L81–L84 (2003).
12K. Duncan, B. Mehlig, S. ¨Ostlund, and M. Wilkinson, “Clustering by mixing flows,” Phys.
Rev. Lett. 95, 240602 (2005).
13J. Bec, L. Biferale, M. Cencini, A. Lanotte, S. Musacchio, and F. Toschi, “Heavy particle
concentration in turbulence at dissipative and inertial scales,” Phys. Rev. Lett. 98, 084502 (2007).
14J. C. Maxwell, “On stresses in rarefied gases arising from inequalities of temperature.”
Proc. Royal Soc. London 27, 304–308 (1878).
15G. Sehmel, “Particle deposition from turbulent air flow,” J. Geophys. Res. 75, 1766–1781
(1970).
16J. W. Brooke, K. Kontomaris, T. Hanratty, and J. B. McLaughlin, “Turbulent deposition
and trapping of aerosols at a wall,” Phys. Fluids A 4, 825–834 (1992).
17M. Caporaloni, F. Tampieri, F. Trombetti, and O. Vittori, “Transfer of particles in
non-isotropic air turbulence,” J. Atmos. Sci. 32, 565–568 (1975).
18G. I. Sivashinsky, “Weak turbulence in periodic flows,” Physica D: Nonlinear Phenomena
17, 243–255 (1985).
19V. Borue and S. A. Orszag, “Numerical study of three-dimensional kolmogorov flow at
high reynolds numbers,” J. Fluid Mech. 306, 293–323 (1996).
20S. Musacchio and G. Boffetta, “Turbulent channel without boundaries: The periodic
kol-mogorov flow,” Phys. Rev. E 89, 023004 (2014).
21M. R. Maxey and J. J. Riley, “Equation of motion for a small rigid sphere in a nonuniform
flow,” Phys. Fluids 26, 883–889 (1983).
22S. Belan, I. Fouxon, and G. Falkovich, “Localization-delocalization transitions in
tur-bophoresis of inertial particles,” Phys. Rev. Lett. 112, 234502 (2014).
23G. Sardina, P. Schlatter, L. Brandt, F. Picano, and C. Casciola, “Wall accumulation and
spatial localization in particle-laden wall flows,” J. Fluid Mech. 699, 50–78 (2012).
tur-bulent boundary layer,” Journal of fluid Mechanics 468, 283–315 (2002).
25C. L´opez and U. M. B. Marconi, “Multiple time-scale approach for a system of brownian
particles in a nonuniform temperature field,” Phys. Rev. E 75, 021101 (2007).
26J. B. McLaughlin, “Aerosol particle deposition in numerically simulated channel flow,”
Phys. Fluids A 1, 1211–1224 (1989).
27D. Kaftori, G. Hetsroni, and S. Banerjee, “Particle behavior in the turbulent boundary
layer. ii. velocity and distribution profiles,” Physics of Fluids 7, 1107–1121 (1995).
28G. Sardina, F. Picano, P. Schlatter, L. Brandt, and C. M. Casciola, “Large scale
accumu-lation patterns of inertial particles in wall-bounded turbulent flow,” Flow, turbulence and combustion 86, 519–532 (2011).
29G. Paladin and A. Vulpiani, “Anomalous scaling laws in multifractal objects,” Physics
Reports 156, 147–225 (1987).
30In principle the fractal clustering could depend on z due to the space-dependent
fluctua-tions of the energy dissipation which changes the local value of St. However we did not observe measurable variations of D2 in the vertical directon, consistently with the results
of20 showing variations in ǫ within 10% across the domain.
31Small-scale clustering can display effects of flow anisotropy32 which we did not investigate. 32P. Gualtieri, F. Picano, and C. Casciola, “Anisotropic clustering of inertial particles in