HAL Id: hal-01118100
https://hal-ensta-paris.archives-ouvertes.fr//hal-01118100
Submitted on 18 Feb 2015
HAL is a multi-disciplinary open access archive for the deposit and dissemination of sci-entific research documents, whether they are pub-lished or not. The documents may come from teaching and research institutions in France or abroad, or from public or private research centers.
L’archive ouverte pluridisciplinaire HAL, est destinée au dépôt et à la diffusion de documents scientifiques de niveau recherche, publiés ou non, émanant des établissements d’enseignement et de recherche français ou étrangers, des laboratoires publics ou privés.
Study of laser induced plasma grating dynamics in gases
Amélie Jarnac, Magali Durand, Yi Liu, Bernard Prade, Aurélien Houard,
Vladimir Tikhonchuk, André Mysyrowicz
To cite this version:
Amélie Jarnac, Magali Durand, Yi Liu, Bernard Prade, Aurélien Houard, et al.. Study of laser induced plasma grating dynamics in gases. Optics Communications, Elsevier, 2014, 312, pp.35 - 42. �10.1016/j.optcom.2013.07.082�. �hal-01118100�
1
Study of Laser Induced Plasma Grating Dynamics in Gases
A. Jarnaca, M. Duranda,b, Y. Liua, B. Pradea, A. Houarda, V. Tikhonchukc and A. Mysyrowicza,*a Laboratoire d’Optique Appliquée, ENSTA ParisTech, Ecole Polytechnique, CNRS, 91762, Palaiseau, France b
Townes Laser Institute, CREOL–The College of Optics and Photonics, University of Central Florida, Orlando, FL 32816, USA
c
Université Bordeaux, CNRS, CEA, CELIA (Centre Lasers Intenses et Application), UMR 5107, 33405, Talence, France
*Corresponding author: A. Mysyrowicz, 828 Bvd des Maréchaux, 91762 Palaiseau, +33169319989,
Abstract
The relaxation of a plasma grating resulting from the interference of two crossing laser filaments in molecular and atomic gases is studied experimentally. Dissipation of the grating fringes is dominated by ambipolar diffusion in atomic gases and by a combination of ambipolar diffusion and collision-assisted free electron recombination in molecular gases. A theoretical model of the grating evolution is developed and compared to experimental results. Good agreement with simulations allows extracting plasma properties such as electron density, diffusion and recombination coefficients in Ne, Ar, Kr, Xe, N2, O2, CO2 and air at atmospheric pressure.
Keywords
Non-linear optics, filamentation, plasma grating, ambipolar diffusion, recombination.
1. Introduction
Femtosecond laser filamentation has raised much interest in the last decade in various domains of applied physics such as guiding electric discharges [1, 2], atmospheric monitoring through LIDAR technique [3], THz generation [4], white-light continuum generation [5] or virtual radiofrequency antenna [6]. Resulting from a dynamic competition between the Kerr effect and plasma defocusing, filamentation appears spontaneously during the propagation of an intense femtosecond laser pulse, provided the initial peak power exceeds a threshold value Pcr (a few GW in gases). An intensity reaching 5×10¹³ W/cm2 in air is maintained in the core of the beam over an extended length, producing a long string of plasma in the wake of the pulse [7]. In order to remotely control the filamentation process for long range applications, much attention has been given to intersecting filaments by another femtosecond laser pulse. In the intersection region, interference of the two pulses gives rise to a plasma grating [8-10]. Recent studies have highlighted the role of the grating as a way to manipulate femtosecond pulses: energy exchange [10-12], interruption of filament [13-15] or redirection of a third beam [16, 17]. Measurements of the plasma density as well as the relaxation process of the plasma grating are crucial for the understanding of the phenomenon. In a recent article we reported first results concerning the experimental characterization of the plasma grating decay in several molecular and atomic gases [18].
In this manuscript we present the complete theoretical model and the experimental results allowing describing the plasma dynamics in the laser induced grating for all studied gases. We demonstrate that the plasma fringes are washed out by the ambipolar diffusion in atomic gases and by a combination of the ambipolar diffusion and collision-assisted free electron recombination in molecular gases. A theoretical model based on a Bragg diffraction is developed to interpret the experimental results. Data are fitted by the model, allowing extraction of the plasma properties such as the free electron density, diffusion and
2
recombination coefficients in Ne, Ar, Kr, Xe, N2, O2, CO2 and air. Some of these parameters were already measured several years ago but for a very low gas pressure and in a fully ionized plasma [19-21]. The recombination coefficient for air was also estimated and measured in the case of single filament, showing discrepancy between different values obtained [22-24]. In the present study we measured these quantities at atmospheric pressure in a weakly ionized gas.
The outline of this paper is the following: first, we study in Sec. 2 the plasma by using temporally resolved in-line diffractometry measurements to determine the initial plasma density and the recombination coefficient of the filament in the crossing area. Due to the laser field interference, this density is higher than the density in single filaments, and needs to be evaluated. We then elaborate in Sec. 3 a theoretical model describing the relaxation of the grating. We finally study the decay of grating using a pump-probe experiment. Best fits between calculations and experimental results yield the initial free electron density, its time evolution as well as the diffusion coefficient in all studied gases.
2. Study of the plasma relaxation
2.1. Experimental set-up
We used in the experiment a chirped pulse amplified (CPA) femtosecond laser system delivering 50 fs pulses at 800 nm with a maximum energy of 15 mJ at a repetition rate of 100 Hz. At the output of the CPA system the laser beam has a Gaussian spat ial intensity distribution with a diameter of 14 mm. The output pulse is split into three beams by two sequential beam splitters (10%/90% and 50%/50%). Two pump laser pulses of 1 mJ with a vertical polarization are focused with a 1000 mm focal lens in a cell containing the gas at atmospheric pressure, where they form two filaments. A plasma grating is formed in the intersection region (see details in Refs. [17, 18]). Measurements were performed in air, O2, N2, CO2, Ne, Ar, Kr and Xe.
In this first experiment, an unfocused weak probe beam is used to illuminate the plasma grating (Fig. 1). The probe beam is sent transversely through the plasma. Since it propagates perpendicularly to the plane containing the fringes, it is only sensitive to the global phase object it traverses, but not to the plasma density modulation. The probe can be delayed with respect to the plasma formation time to record the temporal evolution of the diffraction pattern caused by the plasma bubble. We used a CMOS camera (uEYE UI-1240SE) placed at the distance H = 38 cm away from the plasma grating. A similar in-line diffractometry method has already been used in Refs. [24-26] to determine the temporal evolution of the plasma electron density in the case of a single filament produced in air.
2.2. Calculation of probe diffraction by a plasma bubble
The plasma electron density evolution was calculated from the diffractometry measurement of the probe beam. The plasma bubble produced at the intersection of the two filaments induces a change of refractive index on the path of the probe beam. The plasma refractive index reads , where is the plasma frequency,
is the laser angular frequency, 0 is the vacuum permittivity, e is the elementary charge, me is the electron mass and e is the electron plasma density. The ratio is small, so
the variation of the plasma refractive index is directly proportional to e:
(1) where c =1.7×1021 cm-3 is the electron critical density at 800 nm. Based on the crossing
geometry of two filamentary beams, we assume a super-Gaussian plasma density profile along x direction and a Gaussian profile along z direction with characteristic lengths L1 and
3
change of refractive index in the interaction area can be described as
(2) where n0 is the maximum variation of the index at the center of plasma and a is the super Gaussian order. Then the phase shift due to the probe beam propagation through the plasma reads
(3) Assuming that the probe beam has a Gaussian spatial profile with a width w0 ~7 mm, the amplitude of diffracted wave at the distance H from the plasma is expressed as follows:
(4) The expression above provides a relation between the plasma electron density and the diffraction pattern of the probe intensity .
The temporal evolution of the probe diffraction pattern provides information on the plasma relaxation. It is governed by two phenomena: the free carrier diffusion and recombination. In a plasma created by filamentation, the degree of ionization is rather low and the electron recombination is based on two distinct processes: the recombination on parent ions and attachment to neutral atoms. Zhou et al. [27] demonstrated that in gases the first process is faster. The electron diffusion could be important over a distance of a few microns, comparable to the electron mean free path, but it can be neglected on the plasma scale of a few tens of microns. Consequently, the decay of the electron plasma density from the initial value can be expressed as [24] (5). The electron recombination coefficient can be found from the contrast of the fringes as the ratio , where I0 is
the background intensity and is the difference of the probe beam intensity with and without the plasma.
2.3. Experimental results and discussion
Fig. 2 presents an image obtained from the diffraction of the probe beam by the plasma bubble in air. Two images have been recorded: the probe transmitted though the plasma (a) and the background without plasma (b). The pictures shown in Fig. 2(a) and 2(b) were taken when the probe beam was sent = 1.13 ps after the formation of the plasma grating. After subtraction of the background we obtain the diffraction pattern shown in Fig. 2(c). The x-profile of the fringes extracted from Fig. 2(c) along the y position where the fringes are at their maximum is shown in Fig. 2(d). The contrast is calculated by dividing the profile by the maximum value of the background taken at the same coordinate y. These measurements were performed for different gases as a function of the delay between the probe beam and the formation of the plasma. The contrast extraction procedure was routinely repeated for each delay .
The calculated fringe profile is best fitted to the experimental one (see Fig. 3) through adjustable parameters a, L1 and L2 that characterize the shape of the plasma bubble. For all gases it was found a = 2, L1 = 40 µm and L2 = 90 µm, except for Xenon for which L1 = 80 µm. Once the plasma shape is fixed, the maximum contrast is linked to the electron density
e. We considered here only the real part of the refractive index n0. By adding a complex part related to absorption one could improve the fit of the central fringe at x = 0.
The model allows retrieving from the maximum fringe contrast the plasma density evolution. The fringe contrasts for each delay measured experimentally and fitted by
4
Eq. (5) are reported in Fig. 4 for all gases studied. The striking result is a significant difference in the electron relaxation times in the molecular and atomic gases. The relaxation time in the diatomic gases is less than 100 ps, which is radically different from the atomic gases, where the electron lifetime exceeds 1 ns. A very slow plasma decay in the case of argon is explained by the fact that the electron recombination proceeds through the long lived Rydberg states [28] with a very low ionization potential. It is possible that in our experiment the intensity of the probe is sufficient to re-ionize the Argon atoms in Rydberg states, which would explain the longevity of the plasma grating in this case.
One can see that measurements can be well fitted using this equation. The inverse dependence of the plasma density with time is indeed confirmed experimentally. The maximum at = 0 gives the initial density of the plasma 0 and the decay rate gives the
recombination coefficient . The values shown in Table 1 are consistent with the data from Refs. [26, 29, 30].
The electron recombination could occur through several mechanisms in the filament plasma: the direct radiative electron-ion recombination, collision-assisted electron-ion recombination and, for molecules, the dissociative recombination. The direct radiative electron-ion recombination is an intrinsic property of the atom or molecule, which does not depend on the gas temperature or pressure. Its characteristic time is in the range of a few hundred ns, much longer than the decay times measured here. The dissociative recombination process corresponds to a collision of an electron with a molecular ion resulting in two neutral atoms, e + X2+ → X + X. The corresponding cross-section could be as high as 10-13 – 10-14 cm2 at room temperature, but it decreases by 2 – 3 orders of magnitude for the electron temperature Te ~ 1 – 10 eV [31]. Thus it also leads to a recombination time in the nanosecond
scale, which is inconsistent with the observations. The last process is the three body recombination where the electron-ion recombination is assisted by a neutral atom or molecule: e + X+ + X → X + X. Assuming the electron density e of the order of 1017 cm-3
and the neutral density at = 2.7×1019 cm-3, the collision-assisted recombination time is in the
sub-nanosecond range, and it dominates under our experimental conditions.
Several authors have discussed the decay of plasma generated by laser filamentation in air in terms of the collision-assisted recombination [24, 25]. The coefficient = Kat is
proportional to the density of neutrals. The constant K was previously determined at low gas pressures and at the normal temperature 300 K for a few gases: for Helium K ~ 10-26 – 10-27 cm6/s [19], for Oxygen K ~ 10-30 cm6/s [20] and for Neon K ~ 10-27 cm6/s [21]. The laser filament crossing experiment provides the possibility to evaluate K for several gases at higher electron temperatures and at the atmospheric pressure. The results are reported in Table 1. For every gas the initial electron density is of the order of 1017 – 1018 cm-3. This value is in agreement with simulations using the PPT (Perelomov, Popov and Terent’ev) model of multi-photon ionization [32], under the assumption of a complete interference between the two crossing laser fields and a filament intensity for each gas taken from ref. [33].
Air N2 O2 CO2 Ne Ar Kr Xe 0 (cm-3) 1×10 18 1×10¹⁸ 1×10¹⁸ 9×10¹⁷ 7×10¹⁷ 3×10¹⁸ 2×10¹⁸ 9×10¹⁷ (cm3/s) 5×10⁻⁸ 3×10⁻⁸ 4×10⁻⁸ 2×10⁻⁷ 6×10⁻⁹ 2×10⁻¹⁰ 1×10⁻⁹ 2×10⁻⁹ K (cm6/s) 2×10-27 1×10-27 2×10-27 7×10-27 2×10-28 7×10-30 4×10-29 6×10-29
Table 1: Plasma parameters determined by diffractometry technique. The parameters 0 and were obtained
from best fitting the fringe contrast and its decay in time. The constant K was calculated using the relation =
Kat.
5
characteristics of the plasma generated from the interference of two laser filaments in different gases. The extracted values of the peak densities and the recombination constants will be used as starting parameters for the analysis of the temporal evolution of the plasma grating.
3. Study of the plasma grating
3.1. Experimental set-up
The experimental set-up is presented in Fig. 5. The plasma grating is generated similarly to the previous experiment. A weaker third probe beam at the frequency 2, this time collinear with one of the filament forming pulse, is diffracted by the grating in the direction of the other filament. In order to satisfy the Bragg condition, the second harmonic probe beam is diffracted by the second order anharmonic term of the grating profile. The diffraction efficiency of the grating is measured as a function of the time delay between the probe beam and the formation time of the grating. The experiment was performed for three configurations = 7, 14 and 90°. A photodiode was used to measure the diffracted probe beam. From these measurements, the parameters of the plasma decay, the electron diffusion and the electron recombination, can be retrieved.
3.2. Theoretical model
The goal of this part is to provide a model for interpretation of the experimental data concerning the lifetime of the plasma grating. We consider two optical beams crossing at an angle in the (y, z) plane. The electric field related to two overlapping waves can be expressed as (see scheme in Fig. 6):
(6) The interference pattern is defined by the intensity that presents the periodic modulations along z-axis with the wave vector , where is the fringe spacing of the grating. For our calculations we assume that amplitudes of both filamentary beams, A1 and A2 are equal.
During the filamentation process, a laser pulse of a duration tp leaves in its trail a thin,
weakly ionized plasma channel. The peak plasma density can be estimated from the equation
(7)
where M is the coefficient of M-photon ionization with the integer M depending on the gas
characteristics and the ionization regime – multi-photon or tunnel, according to the Keldysh-PPT model. In the present case, we are interested in the maximum electron density obtained from the constructive interferences of the two intercepting filaments. For each gas studied, the ionization regime was defined according to Refs. [7, 34] and the values of the parameter M are presented in Table 2.
Air N2 O2 CO2 Ne Ar Kr Xe
M 5 7 5 5 5 5 4 4
Table 2: Number of photons needed in the ionization process according to the Keldish-PPT model.
According to Eqs. (6) and (7), the plasma density is proportional by the M-th power of the interference field:
(8)
with 0 the maximum electron density in the plasma grating. Among the two phenomena that are responsible for the relaxation of the plasma grating, the electron recombination was considered in the previous section. To evaluate the role of the second process, the electron
6
diffusion, we consider the characteristic spatial scales of the problem. For the electron density in plasma ~ 1018 cm-3 and the electron temperature of a few electron-volts, the electron Debye length D is about 0.07 m and the electron mean free path en is approximately 0.15 m.
Both of them are smaller than the grating period that is in the range from 0.6 to 6 µm. Consequently, the diffusion is not controlled by electrons, but is associated to their parent ion mobility. It is known as the ambipolar diffusion [35], whose coefficient reads as
, where Ti is the ion temperature, is the ion diffusion coefficient,
kB is the Boltzmann constant and i is the ion mobility. Under these assumptions, the temporal
evolution of the electron plasma density obeys the partial differential equation:
(9)
where the first term in the right hand side describes the electron diffusion along the plasma modulation direction. The initial condition to this equation is given by expression (7). It contains the main grating period and its harmonics /n with n ≤ M:
(10) thus leading to a system of M-coupled differential equations for the electron density harmonics n, which have been solved numerically.
The lifetime of the plasma grating is measured by the probe beam operating at the second harmonic 2According to the Bragg condition, the diffraction efficiency is proportional to the amplitude of the second harmonic of the grating 2. The principle is schematized in Fig. 7. After solving the M-coupled differential equations (9), we retain only two terms in the electron density while solving the Helmholtz equation for the probe beam. Then, according to Eqs. (1) and (10), the plasma refraction index reads:
(11)
Correspondingly, the field of the probe beam splits into the transmitted 0 and diffracted r
waves:
(12) The amplitudes of these two waves are described by two differential equations:
(13)
with the boundary conditions corresponding to the incident fundamental wave, 0 (0) = A0,
and to the absence of the diffracted wave, R (0) = 0. For a grating size L2 less than one
hundred microns one can neglect the probe wave depletion, and assuming 0 to be constant,
solve the equation for the diffracted wave only. Then, one obtains a simple expression for the reflected intensity
(14)
Thus, IR depends on the second harmonic of the grating amplitude 2, which follows an
evolution ruled by Eq. (9). By measuring and fitting the decay of the reflected intensity we can determine experimentally the values D and . The characteristics of the plasma determined in Sec. 2 served as initial conditions in the simulations. The temporal evolution of the plasma grating and the characteristic electron densities in air are shown in Fig. 8 for relevant parameters. The average electron density decreases with time relatively slowly, approximately by a factor 2 in 40 ps, which is consistent with the result presented for air in Fig. 4. The grating amplitudes corresponding to the main and the second harmonic decrease faster: the main harmonic decreases by a factor 2 in 30 ps while the second harmonic requires less than 20 ps.
7
3.3. Experimental results and discussion
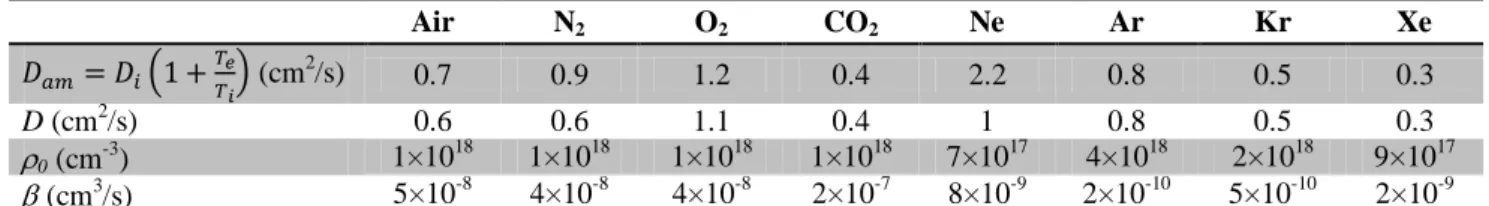
Fig. 91 shows the intensity of the probe beam diffracted by the grating as a function of time in molecular and atomic gases for three angles . In all atomic gases, there is a strong dependence of the signal diffracted with the angle . It decreases with increasing crossing angle as experimentally shown in [8, 17]. It can be explained by the fringe spacing . A smaller grating period leads to a reduction of the time necessary for a diffusive wash out of the fringe pattern. One can note that the lifetime of the grating is much shorter than the plasma recombination time measured in Fig. 4 for the same gas. We can then conclude that in atomic gases the role of recombination in the grating dynamics is negligible compared to ambipolar diffusion. On the contrary, in molecular gases, the plasma recombination time is comparable to the relaxation time of the grating, so that both the recombination and the diffusion play a role in the grating relaxation. In each gas, the three experimental curves are fitted with one set of parameters ρ0, and D. The numerical fitting procedure is restrictive,
since for a same set of parameters 0 and , the time dependence of the plasma and grating
decay must be reproduced. The retrieved parameters ρ0, and D from this calculation are
presented in Table 3. The coefficients Dam correspond to the calculated ambipolar diffusion
coefficient, with i from Refs. [35, 36], for Ti = 300 K (room temperature) and Te = 0.5 eV
[37]. The diffusion coefficients D obtained from our experiment are in good agreement with calculated values. The value of the electron recombination coefficient of air is consistent with the experiment performed with a single filament [24, 25]. Values of the diffusion coefficient have not been measured before in this range of pressure and temperature.
Air N2 O2 CO2 Ne Ar Kr Xe (cm2/s) 0.7 0.9 1.2 0.4 2.2 0.8 0.5 0.3 D (cm2/s) 0.6 0.6 1.1 0.4 1 0.8 0.5 0.3 0 (cm-3) 1×10 18 1×10¹⁸ 1×10¹⁸ 1×10¹⁸ 7×10¹⁷ 4×10¹⁸ 2×10¹⁸ 9×10¹⁷ (cm3/s) 5×10⁻⁸ 4×10⁻⁸ 4×10⁻⁸ 2×10⁻⁷ 8×10⁻⁹ 2×10⁻¹⁰ 5×10⁻¹⁰ 2×10⁻⁹
Table 3: Plasma characteristics determined experimentally. The same set of parameters D, 0 and is
obtained from best fitting the plasma and the grating decay for each gas. The first line presents the calculated
value of the diffusion with i taken from Refs. [35, 36].
4. Conclusions
We have fully characterized the plasma and the grating formed at the intersection of two crossing filaments in several atomic and molecular gases. Two processes, which are responsible for the plasma relaxation are identified. In atomic gases, the plasma grating lifetime is very sensitive to the filaments crossing angle , but not in molecular ones. Therefore, the dissipation of the grating is dominated by the ambipolar diffusion in atomic gases and by a combination of the ambipolar diffusion and the collision-assisted free electron recombination in molecular gases. We have elaborated a theoretical model based on the Bragg diffraction that describes the grating relaxation. The numerical results are in good agreement with the experimental observations. By combining the observations with the model we extracted the electron density ρ0, the recombination time and the diffusion coefficient D in
all tested gases. Such values have never been determined at the atmospheric pressure and the room temperature. Therefore, we provide a pioneering experimental technique to measure inherent characteristics of a specific type of plasma formed by laser filamentation.
1
The sharp dips observed in Air, O2 and N2 = 90° are due to spontaneous revivals of the refractive index
which diffract the probe pulse before it reaches the grating volume. For clarity, the dips observed at other angles
8
Acknowledgments
We acknowledge fruitful discussions with Dr B. Forestier, technical help from J. Carbonnel, A. Dos Santos and Dr J. Gautier and financial support from DGA.
References
1 . Comtois, C. . Chien, A. esparois, F. énin, G. arry, T. . ohnston, .-C. ieffer, . La Fontaine, F. artin, R. awassi, . Pépin, F. A. M. Rizk, F. Vidal, P. Couture, H. P. Mercure, C. Potvin, A. Bondiou-Clergerie, I. Gallimberti, Appl. Phys. Lett. 76 (2000) 819.
[2] B. Forestier, A. Houard, I. Revel, . urand, . . André, . Prade, A. arnac, . Carbonnel, . Le Nevé, J. C. de Miscault, B. Esmiller, D. Chapuis, A. Mysyrowicz, AIP Advances 2 (2012) 012151.
[3] J. Kasparian, M. Rodriguez, G. Méjean, J. Yu, E. Salmon, H. Wille, R. Bourayou, S. Frey, Y.-B. André, A. Mysyrowicz, R. Sauerbrey, J.-P. Wolf, L. Wöeste, Science 301 (2003) 61.
4 C. ’Amico, A. ouard, . Franco, . Prade, A. ysyrowicz, A. Couairon, V.T. Tikhonchuk, Phys. Rev. Lett. 98 (2007) 235002.
[5] L. Wöste, C. Wedekind, H. Wille, P. Rairoux, B. Stein, S. Nikolov, Chr. Werner, S. Niedermeier, H. Schillinger, R. Sauerbrey, Laser Optoelektron. 29 (1997) 51.
6 . relet, A. ouard, . Point, . Prade, L. Arantchouk, . Carbonnel, .- . André, M. Pellet, A. Mysyrowicz, Appl. Phys. Lett. 101 (2012) 264106.
[7] A. Couairon, A. Mysyrowicz, Phys. Rep. 441 (2007) 47-189.
[8] X. Yang, J. Wu, Y. Peng, Y. Tong, P. Lu, L. Ding, Z. Xu, H. Zeng, Opt. Lett. 34 (2009) 3806-3808. [9] S. Suntsov, D. Abdollahpour, D. G. Papazoglou, S. Tzortzakis, Appl. Phys. Lett. 94 (2009) 251104.
[10] Y. Liu, M. Durand, S. Chen, A. Houard, B. Prade, B. Forestier, A. Mysyrowicz, Phys. Rev. Lett. 105 (2010) 055003.
[11] A. Bernstein, M. McCormick, G. Dyer, J. Sanders, T. Ditmire, Phys. Rev. Lett. 102 (2009) 123902. [12] C. Gong, Y. Zheng, Y. Zhong, Z. Zeng, C. Li, X. Ge, R. Li, Z. Xu, Appl. Phys. Lett. 101 (2012) 251111. [13] S. Suntsov, D. Abdollahpour, D. G. Papazoglou, S. Tzortzakis, Opt. Express 17 (2009) 3190.
[14] X. Yang, J. Wu, Y. Peng, Y. Tong, S. Yuan, L. Ding, Z. Xu, H. Zeng, Appl. Phys. Lett. 95 (2009) 111103. [15] Y. Liu, M. Durand, A. Houard, B. Forestier, A. Couairon, A. Mysyrowicz, Opt. Commun. 284 (2011) 4706. [16] X. Yang, J. Wu, Y. Tong, L. Ding, Z. Xu, H. Zeng, Appl. Phys. Lett. 97 (2010) 071108.
[17] M. Durand, Y. Liu, B. Forestier, A. Houard, A. Mysyrowicz, Appl. Phys. Lett. 98 (2011) 121110. [18] M. Durand, A. Jarnac, Y. Liu, B. Prade, A. Houard, V. Tikhonchuk, A. Mysyrowicz, Phys. Rev. E 86 (2012) 036405.
[19] J. Berlande, M. Cheret, R. Deloche, A. Gonfalone, C. Manus, Phys. Rev. A 1 (1970) 887. [20] L. Chanin, A. Phelps, M. Biondi, Phys. Rev. Lett. 2 (1959) 344.
[21] R. N. Bhave, R. Cooper, Aust. J. Phys. 48 (1995) 503.
[22] X. M. Zhao, J. C. Diels, C. Y. Wang, J. M. Elizondo, IEEE J. Quantum Electron. 31 (1995) 599-612. [23 . A. iondi, “Recombination,” in Principles of Laser Plasmas, G. Bekefi, ed. New York: Wiley, 1976, pp. 125-157.
[24] S. Tzortzakis, B. Prade, M. Franco, A. Mysyrowicz, Opt. Commun. 181 (2000) 123.
[25] G. Rodriguez, A. R. Valenzuela, B. Yellampalle, M. J. Schmitt, K. Kim, J. Opt. Soc. Am. B 25 (2008) 1988. [26] S. Bodrov, V. Bukin, M. Tsarev, A. Murzanev, S. Garnov, N. Aleksandrov, A. Stepanov, Opt. Express 19 (2011) 6829.
[27] B. Zhou, S. Akturk, B. Prade, Y.- . André, A. ouard, . Liu, . Franco, C. ’Amico, E. Salmon, Z.-Q. Hao, N. Lascoux, A. Mysyrowicz, Opt. Express 17 (2009) 11450.
[28] Y. Kabouzi, D. Graves, E. Castaños-Martínez, M. Moisan, Phys. Rev. E 75 (2007) 016402. [29] F. Théberge, W. Liu, P. Simard, A. Becker, S.L. Chin, Phys. Rev. E 74 (2006) 036406. [30] Y.-H. Cheng, J. K. Wahlstrand, N. Jhajj, H. M. Milchberg, Opt. Express 21 (2013) 4740. [31] A. I.Florescu and J. B. A. Mitchell, Phys. Rep. 430 (2006) 277.
[32 A. . Perelomov, V.S. Popov, .V. Terent’ev, Sov. Phys. ETP 23 (1966) 924. [33] A. Couairon, H. S. Chakraborty and M. B. Gaarde, Phys. Rev. A 77, (2008) 053814.
[34 S. L. Chin, “From ultiphoton to Tunnel Ionization”, in: S. . Lin, A. A. Villaeys, . Fujimura (Eds.), Advances in Multiphoton Processes and Spectroscopy, World Scientific, Singapore, 16, 2004, pp 249-272. [35] E. U. Condon, H. Odishaw, Handbook of physics, second ed., McGraw Hill, New York, 1967. [36] P. Polynkin, Appl. Phys. Lett. 101 (2012) 164102.
9
Figures
Fig. 1.
Fig. 2.
10
11
Fig 5.
Fig. 6.
Fig. 7.
12
13
Figure captions
Figure 1: Experimental set-up of the in-line diffractometry measurement.
Figure 2: Recorded diffraction patterns for a delay = 1.13 ps with respect to the plasma formation in air: (a) Image of the strips obtained on the camera after the probe beam has been diffracted by the plasma bubble; (b) Spatial profile of the probe beam without plasma bubble; (c) Images of fringes due to diffraction after the subtraction of the background (b); (d) x-profile of (c) at the coordinate y where the fringes are at their maximum.
Figure 3: Theoretical fit of the fringe pattern corresponding to Fig. 2(d).
Figure 4: Decay of the experimental (black dots) and fitted (red open circles) diffraction contrast extracted from Fig. 3 as a function of the delay .
Figure 5: Experimental set-up for measuring of the plasma grating lifetime
Figure 6: Schematic representation of two plane waves of same wavelength crossing with an angle . The black lines represent the grating formed at the intersection.
Figure 7: Schematic of the reflection of the 2 probe beam by the plasma grating.
Figure 8: (a) Temporal evolution of one period of the plasma density grating for the following set of parameters: = 0.8 m, = 14°, Dam = 1 cm2/s, = 5.10-8 cm2/s and 0 = 1018 cm-3. (b)
Left axis – temporal evolution of the average density (circle), the first (square) and the second (solid line) harmonics of the grating. Initially the fringe maxima are 4 times above the average density for M = 5. Right axis – reflected intensity of the 2 probe beam on the grating (dash line).
Figure 9: Normalized intensity of diffracted probe signal as a function of the delay (ps) for crossing angles of 7°, 14° and 90°. Measures are represented by dots. Calculations are represented by solid lines.