Phosphorus Transformations in an Oxisol under contrasting land-use
systems: The role of the soil microbial biomass
A. Oberson
1∗, D. K. Friesen
2, I.M. Rao
3, S. Bühler
1& E. Frossard
11Group of Plant Nutrition, Institute of Plant Sciences, Swiss Federal Institute of Technology (ETH), P.O. 185, CH-8315 Lindau, Switzerland. 2CIMMYT/IFDC, P.O. Box 25171, Nairobi, Kenya (formerly, CIAT/IFDC, Cali, Colombia).3CIAT, P.O. Box 6713, Cali, Colombia
Key words: Organic phosphorus; Oxisol; Phosphorus availability; Phosphorus transformations; Soil microbial
biomass
Abstract
It is generally assumed that phosphorus (P) availability for plant growth on highly weathered and P-deficient tropical soils may depend more on biologically mediated organic P (Po) turnover processes than on the release of adsorbed inorganic P (Pi). However, experimental evidence showing the linkages between Po, microbial activity, P cycling and soil P availability is scarce. To test whether land-use systems with higher soil Poare characterized by greater soil biological activity and increased P mineralization, we analyzed the partitioning of P among various organic and inorganic P fractions in soils of contrasting agricultural land-use systems and related it to biological soil properties. Isotopic labeling was used to obtain information on the turnover of P held in the microbial biomass. Soil samples were taken from grass–legume pasture (GL), continuous rice (CR) and native savanna (SAV) which served as reference. In agreement with estimated P budgets (+277, +70 and 0 kg P ha−1 for CR, GL and SAV, respectively), available P estimated using Bray-2 and resin extraction declined in the order CR > GL > SAV. Increases in Bray-2 and resin Pi were greater in CR than GL relative to total soil P increase. Organic P fractions were significantly less affected by P inputs than inorganic fractions, but were a more important sink in GL than CR soils. Extractable microbial P (Pchl) was slightly higher in GL (6.6 mg P kg−1) than SAV soils (5.4 mg P kg−1), and significantly lowest in CR (2.6 mg P kg−1). Two days after labeling the soil with carrier free33P, 25, 10 and 2% of the added33P were found in Pchl in GL, SAV and CR soils, respectively, suggesting a high and rapid microbial P turnover that was highest in GL soils. Indicators of P mineralization were higher in GL than CR soils, suggesting a greater transformation potential to render Poavailable. Legume-based pastures (GL) can be considered as an important land-use option as they stimulate P cycling. However, it remains to be investigated whether crops planted in pasture–crop rotations could benefit from the enhanced Pocycling in grass–legume soils. Furthermore, there is need to develop and test a direct method to quantify Pomineralization in these systems.
Introduction
Phosphorus (P) deficiency is a major constraint to agricultural productivity and it affects an area es-timated at over 2 billion hectares worldwide. The highly weathered acidic Oxisols and Ultisols account for more than 70% of P-deficient soils in the tropics, of which nearly 50% are found in tropical America (Fairhurst et al., 1999). If food security is to be
at-∗ Corresponding author: Fax: +41-52-354-91-19; E-mail: astrid.oberson@ipw.agrl.ethz.ch
tained in the tropics during the coming decades, the constraint of P deficiency must be addressed.
As a non-renewable resource with relatively low concentrations in the biosphere, use of P from fertil-izers must be rationalized. This is especially true in the tropics where iron and aluminum oxides in Oxisols and Ultisols cause strong sorption of soluble fertilizer P. To improve the efficiency of P applications, it is imperative to maximize the recycling of P from crop residues, and organic and mineral fertilizers. In highly weathered tropical soils, the availability of P may de-pend more on the turnover of easily decomposable soil
organic matter than on the desorption of inorganic P (Pi) (Tiessen et al., 1992; Gijsman et al., 1996; Tiessen and Shang, 1998). Processes such as immobilization of Piby microbes and its gradual release via microbial turnover can protect P from physico-chemical ad-sorption reactions if this release is synchronized with the demand of growing plants and/or a subsequent generation of microorganisms (Magid et al., 1996). Furthermore, a significant part of the P held in soil mi-croorganisms is a readily available P source for plants (Macklon et al., 1997).
Microorganisms play a key role in soil Po trans-formations (Stewart and Tiessen, 1987; McLaughlin et al., 1988; Magid et al., 1996; Frossard et al., 2000) through excretion of phosphatase enzymes (Dighton, 1983; Sinsabaugh et al., 1993), mineralization of P from organic sources (Lopéz-Hernandez et al., 1998; Gressel et al., 1996), and synthesis and release of Po (Seeling and Zasoski, 1993; Magid et al., 1996). In addition, microorganisms can solubilize sparingly sol-uble Pi forms (Kucey et al., 1989; Illmer et al., 1995). Soil microorganisms were found to be a major factor in controlling organic and inorganic P solution con-centrations in temperate grassland topsoils (Seeling and Zasoski, 1993).
In recent years, substantial progress has been made in the selection and breeding of crop and forage plants genetically adapted to low-P soils (Pellet and El-Sharkawy, 1993; Rao et al., 1999b; Lynch and Beebe, 1995; Fageria and Baligar, 1997). The improved cul-tivars have been shown to efficiently utilize low inputs of fertilizer P (Rao et al., 1995; Friesen et al., 1997; Oberson et al., 1999). In addition to root attributes such as size, distribution and P uptake efficiency, which affect the ability of plants to absorb P (Rao et al., 1997, 1999a), rates of crop/forage residue de-composition differ among plant species (Thomas and Asakawa, 1993; Friesen et al., 1997; Gijsman et al., 1997a). The decomposition of plant residues is bio-logically driven, with soil microorganisms making by far the most important contribution in mineralization (Cadisch and Giller, 1997). A linkage between veget-ative cover, soil biological activity and soil P availab-ility was suggested by studies of Guggenberger et al. (1996) and Oberson et al. (1999) where changes in the P status of native savanna soils replaced by introduced grass–only (Brachiaria decumbens) and grass–legume (Brachiaria decumbens and Pueraria phaseoloides) pastures were investigated. Grass–legume pastures had higher reserves of labile Po compounds (phos-phonates and diester P) assessed by liquid state 31P
nuclear magnetic resonance spectroscopy (Guggen-berger et al., 1996). The soils under grass–legume pasture maintained higher organic and available P levels with less temporal variation than grass–alone or native pastures (Oberson et al., 1999). With compar-able fertilizer inputs and greater product exports than in grass–alone pastures, improved P availability in grass–legume pastures could not be due to differences in P budgets. It was suggested that greater turnover of roots and above-ground litter in legume-based pastures could provide for steadier Po inputs and, therefore, higher P cycling and availability. The soil Pofraction most affected was NaOH extractable P (Oberson et al., 1999). Beck and Sánchez (1994) concluded NaOH-Po to be the primary source of plant available P in non-fertilized systems. Tiessen et al. (1984) found a close relationship between resin extractable Pi and Po in Ultisols. These studies suggested that Pocontributes to available Pi.
If this is correct, land-use systems that increase soil Po should enhance soil biological activity and therefore increase P mineralization. We tested this hypothesis by studying soil P transformations in an Oxisol under contrasting agricultural systems after 5 years of change in land-use. The contrasting land-use systems were grass–legume pasture (GL), continu-ous rice (CR) and native savanna (SAV) that served as reference treatment. First, chemical sequential P extraction was used to evaluate whether a higher parti-tioning of fertilizer P into organic fractions occurred in GL than in CR. To investigate whether Powas immob-ilized or turned over, biological soil parameters related to P transformations such as size of the soil microbial biomass, amount of microbially bound P and C miner-alization and acid phosphatase activity were assessed. Given the central role of microorganisms in the soil P cycle, microbial P turnover was studied using33P isotopic labeling.
Materials and methods
Field experiment
Soil samples were taken in a 5-year-old field exper-iment established in 1993 to investigate the sustain-ability of crop rotation and ley farming systems for the acid soil savannas (Friesen et al., 1997). The ex-periment was carried out at the CORPOICA-CIAT (Instituto Colombiano Agropecuario; Centro Inter-nacional de Agricultura Tropical), Carimagua research
station, Meta, Colombia (4◦30’N, 71◦19’W), 150 m above sea level on the eastern plains of Colombia. The area is representative of the well-drained savannas. Rainfall averages 2240-mm annually, falling mainly from late March to mid-December. Mean annual tem-perature is 27◦C. Soils are well drained silty clay Oxisols (tropeptic haplustox, isohyperthermic). Soil chemical characteristics of the 0–10 cm soil layer are summarized in Table 1.
The following treatments were included in the study:
(1) Native savanna (SAV) as reference: native grass-land, burned once per year in February, not grazed. (2) Grass–legume pasture (GL): pasture under-sown with rice in 1993, since then grass–legume pas-ture including Brachiaria humidicola CIAT 679,
Arachis pintoi CIAT 17434, Stylosanthes capit-ata CIAT 10280 and Centrosema acutifolium cv
Vichada CIAT 5277; partly resown for renova-tion in June 1996 with legumes (the same Arachis
pintoi and Centrosema acutifolium; additionally Stylosanthes guianensis CIAT 11833); on
aver-age grazed with 2.7 steers ha−1 during 15-day followed by a 15 days ley re-growth phase. (3) Continuous rice (CR) since 1993: Oryza sativa
cv Oryzica Sabana 6, cv Oryzica Sabana 10 since 1996; fallow during second semester rain and dry season.
The experiment had a split-plot design with four replicates with treatment sub-plots of 0.36 ha size (200 × 18 m). Before establishing the treatments GL and CR on savanna, the soil was conventionally tilled after burning the native vegetation. The CR and GL plots were limed before starting the experiment in 1993 us-ing 500 kg dolomitic lime ha−1. Rate of fertilization (kg ha−1) of rice was 80 N (urea, three split applic-ations), 60 P (triple superphosphate), 100 K (KCl), 35 S (20 as elemental, 15 as MgSO4·H2O) and 10
Zn (ZnSO4·6 H2O). With the exception of fertilizer
P placement in rice, all fertilizers were broadcast. While the introduced pasture received an additional 20 kg P ha−1only when renovated in 1996, rice was fertilized annually (60 kg P ha−1), resulting in the P inputs shown in Table 2. Native savanna was not fertilized. The systems also differ in soil cultivation (frequent, rare or no cultivation in CR, GL and SAV treatments, respectively) and in application of herbi-cides (frequent, rare or no application of herbiherbi-cides for CR, GL and SAV treatments, respectively).
Phosphorus budgets were estimated by subtracting the P removed from the system by grain and/or with
animal live weight gains from the P applied as mineral fertilizers. Phosphorus exports in grain were calcu-lated by multiplying weighed rice grain yields with measured P contents in the grain. Phosphorus exported in the animals was assumed to be 8 g per kg of live weight gain (NRC, 1984). Live weight gains in GL were on average 68 kg ha−1year−1.
Soil sampling
Soils were sampled in the rainy season, in September 1998. For the sampling, 0.09 ha sub-plots (75×12 m) were delimited in each treatment and replicate to avoid border effects and disturbance by micro-plots laid out for special investigations. These sub-plots were di-vided into three 25×12 m sampling sub-sub-plots to assure that random cores were taken over the complete area. Within each sampling sub-sub-plot area, 20 cores (0–10 cm depth) were sampled using a 5 cm diameter auger. The cores were put into a bucket, homogenized, and roots removed. Subsequently, all 60 cores were mixed in another bucket and a sub-sample of about 2 kg soil (wet wt.) was filled into plastic bags. Collected soil samples were immediately (in the field) put into cool boxes and taken back to the station where they were kept at 4◦C until they were sieved (4-mm) and the remaining visible plant residues were removed. Part of the soil was stored at 4◦C and the remainder was air-dried.
Sampling in the 0–10 cm layer represented a pre-cautionary method to avoid contamination with soil from deeper layers that was not affected by soil cul-tivation (usually to a maximum of 15 cm depth).
Soil phosphorus analyses
Soil P analyses were carried out on each field replic-ate using air-dried, 2-mm-sieved samples. Sequential P fractionation was carried out using the following extractants on 0.5 g soil samples and quantifying in-organic P (Pi), total P (Pt) and (by difference) organic P (Po) in the extracts (Hedley et al., 1982, modified by Tiessen and Moir, 1993): H2O with anion exchange
resin in HCO3-form, 0.5 M NaHCO3, 0.1 M NaOH,
and hot (80◦C for 10 min) concentrated HCl. Total P in the soil residue after extraction was determined by digestion with hot concentrated perchloric acid. Changes in fractions in fertilized CR and GL soils
Table 1. Soil pH, total C, total N and exchangeable cations in the 0–10-cm soil layer of the contrasting land-use systems
Treatment pH(H2O) Total C Total N Total P Bray-2 P Exchangeable cations cmol+kg−1
mg g−1 mg g−1 mg g−1 mg g−1 Al Ca Mg K
Savanna† 4.9b 26.1a 1.68 216a 1.4a 2.64b 0.21a 0.15a 0.09a
Grass–legume† 4.8b 28.4b 1.80 272b 3.4a 2.19a 0.57b 0.34b 0.14b
Continuous rice† 4.7a 24.7a 1.67 354c 15.6b 2.33ab 0.57b 0.28b 0.21c
F-test‡ ∗∗ ∗∗∗ ns ∗∗∗ ∗∗∗ ∗ ∗∗∗ ∗∗∗ ∗∗∗
†Means of four field replicate samples per treatment. Means within a column followed by the same letter are not signific-antly different (P = 0.05) by Tukey’s multiple range test.
‡F-test:∗∗∗P < 0.001,∗∗P = 0.001–0.01,∗P = 0.01–0.05; ns, not significant.
Table 2. Estimated P budget over 5 years (1993–1997) for contrasting land-use systems, and resulting changes in
total P contents in the 0–10 cm soil layer
Treatment Estimated P budget (kg P ha−1) Increase in soil total P content
Input Export Balance Bulk density† Calculated from Measured‡ (Mg m−3) P balance (mg P kg−1) (mg P kg−1)
Savanna 0 0 0 1.24 0
Grass–legume 80 10 + 70 1.24 56 52 (11)
Continuous rice 300 23 + 277 1.15 241 152 (8)
†Source: CIAT (1999).
‡See Table 3; mean and SEM of four field replicates; pairs of SAV and GL, and SAV and CR, respectively, were formed at random.
were compared to non-fertilized SAV using:
Increase (%)= 100 (1)
(size of fraction in fertilised treatment − size of fraction in SAV)
(SumPtfertilized treatment− Sum PtSAV)
where:
Sum Pt= Resin Pi+ NaHCO3Pt (2)
+ NaOH Pt+ HCl Pt+ Resid Pt
Bray-2 P and total P were determined at the Analytical Service Laboratory of CIAT. Bray-2 P was extracted using dilute acid fluoride (0.03 M NH4F, 0.1 M HCl)
at a 1:7 soil:solution ratio using 2.85 g soil and 40 s shaking time. Total soil P was determined by digestion with a mixture of 2 parts hot concentrated HNO3and
1 part concentrated HClO4, using 5 ml per 0.5 g soil. Particulate organic matter
Particulate organic matter (> 53 µm) was isolated by dispersing soil of each field replicate in 5% so-dium hexametaphosphate and passing the suspen-sion through a sequence of 2-mm, 250 µm and 53 µm sieves (Cambardella and Elliott, 1992; Gijs-man, 1996). The fraction > 2-mm was discarded while
the 250 and 53 µm fractions were dried at 50◦C in an oven, finely ground and analyzed for total C and N using a flash combustion element analyzer (Carlo Erba Instruments, NA 1500, Rodano-Milano, Italy).
Biological and biochemical soil analyses Microbial biomass C, N and P
Field moist soil (4-mm sieved) was incubated at 26◦C for 15 days at a water content of 50% of field capa-city (280 g H2O kg−1 soil dry wt.) before the size of
microbial C, N and P was determined. Microbial C and N were determined in duplicate and microbial P in triplicate on each field replicate.
Levels of microbial C and N were analyzed using the method of Vance et al. (1987) in which paired sub-samples of incubated soil were either immedi-ately extracted with 0.5 M K2SO4or fumigated with
ethanol-free chloroform for 24 h in the dark at room temperature before extraction. Extracts were lyophil-ized and transported to FiBL Frick Switzerland where they were re-wetted before organic C and total N de-termination using a Dimatoc 100 apparatus (Dimatec, Essen, Germany). Glycine, EDTA and ammonium sulfate standards subjected to the same procedure showed that lyophilization had no effect on C and N content in the extracts. Microbial C and N released
during chloroform fumigation (CChl, NChl) were cal-culated from the difference in extractable C and N, respectively, before and after the fumigation. No con-version factors were used to convert CChl and NChl values to microbial biomass.
The portion of microbially bound P released dur-ing 1.25 h fumigation with chloroform (PChl) was determined by the procedure of Morel et al. (1996) as modified by Oberson et al. (1997). Microbial P released during fumigation was extracted by Bray-1 solution and a correction for P adsorption during fumigation was calculated based on recovery of P ad-sorbed from a series of P additions incubated for an equivalent time period (Fig. 1a).
Soil respiration, C mineralization and phosphatase activity
Carbon mineralized during soil respiration was de-termined for each field replicate by trapping and quan-tifying CO2 evolved by 40 g sub-samples of humid
soil (4-mm sieved) placed in sealed containers using the method of Zibilske (1994). The samples were in-cubated for 63 days during which evolved CO2 was
determined twice per week during the first 3 weeks of incubation, and weekly thereafter. Carbon mineral-ization was calculated as the CO2-C produced during
incubation. The metabolic quotient qCO2 (Anderson
and Domsch, 1990; Gijsman et al., 1997b) was cal-culated as the rate of CO2-C production (µg) per mg
CChlper h.
Acid phosphatase activity at pH 6.5 of soil samples was measured for each field replicate using 1 g air-dried soil (< 2-mm) according to the method of Tabatabai (1982).
Isotopic composition of extracted microbial P
To investigate the microbial P turnover in the ab-sence of fresh organic matter additions, an isotopic labeling experiment was carried out under conditions of constant soil respiration by combining the approach of McLaughlin et al. (1988) with the Pchl determ-ination method using Bray-1 extractant as described previously (Oberson et al., 1997).
Field moist samples (4-mm sieved) were pre-incubated at 26◦C for 3 weeks by which time the respiration rate had become low and nearly con-stant (Fig. 2). Then, isotopically exchangeable P was labeled by thoroughly mixing the soil with carrier free33P labeled orthophosphate solution. The labeling amounted to 11.0, 8.6 and 12.4 kBq g−1soil for SAV,
Figure 1. (a)Amounts of P extracted using Bray-1 as a function of
the amount of unlabeled P added to the GL soil. Three (0 and 5 mg P kg−1soil) or two analytical replicates per P addition. (b)Specific activity (SA) of Bray-1 extracted P as a function of the amount of unlabeled P added to the GL soil 2 days after labeling. Three (0 and 5 µg P/g soil) or two analytical replicates per P addition. (c)Specific activity (SA) of Bray-1 extracted P as a function of the SA of a constant amount of P (6.67 mg P kg−1) added with increasing33P activities to the GL soil 2 days after labeling. Each point presents a mean of three analytical replicates.
GL and CR, respectively. Water content was only slightly raised by labeling. Soil water content was con-trolled by weighing and readjusted if required every other day during the ongoing incubation.
Two and 8 days after labeling, chloroform released P was determined as described previously. In addition to colorimetric Pi determination, radioactivity in all Bray-1 extracts was determined by scintillation count-ing uscount-ing 1 ml aliquots. Preliminary tests showed that neither the Bray-1 extractant nor possible residues of chloroform affected the counting.
The concentration of33P applied was very low (< 3.5× 10⁻⁶µg P g−1soil) compared to31P. Therefore,
the specific activity (SA) of Pi in the extracts can be calculated as follows:
SA (Bqµg−1P)=33P/31P (3) For the non-fumigated, non-P-amended samples, the SA (SA-Bray0) can be obtained directly after decay
correction to the date of labeling. While Pi sorption occurring during fumigation and extraction can be cor-rected by the P addition curve approach presented previously (Fig. 1a), correction for sorption and/or exchange of the 33P isotope is much more complex
(McLaughlin et al., 1988). As the disappearance or appearance of33P in solution depends not only on the isotope concentration, but also on the specific activity of P in solution, correction for isotope recovery can-not be calculated from the disappearance of an added spike of isotope. Figure 1b illustrates that the addition of increasing amounts of non-labeled Pidilutes the SA of Bray-1 extractable P. Figure 1c demonstrates that the addition of the constant amount of Pi with increas-ing specific activities increases the specific activity of Bray-1 extracted Pi. The recovery of 33P added with the spike solutions is not complete since some of it is immediately exchanged with31P located on the soil’s solid phase. Therefore, the recovery of33P de-rived from lysed microbial cells will not be complete and has to be corrected (McLaughlin et al., 1988). This correction is obtained by the addition of spike solutions containing a Pi amount close to Pchl and a range of specific activities (Fig. 1c) (McLaughlin et al., 1988). However, because exchange processes are on-going (Fardeau, 1993), new correction curves had to be established at every sampling date. This renders the experiments very laborious. For this reason, com-posite samples containing equal portions of the four field replicates were used. The Pchl content of the composite samples did not differ from the mean value assessed on the four field replicates.
Statistical analysis
Statistical analysis was carried out using log trans-formed data in order to meet the assumptions of analysis of variance (i.e., additive effects, symmetric errors with equal variance). The effect of land-use sys-tem was tested by analysis of variance (ANOVA). If the F-test was significant (P< 0.05), the means were compared using Tukey’s multiple range test.
Figure 2. Changes in daily C mineralization rate during the
incub-ation.
Results and discussion
Fate of applied P
Inputs by fertilizers exceeded P exports in GL and CR, resulting in positive P balances (Table 2). Total P de-termined by perchloric acid digestion (Table 1) was not significantly different from the sum of fractions extracted by the sequential procedure (Table 3). The total P content measured in the 0–10 cm soil layer was 52 and 152 mg P kg−1 higher in the GL and CR, respectively, than in the SAV topsoil (Tables 2 and 3). The increases in total P content calculated from the P balance (Table 2), assuming the bulk densities shown in Table 2, were 56 and 241 mg P kg−1for GL and CR, respectively. These increases demonstrate full recov-ery of applied P in the 0–10 cm soil layer of GL while some P is unaccounted for in the CR soil. Due to soil cultivation in the CR treatment (usually to a maximum of 15 cm depth), part of the applied P may have been mixed into deeper soil layers or may have moved into the subsoil, as observed by Beck and Sánchez (1996) on a cropped Ultisol.
In agreement with the positive P balance, available Pi increased in the CR and GL soils in relation to the SAV reference (Tables 1 and 3). For tropical pasture species, amounts of Bray-2 P from 2 to 5 mg kg−1 (i.e., the range within the GL soils fall) are considered medium while they would be considered low for crops. For most tropical crops, Bray-2 P of 11–15 mg kg−1 are considered adequate and >15 high (I.M. Rao, un-published), indicating that in the investigated CR soils, P is not a yield limiting factor.
Resin, NaHCO3 (0.5 M) and NaOH (0.1 M)
ex-tractable Pi were higher in CR than in GL, both in absolute and relative terms (Table 3). NaOH Piis con-firmed to be the main sink for applied P, as observed
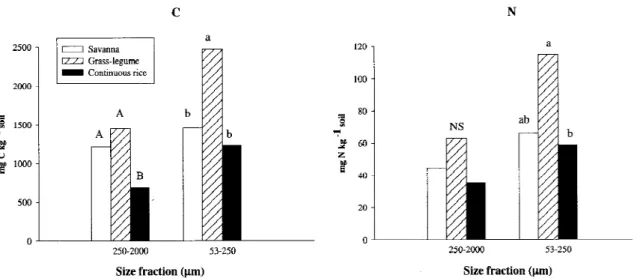
Figure 3. Particulate organic matter C and N in two size fractions in soils of contrasting land-use systems. Upper case letters denote significant
differences among systems for the 250 µm–2-mm, lower case letters for the 53–250 µm size fraction.
in earlier studies on Oxisols at Carimagua (Friesen et al., 1997; Oberson et al., 1999) and on Ultisols in the Amazon basin (Beck and Sánchez, 1994). Using path analysis, Beck and Sánchez (1994) concluded that P desorbed from this fraction could maintain P availability in fertilized systems.
Organic P fractions were less affected by P in-puts than Pi fractions. In addition, they were less affected in CR than in GL where especially NaOH Po acted as a sink. Analysis of changes in fractions using Eq (1) shows that more than 30% of the in-crease over SAV went into organic fractions in GL while the corresponding portion was less than 11% in CR soils (Table 3). Differences in the partitioning of P in the fertilized treatments indicate that P trans-formation processes in CR soils differ from those in GL soils. Though changes in absolute size of organic fractions are not statistically significant (Table 3), the organic fraction most affected was NaOH Po. This confirms a higher partitioning of P applied as fertilizer into organic fractions in GL soils (Guggenberger et al., 1996; Oberson et al., 1999). If NaOH Po could contribute to plant available Pi, GL should be charac-terized by higher soil biological activity mediating P mineralization, than CR soils.
Biological activity in relation to P transformations Size and composition of the microbial biomass
The amount of extracted microbial C, N and P was affected by the agricultural land-use system in the order GL ∼ SAV > CR (Table 4). This confirms
that, in Colombian savanna soils, the replacement of the native vegetation by grass–legume pasture rather increases the soil microbial biomass, while rice mono-cropping leads to a decrease (Gijsman et al., 1997b).
Although the fumigation extraction method is widely used to measure microbial biomass, there is still uncertainty about the conversion factors (kEC,
kEN, kP) to use in calculating the total soil microbial C, N and P contents. While techniques for kEC and
kEN determinations are available (Sparling and Zhu, 1993; Jörgensen, 1996), recent studies agree on not using kP factors (Morel et al., 1996; Oberson et al., 1997; Myers et al., 1999) because to date, no pre-cise technique for its determination is available that could account for all the variation among different or-ganisms and different soils. Sparling and Zhu (1993) found kEC to vary from 0.10 to 0.90 on acid sandy soils of Western Australia. Feigl et al. (1995) obtained kEC factors of 0.20–0.30 on a range of Amazon basin rain forest soils comprising Oxisols, Ultisols and an Alfisol with 18–80% clay content. If we convert CChl (Table 4) using a kEC of 0.25, the estimated soil mi-crobial biomass ranged from 289 (CR) to 689 (GL) mg microbial C kg−1 soil. This is less than reported for Oxisols under undisturbed tropical rain forest (Feigl et al., 1995), but is in the range reported for temperate pastures (Sparling, 1992) and arable soils (Fliessbach and Mäder, 1997). The same applies for the percentage of total soil C held in the microbial biomass (1.2– 2.4%, assuming kEC of 0.25) (Sparling, 1992), which suggests that the soil microbial population has adapted
Table 3. Distribution of P in various fractions in fertilized land-use systems (continuous rice, grass–legume pasture) 5
years after establishment on native savanna as assessed from sequential extraction. Relative changes (% increase) describe which percentage of total P increase in fertilised systems over native savanna was found in a given fraction (formula see footnote †)
Treatment Resin NaHCO3 NaOH HCl Resid Sum
Pi Pi Po Pi Po Pi Po Pt Pt‡ Pi§ Po¶
Savanna
Mean mg kg−1 2.6a 3.9a 11.3a 27.4a 45.3 35.6a 23.9 60.6 212a 69a 81.9
Grass–legume Mean mg kg−1 4.8b 6.7b 14.6b 45.5b 51.0 46.5b 30.3 62.2 263b 103b 97.8 % Increase† 4.3 5.4 6.5 35.5 11.3 21.4 12.6 3.2 101 66.6 31.1 Continuous rice Mean mg kg−1 14.3c 20.2c 17.1b 111.0c 42.7 54.3b 36.2 65.6 363c 200c 98.0 % Increase† 7.7 10.7 3.8 55.0 −1.7 12.3 8.1 3.3 100 85.8 10.6 F-Test ∗∗∗ ∗∗∗ ∗∗ ∗∗∗ ns ∗ ns ns ∗∗∗ ∗∗∗ ns
Means of four field replicates samples per treatment. Means within a column followed by the same letter are not signific-antly different (P = 0.05) by Tukey’s multiple range test. F-test:∗∗∗P < 0.001,∗∗P = 0.001–0.01,∗P = 0.01–0.05; ns, not
significant.
† Increase (%) = (size of fraction in fertilized treatment – size of fraction in SAV) / (Sum Ptfertilized treatment – Sum Pt SAV) 100.
‡Sum Pt= Resin Pi+ NaHCO3Pt+ NaOH Pt+ HCl Pt+ Resid Pt= Sum Pi+ Sum Po. §Sum Pi= Resin Pi+ NaHCO3Pi+ NaOH Pi+ HCl Pi.
¶Sum Po= NaHCO3Po+ NaOH Po+ HCl Po.
to the severe chemical constraints of highly weathered tropical soils.
While NChl values are also in a similar range to temperate cropped soils (Fliessbach and Mäder, 1997), PChlis significantly lower. As a consequence, CChl/Nchl ratios were similar while CChl/PChl was significantly higher. Though differences are not signi-ficant, the lower CChl/NChl ratios in GL and CR than SAV indicate higher N availability for microorganisms in CR and GL soils. While N fertilizers were applied in CR, N availability in GL was increased by biological N fixation (Cadisch et al., 1989; Thomas, 1992). The P availability according to Bray-2 P contents varied among the soils (Table 1) and was adequate to high in CR soils. Despite that, the CChl/Pchl ratios were not affected by the land-use system. Microbial C/P ratios from 12:1 under high to 45:1 under low available P conditions were found by Chauhan et al. (1981).
Because it had the highest total soil P content and lowest PChl, the PChl/total P ratio was lowest in the CR soil (Table 4). The CR soil was also char-acterized by the lowest CChl/total C and NChl/total N ratios, indicating a lower significance of microor-ganisms as nutrient pools in the CR than in the SAV and GL soils. The Pchl was lowest in CR despite the fact that this treatment had the highest content in Bray-2 and resin extractable Pi (Tables 1 and 3),
confirming results obtained in another experimental site on the Eastern Plains of Colombia (Gijsman et al., 1997b). Higher PChlamounts under grass–legume pasture than savanna or grass–alone pasture were ob-served by Oberson et al. (1999). Consequently, in low P Oxisols, the quantity of extractable microbial P is determined by factors other than available Pi. Pastures containing legumes seem to exert a positive effect on microbial P through the input of plant material of higher quality (Thomas and Asakawa, 1993; Friesen et al., 1997). In addition, pasture soils are subjected to much less cultivation and herbicide applications than CR soils.
Size and composition of the microbial biomass in the various land-use systems agree with the higher im-portance of Poin GL and SAV than CR soils suggested by the P fractionation data. However, the changes in the size of the microbial nutrient pools or Po frac-tions cannot distinguish whether higher Po means P immobilization, or if the increases go along with higher mineralization. Results of Rao et al. (1994), Thomas and Lascano (1995) and Oberson et al. (1999) suggest that the higher litter quality of grass–legume pastures may result in increased mineralization and nutrient turnover. While approaches to measure soil P mineralization are available for non-P limited soils with medium to low P sorption capacity (Grierson
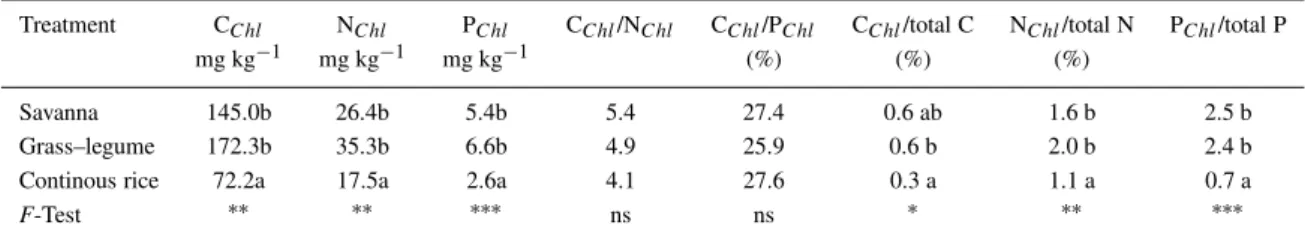
Table 4. Size, composition and significance of the soil microbial biomass nutrient pool in an Oxisol under different land-use systems:
amounts of extracted microbial C, N and P; microbial nutrient ratios and extracted microbial nutrients as percentage of the total nutrient content in the soil.†
Treatment CChl NChl PChl CChl/NChl CChl/PChl CChl/total C NChl/total N PChl/total P
mg kg−1 mg kg−1 mg kg−1 (%) (%) (%)
Savanna 145.0b 26.4b 5.4b 5.4 27.4 0.6 ab 1.6 b 2.5 b
Grass–legume 172.3b 35.3b 6.6b 4.9 25.9 0.6 b 2.0 b 2.4 b
Continous rice 72.2a 17.5a 2.6a 4.1 27.6 0.3 a 1.1 a 0.7 a
F-Test ∗∗ ∗∗ ∗∗∗ ns ns ∗ ∗∗ ∗∗∗
Means followed by the same letter are not significantly different (p = 0.05) by Tukey’s multiple range test. F-test:∗∗∗P < 0.001,∗∗P =
0.001–0.01,∗P = 0.01–0.05; ns, not significant.
† determined after a 15-day incubation period.
et al., 1999; Lopéz-Hernandez et al., 1998; Oehl et al., 2001), the P mineralization potential of low P acid Oxisols can be deduced only from indicators. We used C mineralization (Gressel et al., 1996) obtained from respiration measurements and acid phosphatase activity (Sinsabaugh et al., 1993; Renz et al., 1999).
Indicators of phosphorus mineralization
Cumulative C mineralization was higher in both grass-land systems than in the CR soil (Table 5). While min-eralization during the first 2 weeks of incubation was only slightly higher in SAV than GL (Fig. 2, Table 5), GL maintained higher mineralization thereafter.
Results of C mineralization were related to sub-strate availability indicated by particulate organic mat-ter (Fig. 3). There was more C and N in both size fractions in GL than in CR soils (significant at P = 0.05 for all except N in the 250 µm – 2-mm fraction), and contents in SAV took an intermediate position. Partic-ulate organic matter (POM) accounted for the majority of soil organic matter initially lost as a result of cultiv-ation of North American grassland soils (Cambardella and Eliott, 1992). The POM-N content in moist sa-vanna soils of West-Africa was shown to be influenced by organic matter additions and to contribute signific-antly to the maize N supply (Vanlauwe et al., 1999). That POM-N was highest in GL, therefore, suggests a higher input of mineralizable organic matter, while the decrease in POM-N when SAV was replaced by CR suggests a loss of organic nutrient reserves. In a recent study, Barrios et al. (1999) also observed a signific-ant increase for light soil organic matter fractions and potential N mineralization when SAV was replaced by GL, while decreasing values were observed when SAV was replaced by CR. Phiri et al. (2001), using size density fractionation on a Colombian volcanic-ash soil, found that the amount of soil organic matter
fractions correlated well with the amount of NaHCO3
extractable Pi and Po.
In contrast to microbial biomass and soil respira-tion, the metabolic quotient qCO2did not differ among
treatments, neither for the unsteady respiration phase from day 1 to day 14, nor during the phase of basal respiration (Table 5). Thus, no difference in organic substrate use efficiency is suggested (Gijsman et al., 1997b; Fliessbach and Mäder, 1997).
Acid phosphatase activity, and in turn the poten-tial to mineralize available phosphomonoesters (Renz et al., 1999), declined in the order SAV > GL > CR (Table 5). The higher activity in SAV than GL disagrees with results obtained on a nearby pasture experiment (Oberson et al., 1999), where phosphatase activity was significantly increased in introduced GL pasture soils. This might be due to differences in the botanical composition of the pastures (Rao et al., 1997). A significant decrease in acid phosphatase activity when native vegetation was replaced by sugar cane monocropping was found in similar soils from Brazil (examined by Feller et al. (1994), using the same method).
Soil acid phosphatases are exoenzymes of micro-bial and plant origin (Tabatabai, 1982). They can keep their functionality through stabilization by sorption and association on soil compounds (Leprince and Qui-quampoix, 1996). Plant roots increase phosphatase secretion under conditions of P deficiency (Rao et al., 1999a; Almeida et al., 1999). In addition, acid phos-phatase activity in soils is related to organic matter (Feller et al., 1994; Renz et al., 1999). Higher phos-phatase activity in SAV than GL may be due to very low Pi availability in SAV soil. The lower values of acid phosphatase activity in CR soil could be due to high Pi availability. The intermediate values of GL could result from a combined effect of greater
over-Table 5. Carbon mineralization and specific respiratory quotient of two different incubation periods, and
phos-phatase activity in low P acid soils of different land-use systems.†
Treatment Cumulative C mineralization qCO2 Phosphatase activity
(mg C kg−1soil) (µg CO2-C mg−1Cchl h−1) (µg nitrophenol g−1h−1) 1–14 days 14–63 days 1–14 days 14–63 days
Savanna 274b 299.3b 5.8 1.8 270.4c
Grass–legume 251b 416.8b 4.6 2.1 223.3b
Continuous rice 114a 161.5a 4.5 1.8 145.5a
F-Test ∗∗ ∗∗∗ ns ns ∗∗∗
Means followed by the same letter are not significantly different (P = 0.05) by Tukey’s multiple range test. F-test: ∗∗∗P <0.001,∗∗P = 0.001–0.01,∗P = 0.01–0.05; ns, not significant.
† determined after a 15 days incubation period.
Table 6. Reactivity of microorganisms towards added33P compared with Bray-1 extractable P: percentage of33P recovered in extractable microbial P (PChl) and percentage of33P in the Bray-1 extractant of the non-fumigated, non-P-amended sample (Bray0-P) at two sampling dates.
Treatment Days since Bray0-P Pchl Percentage of33P found in labeling† (mg kg−1) (mg kg−1) Bray0-P PChl Savanna 2 0.4 (0.01) 5.3 (0.31) 4.9 (0.21) 9.6 (0.90) 8 0.2 (0.01) 4.4 (0.14) 2.0 (0.08) 9.5 (0.15) Grass–legume 2 1.4 (0.09) 4.4 (0.56) 5.8 (0.49) 24.7 (2.36) 8 0.9 (0.04) 3.3 (0.23) 3.4 (0.04) 20.5 (1.86) Continuous rice 2 7.4 (0.24) 2.2 (0.63) 6.9 (0.24) 1.6 (0.70) 8 6.6 (0.24) 1.1 (0.05) 5.6 (0.26) 1.8 (0.24) Mean and SEM (in brackets) of three analytical replicates.
† Before labeling, soils were incubated for 3 weeks.
all biological activity, low Pi availability and higher organic substrate availability.
In conclusion, results on C mineralization, sub-strate availability estimated by Pofractions and POM, and phosphatase activity suggest that P mineralization is more important in delivering available P in GL soils than in SAV and CR soils.
Microbial P turnover
Two days after labeling the soil, 25, 10 and 2% of the added 33P were recovered in extractable micro-bial P in GL, SAV and CR soils, respectively, with only slight changes occurring after this time (Table 6). Differences among the percentage of incorporated iso-tope were greater than among PChl. Extractable PChl was similar in GL and SAV soils during the incuba-tion experiment, but lower in CR. Comparison of the PChl value assessed at the end of the pre-incubation time before labeling the soil (Table 4) with PChlvalues measured during the incubation experiment (Table 6) shows that the size of PChldid not increase, but rather decreased during incubation. Thus, incorporation of
33P was not caused by an increase in PChl size, but
shows that a part of PChlwas renewed. More than 20% of the tracer found in PChlin the GL soil suggests that microorganisms had turned over significant amounts of P held in their biomass during the 2 days since la-beling. This indicates a greater turnover of extractable microbial P in GL than in SAV and CR soils.
The high rates of33P incorporation into PChl in this experiment suggest that microbes can assimil-ate large amounts of soluble Pi within a very short time. The exact mechanisms of P assimilation by and P release from specific soil microorganism spe-cies have received scant attention. The P regulation of a few microbes, especially Escherichia coli (Wan-ner, 1996) and Saccharomyces cerevisiae (Oshima and Halvorson, 1994), is well known from laboratory studies. Inorganic orthophosphate is the preferred P source (Wanner, 1996). To cope with low P concen-trations, E. coli as well as other microorganisms have developed an emergency system induced by gene ex-pression (Torriani-Gorini, 1994). This system includes additional specific Pi transport mechanisms (Wanner,
1996), increased phosphatase production (Torriani-Gorini, 1994; Joh et al., 1996; Yazaki et al., 1997), and uptake of glycerol and hexose phosphates and phosphonates (Wanner, 1996). An increased rate of P recycling by organisms living in P deficient soils was suggested by Magid et al. (1996).
Substantial microbial P turnover can be deduced from other incubation studies as well. McLaughlin et al. (1988) found 25% of 33P added with labeled medic residues incorporated into the microbial bio-mass within 7 days. Walbridge and Vitousek (1987) recovered between 7 and 44% of added isotope in PChl after wetting–drying cycles, but as the specific activ-ity of acid fluoride extractable PChlwas not corrected for sorption or desorption of the isotope, these values most probably underestimate actual isotope incorpor-ation into microbial biomass. Friesen and Blair (1988) found 11% of added 33P in the Po pool of a mod-erately acidic low P podzol 1 day after addition and incubation.
Application of the sequential P fractionation pro-cedure described previously on33P labeled GL soils showed that, 2 days after labeling, up to 10% of the added isotope was recovered in NaOH Po (S. Bühler, unpublished). This concurs with the fast turnover of extractable microbial P deduced from33P incorpora-tion. These findings suggest a great significance and velocity of Po turnover in low P acid Oxisols, and agree with recent results showing that soil organic matter turnover was much faster in highly weathered tropical than temperate soils (Tiessen and Shang, 1998).
While other studies (loc. cit.) carried out with C additions and wetting–drying cycles caused flush ef-fects that were accompanied by significant changes in the size of microbial P, our work focused on microbial P turnover under conditions of basal respiration and nearly constant PChl size. Nevertheless, it cannot be completely excluded that soil microbial activity was stimulated by the thorough mixing that occurred when labeling the soil, even though the size of PChlwas not increased (Tables 4 and 6). Other factors that could result in overestimated turnover are the presence of labeled particulate or organic P since the calculation of
33P found in PChlis based on specific activity
determ-inations obtained by dividing total radioactivity by Pi in aliquots of the Bray-1 extracts. Radioactivity as well as Pi concentrations were the same whether 0.05 or 0.45 µm filters were used. This can be explained by centrifugation prior to filtration. Hence, interference of particulate P on the isotopic composition can be
dis-counted. The Po-to-Pi ratios were usually around 0.2 in Bray-1 extracts of soils from a nearby field exper-iment, and were only slightly reduced by fumigation (Oberson et al., 1997). Therefore, the effect of Poon the isotopic composition of Bray-1 extracts during the 8 days incubation experiment has been assumed to be negligible.
Significance of microbial P and organic P cycling in contrasting land-use systems
In our study, the highest33P incorporation (Table 6) suggesting fastest microbial turnover, was found in GL, which also had the highest biological activity (Tables 4 and 5) and low to medium available P con-tent (Tables 1 and 2). The lowest turnover rate was found in the CR soil, which also had the lowest biological activity and highest P status. The interme-diate microbial turnover rate in SAV was accompanied by low available P and intermediate biological activ-ity. Thus, in the investigated soils, biological activity rather than soil Pi availability seems to determine mi-crobial P uptake and release, and thus mimi-crobial P turnover. The higher the microbial activity, the greater the microbial P turnover.
Beck and Sánchez (1994) concluded that, in fertil-ized Ultisols, Piis the main source of plant available P. However, our results suggest that this applies only in the case of high fertilizer doses. In the case of the low P doses applied to GL, increases in biologically medi-ated processes play an important role in the mainten-ance of P availability and the efficiency of P cycling. These low P doses are maintained in the P cycle by the standing pasture plant biomass, which provide for steadier Poinputs by root and above-ground litter than do crops. Through the decomposition process, plant litter P enters into the soil microbial biomass. The microbial biomass represents a rapidly cycling P pool whose turnover is affected by the agricultural land-use system. Thus, in the case of low P doses, the failure of P to enter Popools, including plant biomass, living and dead soil organic matter, can be thought to indicate a degrading system due to low level of P cycling (CIAT, 1999).
The present study cannot give a final conclusion on the impact of different microbial P turnover rates on soil P dynamics. The immobilization of Pi by microbes and its gradual release through microbial turnover protects P from physico-chemical adsorption reactions with soil particles if this release is synchron-ized with the demand of growing plants and/or of
a next generation of microorganisms (Magid et al., 1996). If not, substantial competition between soil microbes and plants, on the one hand, and soil in-organic particles (adsorption surfaces) on the other, could occur for the scarce P resource, as found by Umrit and Friesen (1994). While Pi availability was increased more in CR than in GL, both absolute and relative to total P increases in soils, the Poavailability was increased more in GL. Introduced GL pastures, in which soil microbial P turnover is highest, sustain a high productivity of high quality forage (Lascano, 1991; Thomas and Lascano, 1995; Lascano and Eu-clides, 1996). This suggests that increased microbial P contents do not inhibit improved forage germplasm (Rao et al., 1995; 1999b) from acquiring the P needed.
Conclusions
Agricultural land-use systems replacing native sa-vanna on Oxisols affect the partitioning of P among in-organic and in-organic P fractions. Indicators of in-organic P mineralization suggest that organic P is more im-portant for delivering available P in improved grass– legume pastures than in continuously cropped and cultivated soils while, in cultivated soils, much higher P fertilizer doses significantly increase available inor-ganic P contents with lesser impact of orinor-ganic P pool sizes. The amount and turnover of P held in the soil microbial biomass is increased when native savanna is replaced by improved pasture while it was lowered when soils are cultivated and cropped continuously. Therefore, the study suggests an alternative strategy to cropping low P Oxisols through applications of high P fertilizer doses. The combination of low P fertil-izer doses and grass–legume pastures composed of germplasm that is adapted to the chemical constraints of Oxisols promotes P cycling and efficient use of P inputs. Given the high productivity of grass–legume pastures, the soil microbial biomass cannot be seen as a pool competing with the plant but rather as an important part in the P cycle that supports a high P use efficiency of the non-renewable P resource. However, it remains to be investigated whether crops planted in pasture-crop rotations could benefit from the enhanced organic P dynamics in grass–legume pasture soils, and a direct method to quantify organic P mineralization should be developed and tested in these systems.
Acknowledgements
We warmly thank staff in Carimagua and at the analyt-ical laboratories at CIAT-Palmira (Colombia) for the technical assistance we received in our field and labor-atory work and especially acknowledge the support by G.T. Borrero and G.M. Rodriquez. We are grate-ful to Dr. A. Gijsman (CIAT) and Dr. A. Fliessbach (FiBL Frick Switzerland) for advice on microbiolo-gical measurements. Theres Rösch (ETH Zürich) is acknowledged for total C and N determinations on particulate organic matter samples. The study was realized during a stay of the senior author at CIAT financed by the Swiss Federal Institute of Technology Zürich.
References
Almeida J P F, Lüscher A, Frehner M, Oberson A and Nösberger J 1999 Partitioning of P and the activity of root acid phosphatase in white clover (Trifolium repens L) are modified by increased CO2and P fertilization. Plant Soil 210, 159–166.
Anderson T H and Domsch K H 1990 Application of eco-physiological quotients (qCO2and qD) on microbial biomasses from soils of different cropping histories. Soil Biol. Biochem. 22, 251–255.
Barrios E, Corrales I I, Asakawa N, Cobo J G, Thomas R J and Friesen D K 1999 Soil macroorganic matter and N mineral-ization in crop-rotations and ley farming systems for acid-soil savannas of Colombia. In CIAT 1999. Overcoming soil degrad-ation through productivity enhancement and natural resource conservation. Annual Report 1999 pp. 108–112. CIAT, Cali, Colombia.
Beck M A and Sánchez P A 1994 Soil phosphorus fraction dynamics during 18 years of cultivation on a typic Paleudult. Soil Sci. Soc. Am. Proc. 58, 1424–1431. Beck M A and Sánchez P A 1996 Soil phosphorus movement and budget after 13 years of fertilized cultivation in the Amazon basin. Plant Soil 184, 23–31. Cadisch G and Giller K E 1997 Driven by nature. Plant litter quality
and decomposition. CAB International, 409 p.
Cadisch G, Sylvester-Bradley R and Noesberger J 198915N-based estimation of nitrogen fixation by eight tropical forage-legumes at two levels of P:K supply. Field Crops Res. 22, 181–194. Cambardella C A and Elliott E T 1992 Particulate soil organic matter
changes across a grassland cultivation sequence. Soil Sci. Soc. Am. J. 56, 777–783.
Chauhan B S, Stewart J W B and Paul E A 1981 Effect of labile inorganic phosphate status and organic carbon additions on the microbial uptake of phosphorus in soils. Can. J. Soil Sci. 61, 373–385.
CIAT 1999 Overcoming soil degradation through productivity en-hancement and natural resource conservation. Annual Report 1999, CIAT, Cali, Colombia.
Digthon J 1983 Phosphatase production by mycorrhizal fungi. Plant Soil 71: 455–462.
Fageria N K and Baligar V C 1997 Phosphorus-use efficiency by corn genotypes. J. Plant Nutr. 20, 1267–1277.
Fairhurst T, Lefroy R, Mutert E and Batjes N 1999 The importance, distribution and causes of phosphorus deficiency as a constraint to crop production in the tropics. Agroforestry Forum 9, 2–8. Fardeau J C 1993 Le phosphore assimilable des sols: sa
représent-ation par un modèle fonctionnel à plusieurs compartiments. Agronomie 13, 317–331.
Feigl B J, Sparling G P, Ross D J and Cerri C C 1995 Soil mi-crobial biomass in Amazonian soils: evaluation of methods and estimates of pool sizes. Soil Biol. Biochem. 27, 1467–1472. Feller C, Frossard E and Brossard M 1994 Activité
phosphatas-ique de quelques sols tropicaux à argile 1:1. Répartition dans les fractions granulométriques. Can. J. Soil Sci. 74, 121–129. Fliessbach A and Mäder P 1997 Carbon source utilisation by
mi-crobial communities in soils under organic and conventional farming practice. In Microbial communities: functional versus structural approaches. Eds. H Insam and A Rangger. pp. 109– 120. Springer, Berlin Germany.
Friesen D K and Blair G J 1988 A dual radiotracer study of trans-formations of organic, inorganic and plant residue phosphorus in soil in the presence and absence of plants. Aust. J. Soil Res. 26, 355–366.
Friesen D K, Rao I M, Thomas R J, Oberson A and Sanz J I 1997 Phosphorus acquisition and cycling in crop and pasture systems in low fertility tropical soils. Plant Soil 196, 289–294.
Frossard E, Condron L M, Oberson A, Sinaj S and Fardeau J C 2000 Processes governing phosphorus availability in temperate soils. J. Environ. Qual. 29, 15–23.
Gijsman A J 1996 Soil aggregate stability and soil organic mat-ter fractions under agropastoral systems established in native savanna. Aust. J. Soil Res. 34, 891–907.
Gijsman A J, Oberson A, Tiessen H and Friesen D K 1996 Limited applicability of the Century model to highly weathered tropical soils. Agron. J. 88, 894–903.
Gijsman A J, Alcaron H F and Thomas R T 1997a Root decompos-ition in tropical grasses and legumes, as affected by soil texture and season. Soil Biol. Biochem. 29, 1443–1450.
Gijsman A J, Oberson A, Friesen D K, Sanz J I and Thomas R T 1997b Nutrient cycling through microbial biomass under rice-pasture rotations replacing native savanna. Soil Biol. Biochem. 29, 1433–1441.
Gressel N, McColl J G, Preston C M, Newman R H and Powers R 1996 Linkages between phosphorus transformations and carbon decomposition in a forest soil. Biogeochemistry 33, 97–123. Grierson G F, Comerford N B and Jokela E J (1999) Phosphorus
mineralization and microbial biomass in a Florida Spodosol: ef-fects of water potential, temperature and fertilizer application. Biol. Fertil. Soils 28, 244–252.
Guggenberger G, Haumeier L, Thomas R J and Zech W 1996 As-sessing the organic phosphorus status of an Oxisol under tropical pastures following native savanna using 31P NMR spectroscopy. Biol. Fertil. Soils 23, 332–339.
Hedley M J, Stewart J W B and Chauhan B S 1982 Changes in inorganic and organic soil phosphorus fractions induced by cul-tivation practices and by laboratory incubations. Soil Sci. Soc. Am. Proc. 46, 970–976.
Illmer P, Barbato A and Schinner F 1995 Solubilization of hardly-soluble AlPO4 with P-solubilizing microorganisms. Soil Biol. Biochem. 27, 265–270.
Joergensen R G 1996 The fumigation-extraction method to estimate soil microbial biomass: calibration of the kecvalue. Soil Biol. Biochem. 28, 25–31.
Joh T, Malick D H, Yazaki J and Hayakawa T 1996 Purification and characterization of secreted acid phosphatase under phosphate-deficient condition in Pholiota nameko. Mycoscience 37, 65–70.
Kucey R M N, Janzen H H and Leggett M E 1989 Microbially mediated increases in plant-available phosphorus. Adv. Agron. 42, 199–228.
Lascano C E 1991 Managing the grazing resource for animal pro-duction in savannas of tropical America. Trop. Grasslands 25, 66–72.
Lascano C, Euclides V P B 1996 Nutritional quality and animal pro-duction of Brachiaria pastures. In Brachiaria: biology, agronomy and improvement. Eds. J W Miles, B Maass and do Valle C B. pp. 106–123.
Leprince F and Quiquampoix H 1996 Extracellular enzyme activity in soil: effect of pH and ionic strength on the interaction with montmorillonite of two acid phosphatases secreted by the ecto-mycorrhizal fungus Hebeloma cylindrosporum. Eur. J. Soil Sci. 47, 511–522.
Lopez-Hernandez D, Brossard M and Frossard E 1998 P-isotopic exchangeable values in relation to Po mineralization in soils with very low P-sorbing capacities. Soil Biol. Biochem. 30, 1663– 1670.
Lynch P J and Beebe S E 1995 Adaptation of beans (Phaseolus
vulgaris L.) to low phosphorus availability. HortScience 30,
1165–1171.
Macklon A E S, Grayston S J, Shand C A, Sim A, Sellars S and Ord B G 1997 Uptake and transport of phosphorus by Agrostis
capil-laris seedlings from rapidly hydrolysed organic sources extracted
from32P-labelled bacterial cultures. Plant Soil 190, 163–167. Magid J, Tiessen H and Condron L M 1996 Dynamics of organic
phosphorus in soils under natural and agricultural ecosystems.
In Humic substances in terrestrial ecosystems. Ed. H Piccolo. pp
429–466. Elsevier, Amsterdam.
McLaughlin M J, Alston A M and Martin J K 1988 Phosphorus cycling in wheat–pasture rotations II The role of the microbial biomass in phosphorus cycling. Aust. J. Soil Res. 26, 333–342. Morel C, Tiessen H and Stewart J W B 1996 Correction for
P-sorption in the measurement of soil microbial biomass P by CHCl3fumigation. Soil Biol. Biochem. 28, 1699–1706. Myers R G, Thien S J and Piersynski G M 1999 Using an ion sink
to extract microbial phosphorus from soil. Soil Sci. Soc. Am. J. 63, 1229–1237.
NRC (National Research Council) 1984 Nutrient requirements of domestic animals, Number 4. Nutrient requirements of beef cattle. National Academy of Sciences, Washington DC, USA Oberson A, Friesen D K, Morel C and Tiessen H 1997
Determ-ination of phosphorus released by chloroform fumigation from microbial biomass in high P sorbing tropical soils. Soil Biol. Biochem. 29, 1579–1583.
Oberson A, Friesen D K, Tiessen H, Morel C and Stahel W 1999 Phosphorus status and cycling in native savanna and im-proved pastures on an acid low-P Colombian Oxisol. Nutr. Cycl. Agroecosyst. 55, 77–88.
Oehl F, Oberson A, Sinaj S and Frossard E 2001 Organic phos-phorus mineralization studies using isotopic dilution techniques. Soil Sci. Soc. Am. J. (in press).
Oshima Y and Halvorson H 1994 Regulation of phosphate meta-bolism in Saccharomyces cerevisiae. Introduction. In Phosphate in microorganisms. Eds. A Torriani-Gorini, S Silver and E Yagil p 55. Am Soc Microbiol, Washington.
Phiri S, Barrios E, Rao I M and Singh B R 2001. Changes in soil organic matter and phosphorus fractions under planted fallows and a crop rotation system on a Colombian volcanic-ash soil. Plant Soil (in press)
Pellet D and El-Sharkawy M A 1993 Cassava varietal response to phosphorus fertilization II. Phosphorus uptake and use efficiency. Field Crops Res. 35, 13–20.
Rao I M, Ayarza M A and Thomas R J 1994 The use of carbon iso-tope ratios to evaluate legume contribution to soil enhancement in tropical pastures. Plant Soil 162: 177–182.
Rao I M, Ayarza M A and Garcia R 1995 Adaptive attributes of tropical forage species to acid soils I. Differences in plant growth, nutrient acquisition and nutrient utilization among C4 grasses and C3 legumes. J. Plant Nutr. 18, 2135–2155.
Rao I M, Borrero V, Ricaurte J, Garcia R and Ayarza M A 1997 Adaptive attributes of tropical forage species to acid soils III. Differences in phosphorus acquisition and utilization as influ-enced by varying phosphorus supply and soil type. J. Plant Nutr. 20, 155–180.
Rao I M, Friesen D K and Osaki M 1999a Plant adaptation to phosphorus-limited tropical soils. In Handbook of plant and crop stress. pp 61–96. Marcel Dekker, New York, USA.
Rao I M, Borrero V, Ricaurte J and Garcia R 1999b Adaptive at-tributes of tropical forage species to acid soils. V. Differences in phosphorus acquisition from less available inorganic and organic sources of phosphate. J. Plant Nutr. 22, 1175–1196.
Renz T E, Neufeldt H, Ayarza M, J.E. da Silva and Zeck W 1999 Acid monophosphatase: an indicator of phosphorus mineraliza-tion or of microbial activity? A case study from the Brazilian Cerrados. In Sustainable land management for the Oxisols of the Latin American Savannas. Eds. R J Thomas and M A Ayarza. pp. 173–186. CIAT Cali, Colombia.
Seeling B and Zasoski R J 1993 Microbial effects in maintaining organic and inorganic solution phosphorus concentrations in a grassland topsoil. Plant Soil 148, 277–284.
Sinsabaugh R L, Antibus R K, Linkins A E, McClaugherty C.A., Rayburn L, Repert D and Weiland T 1993 Wood decomposition: nitrogen and phosphorus dynamics in relation to extracellular enzyme activity. Ecology 74, 1586–1593.
Sparling G P 1992 Ratio of microbial biomass carbon to soil organic carbon as a sensitive indicator of changes in soil organic matter. Aust. J. Soil Res. 30, 195–207.
Sparling G and Zhu C 1993 Evaluation and calibration of biochem-ical methods to measure microbial biomass C and N in soils from Western Australia. Soil Biol. Biochem. 25, 1793–1801. Stewart J W B and Tiessen H 1987 Dynamics of soil organic
phosphorus. Biogeochemistry 4, 41–60.
Tabatabai M A 1982 Soil enzymes. In Methods of soil analysis, Part 2. Chemical and microbiological properties. Eds. A L Page, R H Miller and D R Keeney. pp. 903-947. ASA, and SSSA, Madison, WI, USA.
Thomas R J 1992 The role of the legume in the nitrogen cycle of productive and sustainable pastures. Grass Forage Sci. 47, 133– 142.
Thomas R J and Asakawa N M 1993 Decomposition of leaf litter from tropical forage grasses and legumes. Soil Biol. Biochem. 25, 1351–1361.
Thomas R J and Lascano C E 1995 The benefits of forage legumes for livestock production and nutrient cycling in pasture and agro-pastoral systems of acid soils savannas of Latin America. In Livestock and sustainable nutrient cycling in mixed farming sys-tems of sub-sahara Africa. Eds. J M Powell, S Fernandez-Rivera, T O Williams and C Renard. pp. 277–291. ILCA, Ethiopia. Tiessen H and Moir J 1993 Characterisation of available P by
se-quential extraction. In Soil Sampling and Methods of Analysis. Ed. M R Carter. pp. 75–86. CRC Press, Boca Raton, FL, USA. Tiessen H and Shang C 1998 Organic matter turnover in tropical
land use systems. In Carbon and nutrient dynamics in natural and agricultural tropical ecosystems. Eds. L Bergström and H Kirchmann. pp. 1–14. CAB International.
Tiessen H, Stewart J W B and Cole C V 1984 Pathways in phos-phorus transformations in soils of differing pedogenesis. Soil Sci. Soc. Am. Proc. 48, 853–858.
Tiessen H, Salcedo I H and Sampaio E V S B 1992 Nutrient and soil organic matter dynamics under shifting cultivation in semi-arid northeastern Brazil. Agriculture, Ecosystems and Environ. 38, 139–151.
Torriani-Gorini A. 1994 Regulation of phosphate metabolism and transport. Introduction: the pho regulon of Escherichia coli. Eds. A Torriani-Gorini, E Yagil and S Silver. pp 1–4. Am Soc. Microbiol, Washington, DC, USA
Umrit G and Friesen D K 1994 Effect of C:P ratio of crop residues and soil P sorption capacity on the utilization of P from crop residues by plants. Plant Soil 158, 275-285.
Vance E D, Brookes P C and Jenkinson D S 1987 An extrac-tion method for measuring soil microbial biomass C. Soil Biol. Biochem. 19, 703–707.
Vanlauwe B, Aman S, Aihou K, Tossah B K, Adebiyi V, Sanginga N, Lyasse O, Diels J and Merckx R 1999 Alley cropping in the moist savanna of West-Africa III. Soil organic matter fractiona-tion and soil productivity. Agroforestry Syst. 42, 245–264. Walbridge M R and Vitousek P M 1987 Phosphorus mineralization
potentials in acid organic soils: processes affecting32PO4 iso-tope dilution measurements. Soil Biol. Biochem. 19, 709–717. Wanner B L 1996 Phosphorus assimilation and control of the
phos-phate regulon. In Escherichia coli and Salmonella. Ed. F C Neidhardt. pp 1357-1381. Am. Soc. Microbiol., Washington, DC, USA.
Yazaki J, Joh T, Tomida SI and Hayakawa T 1997 Acid phos-phatase isozymes secreted under phosphate-deficient conditions in Pholiota nameko. Mycoscience 38, 347–350.
Zibiliske L M 1994 Carbon mineralization. In Methods of soil ana-lysis. Part 2: Microbiological and biochemical properties. Ed. SSSA, Madison, WI, USA.