1997MNRAS.286..303H
Mon. Not. R. Astron. Soc. 286, 303-314 (1997)
New Whole Earth Telescope observations of CD-24 7599:
steps towards
0
Scuti star seismology
G. Handler,I*H. Pikall,1 D. O'Donoghue,2 D. A. H. Buc1dey,3 G. Vauc1air,4M. Chevreton,5
o.
Giovannini,6
t
s. o.
Kepler,6 P. R. Goode,7 J. L. Provencal,8 M. A. Wood,9:j:
J.
C. Clemens,lO:j: M.
s.
O'Brien,lO
R. E.
Nather,ll D.
E.
Winget,ll
s.
J.
Kleinman,ll§
A.Kanaan,ll T. K. Watson,lO,ll A. Nitta,ll M. H. Montgomery,ll E. W. Klumpe,ll
P. A. Bradley,12 D. J. Sullivan,13 K. Wu,14
T. M. K. Marar,15 S. Seetha,15 B. N. Ashoka,15
H. S. Mahra,15 B. C. Bhat,15 V.
C~
Babu,15 E. M. Leibowitz,16 S. Hemar,16 P. A. Ibbetson,16
E.
Mashal,16
E.
G. Meistas,17 W. A. Dziembowski,18 A. A. Pamyatnykh,18,19 P. Moskalik, 18
S. Zola,20 G. Pajdosz,20 J. Krzesinski,20 J. E. Solheim,21 S. Bard,21 C. M. Massacand,21
M. Breger,1 M. J. Gelbmann,1
E.
Paunzen1 and P. North22
1 Institut fUr Astronomie, Universitiit Wien, TiirkenschanzstrqfJe 17, A -1180 Wien, Austria 2 Department of Astronomy, University of Cape Town, Rondebosch 7700, South Africa 3 South African Astronomical Observatory, PO Box 9, Observatory 7935, South Africa 4 Observatoire Midi-Pyrenees, 14 Avenue E. Belin, 31400 Toulouse, France
s Observatoire de Paris-Meudon, F-92195 Meudon, Principal Cedex, France
6 Instituto de Fisica, Universidade Federal do Rio Grande do SuI, 91501-970 Porto Alegre-RS, BraVl 7 Department of Physics, New Jersey Institute of Technology, Newark, NJ 07102, USA
8 Department of Physics and Astronomy, University of Delaware, Newark, DE 19716, USA
9 Department of Physics and Space Sciences, Florida Institute of Technology, 150 W. University Blvd, Melbourne, FL 32901, USA 10 Department of Physics and Astronomy, Iowa State University, Ames, IA 50211, USA
11 Department of Astronomy and McDonald Observatory, University of Texas, Austin, TX 78712, USA
12 Los Alamos National Laboratory, XTA, MS B220, Los Alamos, NM 87545, USA
13 Physics Department, Victoria University of Wellington, PO Box 600, Wellington, New Zealand
14 Department of Mathematics, Australian National University, Canberra, Australia
IS Indian Space Research Organization, Technical Physics Division, ISRO Satellite Centre, Airport Road, Bangalore 560017, India 16 Wise Observatory, Sackler Faculty of Exact Sciences, Tel Aviv University, Tel Aviv 69978, Israel
17 Institute of Theoretical Physics and Astronomy, Gostauto 12, Vilnius 2600, Lithuania
18 Copernicus Astronomical Center; ul. Bartycka 18,00-716 Warsaw, Poland 19 Institute of Astronomy, Pyatnitskaya Street 48, Moscow 109017, Russia
20 Mount Suhora Observatory, Krakow Pedagogical University, ul. Podchoriliych 2, 30-084 Cracow, Poland
21 Institutt for Matematiske Realfag, Nordlysobservatoriet, Universitet i Troms~, 9000 Troms~, Norway
22 Institut d'Astronomie de I'Universite de Lausanne, CH-1290 Chovannes-des-Bois, Switzerland
Accepted 1996 October 5. Received 1996 September 27; in original form 1996 August 16
ABSTRACT
92
h of new Whole Earth Telescope observations have been acquired for the 0 Scuti star
CD-24 7599.
All the seven pulsation modes reported by Handler et al. are confirmed.
However, significant amplitude variations which are not caused by beating of closely spaced
frequencies occurred within two years. Analysing the combined data of both WET runs, we
detect six further pulsation modes, bringing the total number up to
13.
We also examine our
data for high-frequency pulsations similar to those exhibited by rapidly oscillating Ap stars,
but we do not find convincing evidence for variability in this frequency domain.
*E-mail: [email protected]
tGuest observer, Laboratorio Nacional de Astrofisica/CNPq, Brazil. tGuest observer, Institute for Astronomy, Honolulu, Hawaii, USA. §Guest observer, Mount Stromlo and Siding Spring Observatory, NSW, Australia.
1997MNRAS.286..303H
Handler et al.
From new colour photometry and spectroscopy we infer that CD-24 7599 is a hot
main-sequence 0 Scuti star with approximately solar metallicity and
v
sin
i
=
52
±
2
km
s
-I.yve
cannot yet propose a definite pulsation mode identification, but we report the detection of a
characteristic frequency spacing between the different modes. We ascribe it to the
simulta-neous presence of
.e
=1
and
.e
=2 modes of consecutive radial order.
A
comparison of this
frequency spacing with frequencies of solar-metallicity models, as well as stability analysis,
allows us to constrain tightly the evolutionary state
ofCD~247599.
Itis in the first
half
of its
main-sequence evolution, and has a mass of 1.85
±
0.05 M0 and a mean density of
p
=
0.246
±
0.020
P0'
This yields a seismological distance of 650
±
70 pc, which
i~as
accurate as distance determinations for
0
Scuti stars observed in clusters.
Most of the pulsation modes are pure p modes of radial order
k =4-6, but the gl mode of
.e
=2 is likely to be excited and observed as well. Since a significant contribution to this
mode's kinetic energy comes from the outer part of the convective core, CD-247599 becomes
particularly interesti1)g for testing convective overshooting theories.
Key
words:
techniques: photometric - stars: fundamental parameters - stars: individual:
CD-24 7599 - stars: oscillations -
0
Scuti.
1 INTRODUCTION
The variability of CD-24 7599 was discovered during observing run XCOV 7 of the Whole Earth Telescope (WET, Nather et al. 1990). To increase the scientific output of this WET run, the star was chosen as a second target and a high-quality data set was acquired, allowing the extraction of seven pUlsation frequencies as well as the first harmonic of one of these modes. Applying calibrations to subsequent uvby(3 photometry allowed the esti-mation of the position of CD-247599 in the Hertzsprung-Russell
(HR) diagram: according to these results, this
0
Scuti star is located near the hot border inside the instability strip on the lower main sequence. The unevolved nature of CD-24 7599 is confirmed by the star's high pulsation frequencies between 312 and 44111Hz.
The excitation of many pulsation modes with relatively high photometric amplitudes in an unevolved 0 Scuti star is extremely important for seismology of this type of pulsator: theoretically predicted frequency spectra are simpler than for evolved objects, making the task of mode identification much easier.
Moreover, linear combination frequencies were detected in the power spectrum of the XCOV 7 data; their properties were not consistent with the 'usual' explanation of such phenomena: resonant mode coupling. Their detection was somewhat surprising, because linear combination frequencies have so far only been reported for high-amplitude 0 Scuti stars. The analysis was pub-lished by Handler et al. (1996, hereafter Paper I), and the reader is referred to this paper for more information.
After removing an eight-frequency solution from the XCOV 7 light curves, the power spectrum of the residuals did not consist of
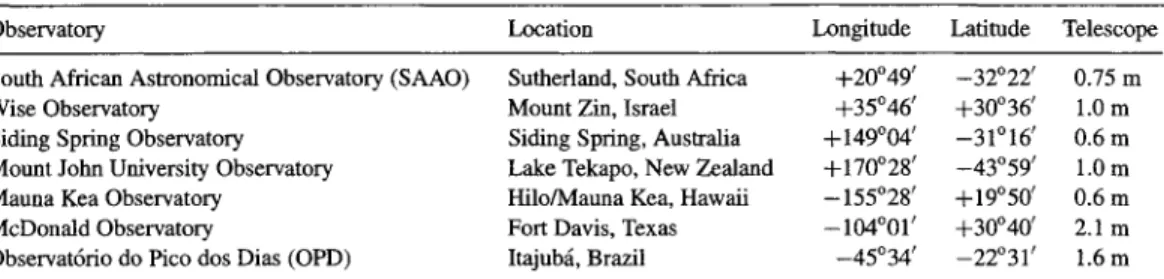
Table 1. Sites participating in the observations of CD-24 7599.
Observatory Location
white noise. The presence of a number of further pulsational modes with frequencies similar to those already detected was strongly suspected. Regrettably, due to their similar amplitudes and close spacing, we could not be confident which of the peaks were due to intrinsic stellar variability. It was therefore decided to re-observe the star with the Whole Earth Telescope. For a star as faint as CD-24 7599, with such high pulsation frequencies, and with such a complicated frequency spectrum, WET observations are required (for more details see Handler 1995a).
2 DATA ACQUISITION AND REDUCTION
2.1 WET
observations
CD-24 7599 was included as third priority target, mainly for observatories located in the southern hemisphere, in WET observ-ing run XCOV 10. High-speed photometry with an integration time of lOs was obtained with two-star and three-star photo-meters (the latter have recently been described by Kleimnan, Nather & Philips 1996). Johnson B filters were used. Whenever possible, the channel 2 comparison star was observed in channel 1 before and after the time series of CD-24 7599 was acquired. Cross-calibrations of all channels by measuring the sky brightness were done at the beginning of each run with a three-channel photometer. The participating sites and an observing log are given in Tables 1 and 2, respectively.
Two further data sets acquired during XCOV 7, which were overlooked during the busy last hours of this run, will also be
Longitude Latitude Telescope
South African Astronomical Observatory (SAAO) Sutherland, South Africa +20°49' -32°22' 0.75m
Wise Observatory Mount Zin, Israel +35°46' +30°36' 1.0m
Siding Spring Observatory Siding Spring, Australia +149°04' -31°16' 0.6m
Mount John University Observatory Lake Tekapo, New Zealand +170°28' -43°59' 1.0m
Mauna Kea Observatory HilolMauna Kea, Hawaii -155°28' +19°50' 0.6m
McDonald Observatory Fort Davis, Texas -104°01' +30°40' 2.1m
Observat6rio do Pico dos Dias (OPD) ltajuba, Brazil -45°34' -22°31' 1.6m
1997MNRAS.286..303H
New Whole Earth Telescope observations ofCD-24
7599
305
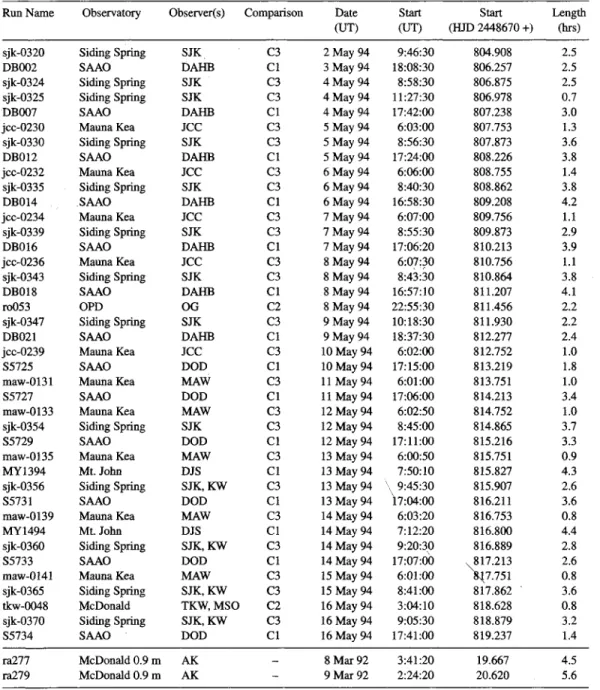
Table 2. Journal of the WET observations.Run Name Observatory Observer(s ) Comparison Date Start Start Length (UT) (UT) (HID 2448670 +) (hrs)
sjk-0320 Siding Spring SJK C3 2 May 94 9:46:30 804.908 2.5 DB002 SAAO DARB Cl 3 May 94 18:08:30 806.257 2.5 sjk-0324 Siding Spring SJK C3 4 May 94 8:58:30 806.875 2.5 sjk-0325 Siding Spring SJK C3 4 May 94 11:27:30 806.978 0.7 DB007 SAAO DARB Cl 4 May 94 17:42:00 807.238 3.0 jcc-0230 MaunaKea JCC C3 5 May 94 6:03:00 807.753 1.3 sjk-0330 Siding Spring SJK C3 5 May 94 8:56:30 807.873 3.6 DB012 SAAO DARB Cl 5 May 94 17:24:00 808.226 3.8 jcc-0232 MaunaKea JCC C3 6 May 94 6:06:00 808.755 1.4 sjk-0335 Siding Spring SJK C3 6 May 94 8:40:30 808.862 3.8 DB014 .SAAO DARB Cl 6 May 94 16:58:30 809.208 4.2 jcc-0234 MaunaKea JCC C3 7 May 94 6:07:00 809.756 1.1 sjk-0339 Siding Spring SJK C3 7 May 94 8:55:30 809.873 2.9 DB016 SAAO DARB Cl 7 May 94 17:06:20 810.213 3.9 jcc-0236 MaunaKea JCC C3 8 May 94 6:0nO 810.756 1.1 sjk-0343 Siding Spring SJK C3 8 May 94 8:43:30 810.864 3.8 DB018 SAAO DARB Cl 8 May 94 16:57:10 811.207 4.1 r0053 OPD OG C2 8 May 94 22:55:30 811.456 2.2 sjk-0347 Siding Spring SJK C3 9 May 94 10:18:30 811.930 2.2 DB021 SAAO DARB Cl 9 May 94 18:37:30 812.277 2.4 jcc-0239 MaunaKea JCC C3 10 May 94 6:02:00 812.752 1.0 S5725 SAAO DOD Cl 10 May 94 17:15:00 813.219 1.8 maw-OBI MaunaKea MAW C3 11 May 94 6:01:00 813.751 1.0 S5727 SAAO DOD Cl 11 May 94 17:06:00 814.213 3.4 maw-0133 MaunaKea MAW C3 12 May 94 6:02:50 814.752 1.0 sjk-0354 Siding Spring SJK C3 12 May 94 8:45:00 814.865 3.7 S5729 SAAO DOD Cl 12 May 94 17:11:00 815.216 3.3 maw-0135 MaunaKea MAW C3 13 May 94 6:00:50 815.751 0.9 MY1394 Mt.John DJS Cl 13 May 94 7:50:10 815.827 4.3 sjk-0356 Siding Spring SJK,KW C3 13 May 94 \9:45:30 815.907 2.6 S5731 SAAO DOD Cl 13 May 94 7:04:00 816.211 3.6 maw-0139 MaunaKea MAW C3 14 May 94 6:03:20 816.753 0.8 MY1494 Mt.John DJS Cl 14 May 94 7:12:20 816.800 4.4 sjk-0360 Siding Spring SJK,KW C3 14 May 94 9:20:30
,
816.889 2.8 S5733 SAAO DOD Cl 14 May 94 17:07:00'{l7.213
2.6 maw-0141 MaunaKea MAW C3 15 May 94 6:01:00 7.751 0.8 sjk-0365 Siding Spring SJK,KW C3 15 May 94 8:41:00 817.862 3.6 tkw-0048 McDonald TKW,MSO C2 16 May 94 3:04:10 818.628 0.8 sjk-0370 Siding Spring SJK,KW C3 16 May 94 9:05:30 818.879 3.2 S5734 SAAO DOD Cl 16 May 94 17:41:00 819.237 1.4ra277 McDonald 0.9 m AK 8 Mar 92 3:41:20 19.667 4.5 ra279 McDonald 0.9 m AK 9 Mar 92 2:24:20 20.620 5.6 Observers: SJK
=
S. J. Kleimnan, DARB=
D. A. H. Buckley, JCC=
1. C. Clemens, 00'=
O. Giovannini, DOD=
D. O'Donoghue, MAW=
M. A. Wood, DJS=
D. J. Sullivan, KW=
K. Wu, TKW=
T. K. Watson, MSO=
M. S. O'Brien.included in this study. They were reduced as described in Paper I, and we list them in Table 2 for completeness. Re-analysing the XCOV 7 data with those two runs made only small changes (within the quoted errors) to the published results.
2.2 Comparison stars
In typical WET observations, the comparison stars serve to monitor the quality of the photometric conditions, and their data are not necessarily used during the reductions. This is possible since the periods of the light variations of typical WET targets, i.e. white dwarfs, are (except in the presence of clouds) significantly shorter than the time-scales of variations of sky transparency. However, this
© 1997 RAS, MNRAS 286, 303-314
is not the case for CD-24 7599, whose pulsation periods found in Paper I were between 38 and 53 min. Therefore we intended to make use of the comparison star data to compensate for atmospheric effects as often as possible; however, since this can introduce errors, we proceeded with caution, as follows.
We selected three possible comparison stars: Cl = SAO 176755 was chosen to be the primary comparison object, since its spectral type of FO suggests that it has similar colours to the target. Hence it could also be a 5 Scuti star and its photometric constancy must be checked carefully. SAO 176755 can only be observed in channel 2 for telescopes with apertures of about 1 m. Consequently, we further selected the star GSC 6589-0348 as C2 for larger telescopes and C3 = CD-24 7591 for smaller telescopes. We did not have spectral types for C2 and C3 available, but a comparison of their
1997MNRAS.286..303H
2.5
2
1.5
...
1
ttlS
S
0.5
-
Q)0
'"C ::1...,
2
...
-
0..S
1.5
<
1
0.5
0
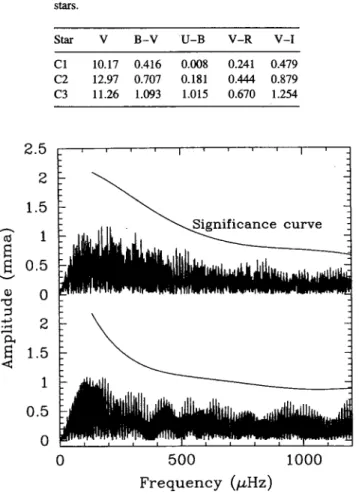
Table 3. UBV(Rl)c photometry for the comparison stars. Star V Cl 10.17 C2 12.97 C3 11.26
0
B-V U-B V-R V-I 0.416 0.008 0.241 0.479 0.707 0.181 0.444 0.879 1.093 1.015 0.670 1.254 ~ilgnljrlcan.cecurve
500
Frequency (p.Hz)
1000
Figure 1. Amplitude spectra of the reduced channel 2 star data. Upper panel: Cl
=
SAO 176755; lower panel: C3=
CD-24 7591. There is no evidence for variability of either of these stars in the investigated frequency range, as can be judged by comparison with the curve, above which we regard a peak to be significant.magnitudes on the Palomar plates suggested that they are neither extremely hot nor very cool objects ..
Still, it was felt desirable to obtain colour photometry of the comparison stars.
In
1995 March, GH acquired UBV(RI)c photo-metry of the three stars as wellas
of a number of faint E-region standards at the O.5-m telescope of the South African Astronomical Observatory. The results are summarized in Table 3, from which we can estimate that C1 is an early to mid-F star, C2 has early to mid-G spectral type and C3 is a mid-K dwarf. C2 and C3 are clearly too cool to be inside the instability strip. On the other hand, reddening might put C1 inside the instability strip. Therefore, uvbyfJ photo-metry was also obtained for C 1 (Handler 1995b), showing that it is not likely to be a short-period pulsating variable.2.3 Constancy of the comparison stars
Before reducing the programme star data, we exantined the com-parison stars for variability. A search for variations with time-scales of a day or longer, as well as for possible variations occurring on time-scales of several hours, gave negative results. Moreover, we only found occasional small « 3 per cent) signs of photomultiplier tube drift, suggesting high long-term stability of the instruments used.
It is most important to check the constancy of the comparison stars in the frequency range of interest for the programme star before constructing differential time series. Therefore we first exantined the extinction-corrected data for transparency variations by comparing the channell and 2 measurements. Those runs where we found transparency variations superposed on both the variable and comparison star data were set aside. For the remaining runs, we summed the channel 2 data in 120-s bins (as we will do later with the variable star data), converted the time of measurement into Helio-centric Julian Date (HJD), and calculated amplitude spectra for
these data (Fig. 1). .
We only plotted the amplitude spectra for comparison stars C1 and C3, since C2 was observed only for about 3 h during the WET run. Consequently, C2 was not used further in our reductions. C1 and C3 are constant. No peak in Fig. 1 even approaches the level at which we would consider it to be real (amplitude signal-to-noise ratio of 4); for the definition of this criterion see Breger et al. (1993). The shape of the significance curves is typical for variations in sky transparency (1if-component) plus scintillation noise.
The unit that we usually adopt in this study to express intensity amplitudes is milli-modulation amplitude (mma); it corresponds to a fractional modUlation of 10-3 of the mean intensity. Power spectra
are labelled in micro-modulation power (Jl.mp), where
1 Jl.mp
=
(1 mma)2.We should comment on the noise level that we achieved in the low-frequency domain: in Paper I we showed that WET performs very well for frequencies lower than 1000
JllIz.
We found the observing technique to become unreliable for frequencies lower than 80 Jl.Hz, but capable of discovering variability, with amplitudesof about 2.5 milli-modulation amplitudes (mma) between 80 and
230 Jl.Hz. Exaririning Fig. 1, we note that the noise level achieved here is even lower than that in Paper I. We can now confidently assert that our detection limit between 100 and 250 Jl.Hz for the present data set is around 1.5 mma (note that each panel in Fig. 1 contains only about 30 h of measurement). The low-frequency cut-off can be estimated to be near 120 Jl.Hz. Not surprisingly, this is somewhat higher than in Paper I, since the runs analysed here are shorter on the average.
2.4 Reduction of the programme star time series
Owing to the low count rates no correction for coincidence losses was required. Sky subtraction was performed by fitting polynomials or splines to the sky measurements of the two-channel instruments, and subtracting those fits from the data. For three-channel data, the sky measurements were multiplied by a gain ratio determined from the cross-calibrations for each of the channels. Then they were subtracted from the channell and 2 data on a point-by-point basis. However, the time series of the sky measurements was smoothed whenever possible, in order not to introduce additional scatter to the data.
Having shown that our comparison stars are constant in light, we can finally construct the time series of our measurements of CD-24 7599. Extinction corrections were performed by fitting a straight line to the magnitude versus air mass plot of the data in both channels. The intensity time series were normalized by dividing by the average count rate.
Whenever necessary, transparency variations were compensated for by dividing the time series for CD-24 7599 by that of C 1 or C3. Depending on the time-scale of the transparency variations, some smoothing of the comparison star data was applied. The degree of smoothing was chosen to give the lowest scatter in the variable star
1997MNRAS.286..303H
New Whole Earth Telescope observations ofCD-24
7599
307
light curve. In this way it is sometimes also possible to correct carefully for thin clouds. Special care was taken not to introduce artefacts during these corrections.
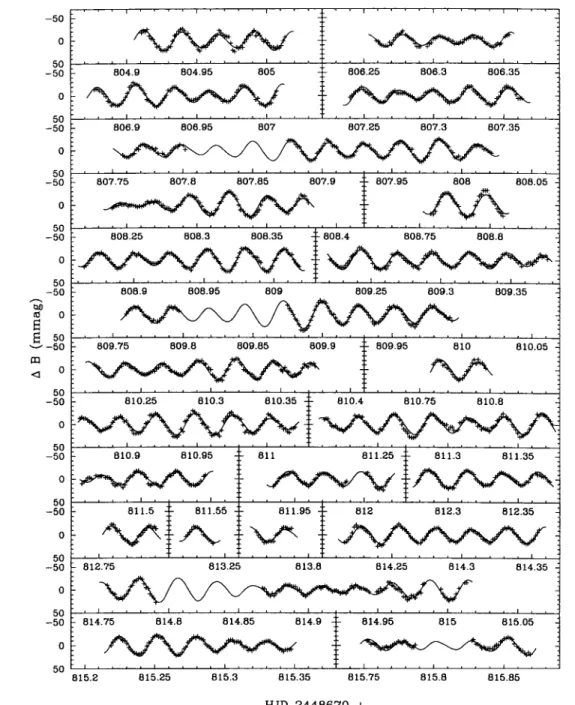
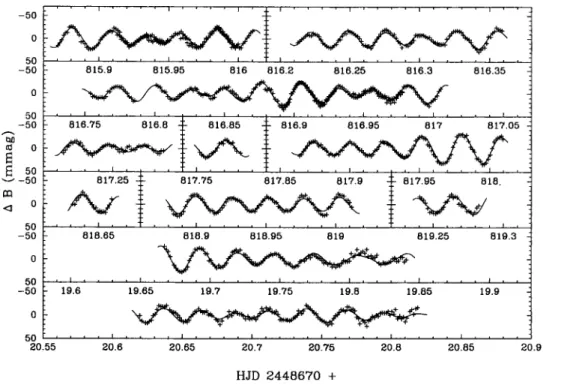
Finally, all the measurements were summed into 120-s bins, and the times of measurement of CD-24 7599 were converted into HID. The resulting light curves are shown in Fig. 2 together with a 14-frequency fit that we derive in the next section. The two additional runs acquired in 1992 are included in Fig. 2 with the 14-frequency fit for the XCOV 7 data. The light curves are plotted exactly on the same scale and by using the same units as in Paper I. In total, 92 h of photometric data were acquired during this run, corresponding to a duty cycle of 27 per cent. Considering that CD-24 7599 was only the third priority object, and that the coverage for the first priority target during this run was the best ever achieved (Nather 1995), this number of data is remarkable and emphasizes one particular strength of the Whole Earth Telescope operation: the ability to obtain good results for multiple targets. 2.5 Colour photometry of CD-24 7599
Since mode identification for 0 Scuti stars depends critically on the estimation of the radial order of the excited modes and thus depends· on the star's luminosity, gravity and temperature, the latter values must be well known. Therefore we carried out additional colour photometry ofCD-24 7599.
GH acquired Strj/Smgren as well as Johnson-Cousins photo-metry with the O.5-m telescope at SAAO (see also Section 2.1 and Handler 1995b), while EP and PN obtained measurements of the star in the Geneva system with the 0.7-m Swiss telescope at the European Southern Observatory. The results of the new Strj/Sm-gren photometry were combined with those reported in Paper I and are summarized together with the other colour photometry in Table 4.
2.6 Spectroscopy
Further constraints for pulsational models and for mode identifica-tion of a 0 Scuti star. can be gathered from the object's rotaidentifica-tional velocity and from its metal abundance. Consequently, GH took high-resolution spectra of CD-24 7599 with the Cassegrain Echelle spectrograph attached to the McDonald Observatory 2.1 m telescope on 1996 March 28 and 30. A wavelength range of 4290-4790A was covered with an effective resolution of R= 50000.
The spectra were reduced using the standard IRAF procedures and were added together into a 120-min exposure. The rotational and the radial velocity of CD-247599 were determined
by using the program ROfATE (Piskunov 1992) which yielded
vsini
=
52 ± 2 kms- I and RV=
+72 ± 2 kms-I. Furthermore, from an abundance analysis of the elements Fe, Ti and Mg, carried out with the program package Abundance Analysis Procedure (Gelbmann 1995), we estimate [MIH]=
0.0 ± 0.2.3 FREQUENCY ANALYSIS
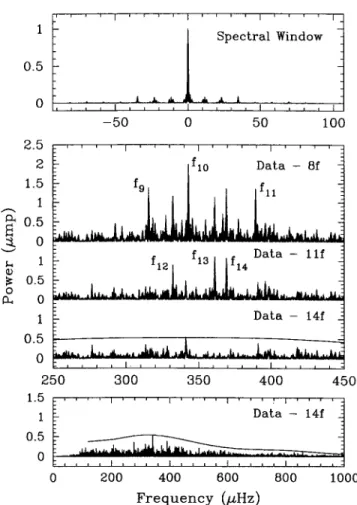
Our frequency analysis was performed using the program PERIOD (Breger 1990), the main features of which were described in Paper I. We first calculated a spectral window of our data (shown in the uppermost panel of Fig. 3). This spectral window is not as good as usually achieved by WET, but we keep in mind that CD-24 7599 had only third priority during this run, so we regard the window to be more than satisfactory.
© 1997 RAS, MNRAS 286, 303-314
We then computed power spectra of the original data as well as of pre-whitened light curves (Fig. 3). Pre-whitening was done by subtracting a synthetic light curve from the data by simultaneously optimizing the frequencies, amplitudes and phases of previously identified periodicities.
In Fig. 3 we have indicated the seven pulsation frequencies reported in Paper I. As can easily be seen from a comparison with fig. 5 of Paper I, conspicuous amplitude variations occurred within the two years between the two WET runs. However, all pulsation modes found earlier are still present, although we would not have been able to detect unambiguously more than four of these modes based only on the new data set. Moreover, f4 and f6 have very low amplitudes in the new data. On the other hand, the lowest panel of Fig. 3 clearly shows that the residuals and the shape of the significance curve are by no means consistent with noise caused by variations in sky transparency and by scintillation. Further pUlsation frequencies must be present, a conclusion that we already reached in Paper I.
Since our available data set is now larger, we can attempt to determine at least some of the additional frequencies. Because of the amplitude variations we need to be careful. Thus we calculated synthetic light curves by first optimizing the frequencies for the whole data set, and then subtracting these fits by locking the values and the phases of the frequencies over the two years, but allowing the amplitudes to be different in the two data sets. This results in somewhat higher formal residuals between light curve and fit, but it increases the reliability of the result by reducing the number of free parameters. We note that allowing the amplitudes in the solution to vary avoids the problem of picking up spurious frequencies caused by the amplitude variations. Moreover, fixing the phases in the pre-whitening procedure of the combined data set will also not cause artefacts. In case of (small) frequency/phase variations between the two WET runs a. 'mean' frequency will be obtained, completely accounting for such effects.
Consequently, we removed such an eight-frequency fit from the data. However, severe aliasing is present, since the two data sets are of 11- and 14-d duration, respectively, spaced by about 800d. Therefore we deteqnined the residuals between the light curve and our fit for several trial frequencies, and adopted the value that yielded the lowest residuals. Although such an approach can only result in formal frequency values, we believe that it is much more credible than other procedures (especially in the presence of amplitude variations), e.g. simply adopting the highest peak in the original or pre-whitened power spectra.
We calculated the power spectrum of the residuals and dis-covered several significant peaks. Following the procedure above, we determined the values of these frequencies step by step (check-ing whether new frequencies affect the other values and adjust(check-ing them, if necessary) by calculating a simultaneous n-frequency fit to the data, until no new frequencies could be identified with con-fidence. Some steps of the pre-whitening process are shown in Fig. 4; the significance curve in the lowest panel clearly confirms our detections. The resulting 14-frequency fit to the data of both WET runs is listed in Table 5. The amplitude variations offl
'/2,13'/4
andf9 are considered to be significant, andf6,fll andf14 are also likely to have changed their amplitudes within the two years between the two WET runs. We shall discuss the amplitude variations in detail elsewhere (Handler et al., in preparation), including additional time-series photometry. It should also be noted that the signal-to-noise ratio of the modes (determined following Breger et al. 1993) detected in Paper I is now larger (resulting in 12 formally significant peaks), since part of the
1997MNRAS.286..303H -50 0 50 -50 804.9 804.95 805 806.25 806.3 806.35 0 50 -50 0 50 -50 0 50 -50 0 50 -50
-
t:>IJ III 0E!
E!
50 '-" -50 810.05 a:I <Io
811.5 811.55 811.95 812 812.3 812.35 815.2 815.25 815.3 815.35 815.75 815.8 815.85 HJD 2448670+
Figure 2. B light curves and the corresponding 14-frequency fit (derived in Section 3) for the new WET data on CD-24 7599. The two older runs plus the 14-frequency fit taken from Paper I are also shown.
residual 'noise' left in the old solution is due to frequencies intrinsic to CD-24 7599.
After removing our new l4-frequency solution from the data, the residual power spectra are still not consistent with white noise. Although non-white noise could in part be generated as an artefact of pre-whitening, we think that there are still intrinsic frequencies left in the residuals. Our new frequency solution leaves an rms residual of 4.0 mma per single measurement in the XCOV 7 data and 3.5 mma per single measurement in the XCOV 10 data. The better quality of the new data is attributable to a number of reasons: the use of three-star photometers at some sites, the ability to correct carefully for transparency variations, the facts that CD-24 7599 was observed in channell (less bad points), that the measurements were taken at lower average air mass, etc.
In
the second lowest panel of Fig. 4, we can identify a peak: near 340 ~Hz, which is significant according to our convention. However,this peak is only prominent in the 1992 data, while there seems to be just a normal noise peak: at this frequency in the 1994 data. This prevents us from suggesting that the 34O-~Hz peak: is real. It should also be noted that this peak is very near to aliases off3 andf4 and could therefore be affected during pre-whitening, since the new data have a more complicated window pattern. The same comment applies to a peak near 398 ~Hz, which was already regarded to be promising in Paper I. We hasten to add that we would not have been able to detect all frequencies in Table 5 without whitening. We consider pre-whitening to be a very useful method, but only when applied carefully.
In
Paper I, we reported the detection of linear combination frequencies in our power spectra. Consequently, we also examined1997MNRAS.286..303H
New Whole Earth Telescope observations ofCD-24
7599
309
-50 0 50 -50 0 50 -50 ,-... t>O ttl 0
S
S
50 ... -50 817.25 Ql <l 0 50 -50 818.65 818.9 818.95 819.25 819.3 0 50 -50 19.6 19.65 19.9 0 50 20.55 20.6 20.65 20.7 20.75 20.8 20.85 20.9HJD 2448670
+
Figure 2 - continuedTable 4. Johnson-Cousins, updated Strf<lmgren-Crawford and Geneva photometry of CD-24 7599.
V B-V U-B V-R V-I
11.50 0.343 0.228 0.204 0.436 ±0.01 ±0.OO7 ±0.010 ±0.OO7 ±0.01O
V b-y ml CI
fJ
11.50 0.225 0.150 0.982 2.871 ±0.01 ±0.OO8 ±0.013 ±0.013 ±0.015 mv B2-Vl d m2 ga
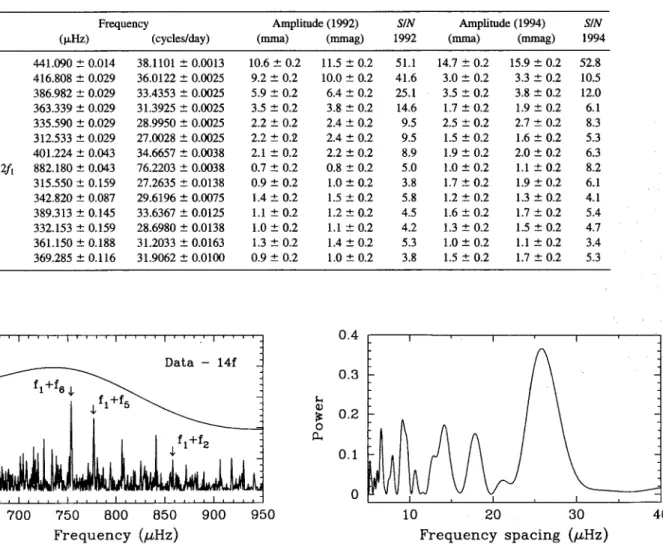
ll.47 0.144 1.318 -0.504 0.089 0.455 ±0.01 ±0.OO8 ±0.014 ±0.014 ±0.014 ±0.014this data set for such peaks. The power spectrum in the respective frequency range is shown in Fig. 5 (after pre-whitening of the 14-frequency solution in order to avoid spectral leakage into the high-frequency domain: see Breger et al. 1996), and some linear combination frequencies can again be discerned, although they are not significant. We note, however, that the noise in this frequency region is not white as well (which can best be seen by examining the shape of the significance curve), suggesting that intrinsic frequencies are present in this domain. We regard this as a confirmation of the presence of linear combination frequencies in the light curves of CD-24 7599.
We also analysed the behaviour of the star at high frequencies. In Paper I, we briefly reported a null result for a search for frequencies similar to those of rapidly oscillating Ap stars or solar-like oscilla-tions. Recently, Breger et al. (1996) examined the high-frequency domain for the 5 Scuti star FG Vrr in detail. They did not find evidence for variability with frequencies between 1 and 10 mHz.
In Fig. 6, we show a power spectrum of the combined, unbinned XCOV 7 and XCOV 10 data at high frequencies. Pre-whitening in the low-frequency domain was again performed to avoid spectral leakage
© 1997 RAS, MNRAS 286, 303-314
to higher frequencies. In the 1992 data from SAAO, a spurious periodicity due to a periodic tracking error was removed before this analysis was performed. This tracking error was also found in other studies and has been corrected (see Martinez 1993). Consequently, no such effect was found in the 1994 SAAO data. There is no evidence for high-frequency variability intrinsic to CD-24 7599.
Finally, we searched for a characteristic frequency spacing between the modes of CD-24 7599, as this could indicate either rotational splitting or the excitation of consecutive radial over-tones. 1 To search for such a splitting, we performed a Fourier
analysis of our pulsation frequencies, assuming unit amplitude for all peaks. The latter makes the method insensitive to effects of mode driving, amplitude variations, inclination, etc. Consequently, we will obtain information about possible regular frequency spacings present, in analogy to the spectral window of photometric time series: if the data points are equally spaced, the window has maxima at the sampling frequency and its harmonics (see Kurtz 1983 for an illustration). The result of this analysis is shown in Fig. 7.
The highest peak in Fig. 7 corresponds to a frequency spacing of 26 jJ.Hz, and the two peaks next to it represent spacings near 18 and 14 jJ.Hz. To assess the significance of this detection, we created artificial power spectra consisting of 13 random frequencies between 310 and 445 jJ.Hz and searched them for characteristic spacings between 20 and 35 jJ.Hz with the same method as described above. In less than 3 per cent of all trials we obtained peaks at least as high as the 26-jJ.Hz peak in Fig. 7. Therefore we consider the detection of a characteristic frequency spacing of 26 jJ.Hz in the power spectra of CD-24 7599 to be statistically significant. The meaning of this result will be discussed in Section 4.2.
IOf course, for low-overtone pulsators such as 0 Scuti stars, one cannot expect to find the asymptotic frequency spacing. However, the deviations from a regular frequency spacing are small even for low radial overtones, and so some regularity in the power spectrum can be expected if a large number of possible pulsation modes are excited to visible amplitude.
1997MNRAS.286..303H
Handler et al.
1 0.5o
250 200 150 100 50o
10 I I Spectral Window -150 -100 -50o
50 100 150 Datao
~~~~~~~~~~---~ 5 Data - 3f...
Po.[
0
... 4 2 Data - 4fo
~~~~Mn~~~N-~~____
~~ 4 2 Data - 5fo
~~~~Mn~~~~__
~______
~ 4 Data - 7f 2 O~~~~~~~~~~~ 250 300 350 400 450 500 550 600 700 750 BOO 'B50 900 950 1000 1050 6 42
o
o
200 Data - Bf 400 600 800 1000Frequency (J.£Hz)
Figure 3. Spectral window and power spectra for the XCOV 10 data of
CD-24 7599. The peaks already identified in Paper I are indicated with the same designations as in the first paper.
4 THE POSITION OF CD-24 7599 IN THE HRDIAGRAM
4.1 Colour photometry
With the new colour photometry at hand (Table 4), we can revise the position of CD- 24 7599 in the HR diagram. We start with a check of the consistency of the Strj1Smgren-Crawford and 10hnson-Cousins data.
Applying the calibrations of Crawford (1979) to the
Strj1Smgren-Crawford photometry, we determine E(b - y)
=
0.154,(b - Y)o
=
0.071, om!=
0.003 and oe!=
0.039. This also yieldsM"
=
1.97. A comparison of (b - Y)o and E(b - y) withthe UBV(Rl)c photometry of Table 4 by using the relations of
...
1 0.5o
2.5 2 1.5 1 Po. 0.5[
0
...'"'
OJ -50 I I Spectral Window 1 do . .010 Io
50 Data - Bf f11 100 ~ 0.5o
p., O~MA...lw...oIoA.t.oUIII ... IAtU"illlAllIIoIiMlMIUliIIIlII""WIILti~ 1 0.5o
250o
Data - 14f 300 350 400 450 200 400 600 800 1000Frequency (J.£Hz)
Figure 4. Spectral window and power spectra for the combined XCOV 7 and
XCOV 10 residuals of CD-24 7599. Six new pulsation frequencies are found.
Caldwell et al. (1993) suggests that the measurements in these two systems are consistent with each other within the observational uncertainties.
Now we can use Kurucz's (1991) model atmospheres to estimate Teff
=
8400±
150 K and log g=
4.25±
0.15 for CD-24 7599, which correspond to a slightly more evolved evolutionary state than suggested in Paper I (however, also with the new data, the star is still close to the zero-age main sequence, or ZAMS). Furthermore, Smalley's (1993) calibration supplies [MJH]=
0.05 ± 0.15.Making use of the Geneva photometry, we can deredden
B2 - VI, since E(b - y) is known (all other Geneva indices
listed in Table 4 are reddening-free). With a ratio
E(B2 - Vl)IE(b - y) = 1.146, this yields (B2 - Vl)o = -0.032. Next, we apply the new calibrations of KiinzIi (1994) and derive Teff
=
8250 ± 150 K and log g=
4.25 ± 0.15. From the reference sequence of Hauck et al. (1991), we infer t:.m2=
-0.041. Berthet's (1990) calibration then provides [MJH]=
-0.19 ± 0.14.Thus the colour photometry suggests that CD-247599 is a
main-sequence star with Teff
=
8300±
200 K and log g=
4.25±
0.15, and with approximately solar metal abundance. The error bars given here were chosen to yield best agreement between the different determinations and are therefore conservative. According to the results above, the values for the pulsation constants Qi of the different modes, as derived and listed in Paper I, decrease by 19 per cent (or 10).1997MNRAS.286..303H
New Whole Earth Telescope observations ofCD-24 7599
311
Thble 5. Frequencies of the
a
Scuti star CD-247599 with an amplitude signal-to-noise ratio larger than 4. The frequencies given yield the lowest residuals between observed light curve and fit, but can only be seen as fonnal values. The frequency errors are estimated from our trial fits and should be realistic; they are integer multiples of the spacing of the aliases (ln99 d).Frequency Amplitude (1992) SIN Amplitude (1994) SIN
II
h
13
14
Is
16
h
Is
=
2/1
19
110
111
112
113
114
0.5
.-... 0.4
Po.[ 0.3
' - ' s..0.2
Q) ~ 00.1
Il..0
650
700
(IlHz) (cycles/day) 441.090 ± 0.014 38.1101 ± 0.0013 416.808 ± 0.029 36.0122 ± 0.0025 386.982 ± 0.029 33.4353 ± 0.0025 363.339 ± 0.029 31.3925 ± 0.0025 335.590 ± 0.029 28.9950 ± 0.0025 312.533 ± 0.029 27.0028 ± 0.0025 401.224 ± 0.043 34.6657 ± 0.0038 882.180 ± 0.043 76.2203 ± 0.0038 315.550 ± 0.159 27.2635 ± 0.0138 342.820 ± 0.087 29.6196 ± 0.0075 389.313 ± 0.145 33.6367 ± 0.0125 332.153 ± 0.159 28.6980 ± 0.0138 361.150 ± 0.188 31.2033 ± 0.0163 369.285 ± 0.116 31.9062 ± 0.0100Data - 14f
750
800
850
900
Frequency (J-LHz)
(mma) 10.6 ± 0.2 9.2 ± 0.2 5.9 ± 0.2 3.5 ± 0.2 2.2 ± 0.2 2.2 ± 0.2 2.1 ± 0.2 0.7 ± 0.2 0.9 ± 0.2 1.4 ± 0.2 1.1 ± 0.2 1.0 ± 0.2 1.3 ± 0.2 0.9 ± 0.2950
Figure 5. Power spectra for the XCOV 10 data of CD-24 7599 in the range where linear combination frequencies can be found. Some of these frequen-cies are again present.
0.1
0.08
.-... p..[ 0.06
' - 't
0.04
~ oc::0.02
o
1 2 3Data - 14f
4 5 6 7 8 910
Frequency (mHz)
Figure 6. Power spectra of the combined XCOV 7 and XCOV 10 data of CD-24 7599 in the high-frequency domain. No convincing evidence for high-frequency oscillations of the star can be found.
© 1997 RAS, MNRAS 286, 303-314 (mmag) 11.5 ± 0.2 10.0 ± 0.2 6.4 ± 0.2 3.8 ± 0.2 2.4 ± 0.2 2.4 ± 0.2 2.2 ± 0.2 0.8 ± 0.2 1.0 ± 0.2 1.5 ± 0.2 1.2 ± 0.2 1.1 ± 0.2 1.4 ± 0.2 1.0 ± 0.2 0.4
0.3
s.. Q) ~0.2
o
Il..0.1
o
1992 (mma) (mmag) 1994 51.1 14.7 ± 0.2 15.9 ± 0.2 52.8 41.6 3.0 ± 0.2 3.3 ± 0.2 10.5 25.1 3.5 ± 0.2 3.8 ± 0.2 12.0 14.6 1.7 ± 0.2 1.9 ± 0.2 6.1 9.5 2.5 ± 0.2 2.7 ± 0.2 8.3 9.5 1.5 ± 0.2 1.6 ± 0.2 5.3 8.9 1.9 ± 0.2 2.0 ± 0.2 6.3 5.0 1.0 ± 0.2 1.1 ± 0.2 8.2 3.8 1.7 ± 0.2 1.9 ± 0.2 6.1 5.8 1.2 ± 0.2 1.3 ± 0.2 4.1 4.5 1.6 ± 0.2 1.7 ± 0.2 5.4 4.2 1.3 ± 0.2 1.5 ± 0.2 4.7 5.3 1.0 ± 0.2 1.1 ± 0.2 3.4 3.8 1.5 ± 0.2 1.7 ± 0.2 5.310
20
30
40.Frequency spacing (J-LHz)
Figure 7. Search for the presence of a regular frequency spacing within the 13 pulsation modes of CD-24 7599. The highest peak corresponds to a frequency spacing of 26
!LBz
and is statistically significant (see text).4.2 Model calculations
Given the observed pulsation frequencies, temperature, surface gravity and metallicity, we now face the theoretical challenge of trying to construct stellar models that will satisfy the observation-ally derived constraints. To compute the models, we have used the standard stellar evolution code which was developed in its main parts by B. Paczynski, M. Kozlowski and R. Sienkiewicz. The same code was applied previously in the study of FG VIr (Breger et al. 1995a) .. We used the latest versions both of the OPAL opacity tables (Iglesias et al. 1995) and of the OPAL equation of state (Rogers, Swenson & Iglesias 1996) which were copied from Lawrence Livermore National Laboratory by file transfer protocol
(FTP). The effects of slow solid-body stellar rotation were taken into account together with the assumption about conservation of the global angular momentum during the evolution of the star from the ZAMS.
We calculated the models assuming an initial hydrogen abun-dance X
=
0..70. and a heavy element abundance Z=
0..0.2. We used the standard mixing-length formalism for convection adopting the1997MNRAS.286..303H
Handler et al.
parameter ex = 1. This choice has a negligible effect on the model's parameters (see also Audard & Provost 1994). Stellar masses from 1.75 to 2.05 ~ were considered in steps of 0.05 M0 . Since we only have a lower limit to the rotational velocity of CD-24 7599, we computed three sequences with Vrot = 75, 125 and 175 kms-1 on
the ZAMS. For this choice of parameters, the models that fit the values of T eff and log g derived in Section 4.1 are in the main-sequence stage of stellar evolution. We note that the assumption of global angular momentum conservation results "in only a small change of the rotational velocity during main-sequence evolution: the model with Vrot
=
100 kms-1 on the ZAMS will have Vrot=
93 km s -1 at the end of the main-sequence stage.
For the models considered we Performed a linear non-adiabatic analysis of low-degree oscillations (e $ 2). The effects of slow rotation on the oscillation frequencies were calculated up to second order in the rotational velocity using the method developed by Dziembowski & Goode (1992). In these oscillation calculations we neglected the Lagrangian perturbation of the convective flux. The choice of ex has again a negligible effect on mode frequencies in the frequency range of interest, but has a non-negligible effect on mode stability. For the models used here an increase of ex promotes instability and results in some increase of the frequency range of the unstable modes.
We are now in a position to apply two different methods to determine the position of models matching CD-24 7599 in the HR diagram. First, we performed a stability analysis of the pulsation modes: as a 0 Scuti star model evolves from the ZAMS, instability first occurs at high p-mode frequencies (and high overtones). As the radius of the star increases, the excited p-mode spectrum shifts to lower frequencies. Additionally, lower radial overtones become excited as well (this is illustrated, for example, by Dziembowski 1995).
Consequently, we can compare the unstable model frequencies with the modes actually excited to observable amplitude (assuming that there are no further modes outside the range of pulsation frequencies detected so far) as the model evolves, and we can derive a range of possible effective temperatures for given mass. We performed this procedure for models in the range of 1. 75-2.00 M0 . For more massive models the theoretically expected and observed frequency ranges did not match anymore; most of the modes between 312 and 441 ~Hz were stable. To account for the unknown rotation rate of CD-24 7599, we averaged the results of the stability analysis over the different rotational velocities of the models and increased the error bar in the effective temperature accordingly.
"For lower mass models, the range of unstable model frequencies becomes larger than the observed one, and therefore the error size of the determination of possible model effective temperatures increases. Moreover, this comparison can only be done for model frequencies of m = O. Thus rotational splitting may affect the result. We incorporated this in our error estimate. The position of models matching the observed frequency range of CD-24 7599 will be displayed in Fig. 9 below.
The second method to determine the position of the star in the HR diagram uses the frequency spacing derived in Section 3. Let us first explain its origin. If it were caused by rotational splitting, CD-24 7599 would need to rotate with v
=
190 kms-1 (adoptingthe values of T eff and log g determined in Section 4.1 and
M
=
1.85 M0)' However, at such large rotation rates the rotation-ally split pattern becomes asymmetric due to second-order effects of rotation. Therefore the detection of a 26-~ spacing due to rotational splitting is not expected.1.0
0.8
0.6
0.4
0.2
O.O~~~~~~~~~~~~-J300
350
400
450
Frequency
(flHz)
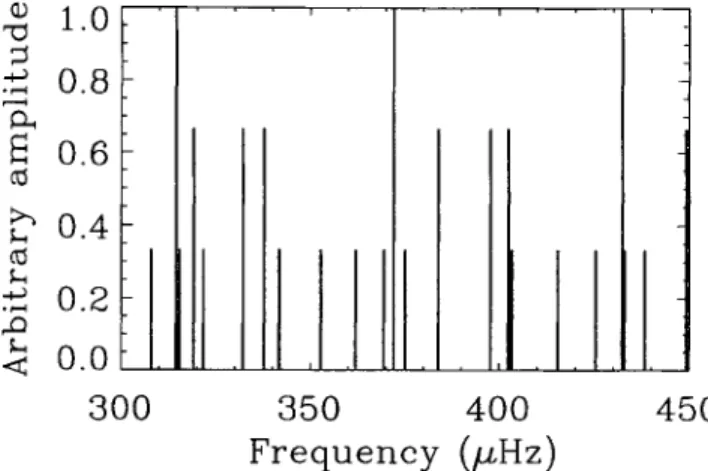
Figure 8. Schematic amplitude spectrum of
e
= 0-2 andIml
:s;e
pulsation frequencies for one possible model of CO-24 7599 (see text for its parameters). The modes are of radial order k = 3-5. Peaks with an amplitude of 1.0 represent radial modes, those with 0.67 amplitude corre-spond to dipole mode frequencies, while peaks with amplitudes of 0.33 are at frequencies of quadrupole modes.Another possibility is that this frequency spacing is caused by the presence of consecutive radial overtones of the same
e.
For illustration, we computed a model of CD-24 7599 with parameters close to those inferred in Section 4.1 (M = 1.85M0 , log Teff = 3.920, log L=
1.147, thus log g=
4.20) with Vrot =75 km S-1, and plot its pulsation frequencies in Fig. 8.
As can be seen, consecutive modes of equal
e
and m have approximately the same frequency spacing even at low overtones. However, a spacing of 26 ~Hz would correspond to a post-main-sequence evolutionary state of the star (e.g. Heller & Kawaler 1988), even though we do not measure the asymptotic value. Modes of consecutive radial order in Fig. 8 have a spacing of about 60 ~Hz.On the other hand, the m = 0 components of
e
= 2 modes are approximately intermediate in frequency compared with thee :;::
1 modes of the same k and k - 1. Consequently, if modes of bothe
= 1 ande
=
2 were excited in CD-24 7599, we would expect to see half of the spacing of consecutive overtones of the samee
(a suspicion which already emerges from a close look at Fig. 8). To check this idea, we performed the Fourier analysis described at the end of Section 3 for the model frequencies. The considered model frequency range matched the range actually excited in the star.The resulting power spectra closely resembled Fig. 7. By comparing the location of the highest peaks in the spectral window with the model frequencies, we verified that this analysis indeed returns a value for half the frequency spacing of modes of consecutive radial overtones with the same
e
and m. Now we can also explain the peaks at spacings of 18 and 14 ~Hz in Fig. 7: they are harmonics of the basic spacing of 54.0 ~Hz, like the 26-~Hz peak.We performed several further tests to verify the validity and applicability of this analysis tool. For instance, we determined the location of the highest peak for several trial model frequency spectra when we assumed different rotation rates (which change the 'noise properties'). We found that the method is reliable when carefully applied.
Finally, we determined the error size for a frequency spacing of 54.0 ~. We considered a number of model frequency spectra, randomly selected 13 modes in the range of 310-445 ~Hz and analysed them in the same way as the observed frequencies. From
1997MNRAS.286..303H
New Whole Earth Telescope observations ofCD-24
7599
313
these simulations we estimate that the accuracy of our detenni-nation is ::!::2.3IJ-Hz. We would like to make a technical comment here: the frequency spacing analysis performed above seems to be a very powerful tool to investigate the frequency spectrum of " Scuti stars and other multimode pulsators. However, it must be noted that the frequency spectrum of CD-24 7599 is particularly well suited to this method: the star has a large number (about 40 per cent) of all possible (e :$ 2) modes excited (cf. Fig. 8), and pulsates in only a few radial overtones. For stars with only a few observed modes or for objects whose theoretical frequency spectra are very dense, we do not expect this technique to be very helpful.
As the mean frequency spacing of 54.0 ::!:: 2.3 IJ-Hz found for CD-24 7599 is a measure of the sound crossing time through the object, we can use it to determine its mean density. To be as objective as possible, we decided to adopt the following procedure: we selected a sequence of five models along their main-sequence evolutionary track in the HR diagram in steps of 0.005 in log Teff,
roughly centred on a frequency spacing of 54 IJ-Hz in the 300-450
IJ-Hz
range. The same mass and rotational velocity ranges as for the stability analysis were considered. The pulsation modes were then searched for equal frequency spacings with the Fourier technique described above. We used all modes in the frequency range excited in CD-24 7599. This is a worst case assumption: rotationally split modes as well as g modes introduce 'noise', and therefore the error bars that we obtain are conservative. As in the stability analysis, we found a dependence of the resulting frequency spacing on the star's rotation rate. This was again taken into account when estimating the error size.As the model evolves along the main sequence, the sound traveltime across the object increases and thus the spacing of consecutive overtones of the same
e
and m decreases. Conse-quently, we can, at given mass, infer the effective temperature of the model matching the 54.0-1J-Hz spacing best by fitting a straight line to a frequency spacing versus effective temperature plot. 2 Withthese parameters in hand, we can easily calculate the mean density of the best matching model.
We found no dependence of the mean density of the best matching models on mass, as may be suspected. This allows us to determine the mean density of the most promising models of CD-24 7599 to be 0.246::!:: 0.020P0. The main contribution to the size of this error comes from the uncertainty of the mean frequency spacing of the observed modes. We note that there could be systematic errors in this determination, e.g. the star may have a metallicity different from the assumed Z
=
0.02. Then the evolu-tionary tracks of the models would change and the instability would shift to (slightly) different overtones. Therefore the ratio of the determined frequency spacing to the asymptotic value and thus to the mean density would change. However, some tests (like employ-ing a different equation of state in the models) suggest that this would alter our results only within the quoted errors. Anyway, the results of model calculations reported here are only a first step in the seismological investigation of the star; a more complete account will be given by Pamyatnykh et al. (in preparation).Before we start to point to a definite mode identification, we will compare and discuss our constraints on the position of CD-24 7599 in the HR diagram. They are summarized in Fig. 9.
2Tbis assumes that the model evolves along a track described by a straight line in the theoretical HR diagram. For the small temperature range that needs to be considered and for stellar evolution on the main sequence, this is correct within the errors of the determination of the frequency spacing.
© 1997 RAS, MNRAS 286, 303-314
1.6
1.4
1
0.8
4
3.95
I3.9
log
Teff / / / /3.85
Figure 9. Determination of the position of CD-247599 in the HR diagram. Full lines correspond to some of our evolutionary tracks for Z = 0.02 The star symbol denotes the position of the star determined from colour photometry, while the dashed-dotted box represents the corresponding error size. The dots with the horizontal error bars are possible positions of the star determined from our stability analysis. The straight line connects models with mean densities of 0.246 ± 0.020 P0. Finally, the observed red and blue edges of the instability strip taken from Breger (1995, dashed lilies) as well as the theoretical blue edge of our models (dashed-triple dotted line)
are indicated. '
The results of our different independent analyses agree well. The model calculations suggest a slightly more evolved evolutionary state for the star than does the colour photometry, but this is well within the errors. Taking all our constraints together, we infer that CD- 247599 is in the first half of its main-sequence evolution and is best represented by a model wit)l Z
=
0.02, M=
1.85 ::!:: 0.05 M0 andp
= 0.246 ::!:: 0.020 P0. Thi~ yields R = 1.96 ::!:: 0.07 ~ andL
=
14.7 ::!:: 1.6L0 , allowi,ng us to infer a distance to the star of 650::!:: 70 pc. This seismological distance to CD-24 7599 is as accurate as distance estimates that one can derive, for" Scuti stars in clusters. We also note that independent model calculations' by Bradley & Guzik (1996) give results consistent with those presented in this paper.Now we can compare our pulsation frequencies with those of our best matching models. We define the fundamental radial mode to be
k
=
1. Most of the excited modes are pure p modes, for which threeovertones (k = 4-6) are present. Consequently, we cannot €;xplain all 13 modes with only
e
=
0 ande
=
1. Moreover, it is aiso impossible that exclusivelye
= 0 ande
= 2 modes are seen: otherwise the frequency spacing analysis would have revealed the 54-IJ-Hz spacing (and not only its harmonics), since the m = 0 component ofe
=
2 modes has a frequency only a few IJ-Hz different from that of the radial mode with the same k. Thus bothe
= 1 ande
= 2 modes must be present.Turning to rotational splitting, we can infer a lower limit to the star's rotational frequency from its
v
sin i and its radius determined above. This yields Prot 2: 5.9IJ-Hz. Even at this low rotation rate, second-order effects of rotation become important and destroy the frequency symmetry of the rotationally split peaks in the power spectrum. Without any further constraint on thee
values of the individual modes, we did not find clues for deciding which modes belong to the same rotationally split multiplets. In this context it should be noted that non-linear calculations fore
= 1 modes (Buchler, Goupil & Serre 1995) predict equal frequency spacings1997MNRAS.286..303H
Handler et al.
within the triplets independently of the stellar rotation rate; an observational examination of this effect has to await definite mode identifications.
Interestingly, in models with mean densities matching that inferred for CD-24 7599, one g mode for € = 2 is excited at a frequency of about 350 IJ.Hz. This mode originates as the gl mode on the ZAMS and, since a significant fraction of its kinetic energy comes from the outer part of the convective core, it can be taken as a test for convective overshooting theories (Dziembowski &
Pamyatnykh 1991). It is interesting to note that the observed frequency spectrum of CD-24 7599 is denser around 350 IJ.Hz
than at higher frequencies. This can be taken as evidence that this gl mode is actually observed in CD-24 7599. If so, the star becomes particularly interesting for seismology.
5 SUMMARY AND CONCLUSIONS
The 0 Scuti star CD-24 7599 has been re-observed with the Whole
Earth Telescope. At least 13 pulsation modes are excited in this object. With the help of new colour photometry as well as model calculations, we have shown that the star is best represented by models of solar metallicity with mass 1.85
±
0.05 M0 andP
= 0.246 ± 0.020P0.
We have inferred a seismological distance of 650 ± 70 pc. The star is in the first half of its main-sequence evolution and it pulsates mainly with p modes of k = 4-6. Both€
=
1 and€
=
2 modes are present and about 40 per cent of all the possible modes have been detected by us. However, one gl mode for€
= 2 may be excited as well, thus making CD-24 7599 an excellent candidate to test convective core overshooting, one of the most important parameters for stellar evolution calculations.Therefore it is of considerable importance to continue to study the star comprehensively. Detailed theoretical investigations are underway (Pamyatnykh et al., in preparation). Another extended photometric campaign [similar to that for the 0 Scuti star FO VIr, for which Breger et al. (1995b) acquired about 550h of data] to detect even more pulsation modes ought to be undertaken. As already pointed out in Paper I, the observations should be done in more than one filter to be able to determine the
€
values of the pulsation modes of the highest amplitudes, thus increasing our chances of finding a secure mode identification. Then precision asteroseismology of a normal main-sequence star should be possible.ACKNOWLEDGMENTS
This work was partially supported by the Austrian Fonds zur
Forderung der wissenschaftlichen Forschung under grant S-7304. OH thanks Nathalie Audard for useful comments on a draft version of this paper.
REFERENCES
Audard N., Provost J., 1994, A&A, 282, 73 Berthet S., 1990, A&A, 236, 440
Bradley P. A., Guzik J. A., 1996, BAAS, 27,1430 Breger M., 1990, Commun. Asteroseism., 20, 1
Breger M., 1995, in Stobie R. S., Whitelock P. A., eds, ASP Conf. Ser. Vol. 76, Astrophysical Applications of Stellar Pulsation. Astron. Soc. Pac., San Francisco, p. 596
Breger M. et al., 1993, A&A, 271, 482 Breger M. et al., 1995a, A&A, 297, 473
Breger M. et al., 1995b, Commun. Asteroseism., No. 83 Breger M. et al., 1996, A&A, 309, 197
Buchler J. R., Goupil M.-J., Serre T., 1995, A&A, 296, 405
Caldwell J. A. R., Cousins A. W. J., Ahlers C. C., van Wamelen P., Maritz E. J., 1993, S. Afr. Astron. Obs., Cire., 15, 1
Crawford D. L., 1979, AJ, 84, 1858
Dziembowski W. A., 1995, in Stobie R. S., Whitelock P. A., eds, ASP Conf. Ser. Vol. 76, Astrophysical Applications of Stellar Pulsation. Astron. Soc. Pac., San Francisco, p. 586
Dziembowski W. A., Goode P. R., 1992, ApJ, 394, 670 Dziembowski W. A., Pamyatnykh A. A., 1991, A&A, 248, L11 Gelbmann M. J., 1995, Commun. Asteroseism., 89, 1 Handler G., 1995a, Baltic Astron., 4, 434
Handler G., 1995b, Inf. Bull. Variable Stars, 4216 Handler G. et al., 1996, A&A, 307, 529 (paper I)
Hauck B., Jaschek C., Jaschek M., Andrillat Y., 1991, A&A, 252, 260 Heller C. H., Kawaler S. D., 1988, ApJ, 329,lA3
Iglesias C. A., WIlson B. G., Rogers F. J., Goldstein W. H., Bar-Shalom A., Oveg S., 1995, ApJ, 445, 855
Kleinman S. J., Nather R. E., Philips T., 1996, PASP, 108, 356
Kiinzli M., 1994, Master's thesis, University of Lausanne Kurtz D. W., 1983, Inf. Bull. Variable Stars, 2285 Kurucz R. L., 1991, Van Vleck Obs. Contrib., 11,27 Martinez P., 1993, PhD thesis, University of Cape Town Nather R. E., 1995, Baltic Astron., 4, 321
Nather R. E., Winget D. E., Oemens J. C., Hansen C. J., Hine B. P., 1990, ApJ, 361, 309
Piskunov N. E., 1992, in Glagolevskij Y. V., Romanyuk I. I., eds, Stellar magnetism. Nauka, St Petersburg, p. 92
Rogers F. J., Swenson F. J., Iglesias C. A., 1996, ApJ, 456,902 Smalley B., 1993, A&A, 274, 391
This paper has been typeset from a TEXIL AT EX file prepared by the author.