Coupling A Biosphere-Atmosphere Transfer Scheme
with A Mesoscale Atmospheric Model: A Case Study
in Deforestation
by
Li Yu
Submitted to the Department of Civil and Environmental Engineering
in partial fulfillment of the requirements for the degree of
Master of Science in Civil and Environmental Engineering
at the
MASSACHUSETTS INSTITUTE OF TECHNOLOGY
February 1999
©
Massachusetts Institute of Technology 1999. All rights r por
Author
Certified by.
Certified by.
... ... ... ... ...
Department of Civil A
Xd Environmental Engineering
January 15, 1999
... ...
Rafael L. Bras
Bacardi and Stockholm Water Foundations Professor
ThePqiq
Supervisor
. . . . . . ... . . . .... ..... ... .Elfatih Eltahir
Associate Profesof Cjvil and Environmental Engineering
A 'r A Thesis
Supervisor
A ccepted by ... . .V .... . ... MASSACHUSETTS INSTITUTE OF TECHNOLOGYFEB 1 0 1999
Andrew Whittle
Chairman, Department Committee on Graduate Students
Coupling A Biosphere-Atmosphere Transfer Scheme with A
Mesoscale Atmospheric Model: A Case Study in Deforestation
by
Li Yu
Submitted to the Department of Civil and Environmental Engineering on January 15, 1999, in partial fulfillment of the
requirements for the degree of
Master of Science in Civil and Environmental Engineering
Abstract
The land surface influences the lower atmosphere and thus impacts the whole atmospheric circulation. The quality of land surface parameterizations in atmospheric circulation mod-els should influence the quality of their simulations. Our effort is focused on coupling a comprehensive biosphere-atmosphere transfer scheme (BATS) with the Fifth-Generation
NCAR/Penn State Mesoscale Model (MM5V2). The focus is on the role of vegetation
in the energy and water budgets. The results show that by coupling the two models, we can get more realistic simulations of the lower atmosphere, the vegetation and the soil.
Four numerical experiments are performed over the Amazonia region using the coupled MM5V2-BATS driven by the data obtained from NCAR land use data archive. The first two experiments are used to evaluate the coupled model's performance in the Amazon region. Following the two experiments, a deforestation experiment and a control experiment are carried out. The control experiment is driven by the observed data while the deforestation experiment assumes that the all the domain is deforested and is completely covered by savannah. The results indicate that Amazonia deforestation produces less rainfall, less latent
heat flux, more sensible heat flux and warmer surface and canopy temperatures. Thesis Supervisor: Rafael L. Bras
Title: Bacardi and Stockholm Water Foundations Professor Thesis Supervisor: Elfatih Eltahir
Acknowledgments
It is with gratitude and appreciation that I acknowledge the continuous and invaluable guidance, encouragement and support provided by Professor Rafael L. Bras and Prof. Elfatih Eltahir throughout my studies at MIT. I would like to thank them for giving me the chance to be involved in the environment which encourages learning, hard work, thinking critically and independently.
I would like to thank for the help from everyone in Prof. Bras and Eltahir's groups. Thanks for their encouragement and useful discussions. Appreciation is extended to every one in the Parsons Laboratory for the friendly environment. I would also like to express my gratitude to all my friends in the United States and in China for their encouragement.
Thanks are also due to Wei Wang in NCAR for making MM5V2 and BATS available and giving useful help and suggestions during my work.
I would like to thank James Geraci and his parents for their support, love and encour-agement which make my life at MIT bearable.
I am mostly grateful to my parents, Qiaozhen Li and Songlin Yu, and my brother, Fan Yu, for their unselfish love, support and understanding all the time.
The research was supported by the NASA Goddard Flight Center under grant NAG5-3726. The project's title is: 'Amazon Deforestation and Regional Climate'.
Contents
1 Introduction 1.1 Scope ... ... ... . . 1.2 O utline. . . . . 2 Literature Review 2.1 Historical Perspective . . . .2.2 M otivation and goal . . . .
2.3 O verall approach . . . .
3 Description of Mesoscale Meteorological
3.1 Structure of the MM5V2 Model System .
3.2 Features of MM5V2 Model . . . .
3.2.1 Terrain-following Coordinate . . . 3.2.2 Directory Tree Structure . . . . .
3.3 Input Data for MM5V2 . . . .
3.4 Uses and Capabilities of MM5V2 . . . .
3.5 PBL schemes in MM5V2 . . . .
3.6 Vegetation . . . .
Model MM5V2
4 Description of the Biosphere-Atmosphere Transfer Scheme
4.1 Parameters in BATS . . . .
4.2 Time-Dependent Parameters . . . . 4.3 Energy transfer in BATS . . . .
11 11 13 14 14 18 20 21 . . . . 22 . . . . 22 . . . . 22 . . . . 24 . . . . 24 . . . . 27 . . . . 28 33 35 36 38 42
4.4 4.5
Water Transfer in BATS . . . .
The role of vegetation . . . .
5 Coupling BATS to MM5
5.1 Introduction ...
5.2 Structure of the Coupled Model . . . .
5.3 Variables and Parameters . . . .
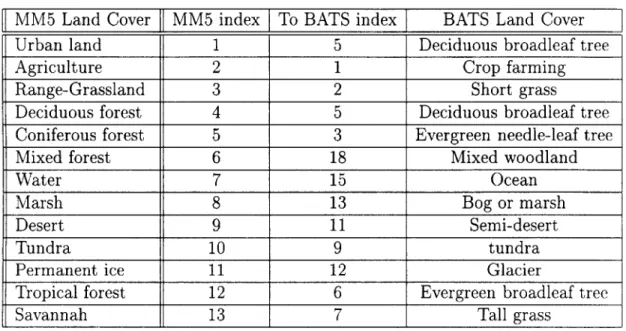
5.3.1 Variable: Vegetation Type . . . . 5.3.2 Variables of Soil . . . . 5.3.3 Parameters of Vegetation . . . .
5.3.4 Parameter: Albedo . . . .
5.3.5 Variable: Instantaneous Precipitation 5.3.6 BATS Variables . . . .
5.4 Initialization of Variables . . . .
5.5 Data Interface . . . .
5.6 Modifications of Physical Scheme . . . .
5.7 Final Version . . . .
Rate
6 Numerical Simulations Using the Coupled Model
6.1 Experiment Design 1 . . . .
6.1.1 Terrain and Land-Use Data . . . . 6.1.2 Boundary and Initial Conditions . . . . 6.1.3 Vertical Interpolation . . . .
6.1.4 Initialization of the coupled model . . . .
6.2 Results of Experiment 1 . . . .
6.3 Design of Experiment 2 . . . .
6.3.1 Correction of Boundary Condition . . . . . 6.3.2 Simulation Design . . . . 6.3.3 Simulation Results . . . . 6.4 Deforestation Experiment in the Amazon Basin .
46 49 53 53 54 56 56 57 58 58 59 59 60 61 62 64 65 . . . . 65 . . . . 66 . . . . 67 . . . . 68 . . . . 68 . . . . 69 . . . . 74 . . . . 78 . . . . 80 . . . . 82 88
6.4.1 Time Series of the Surface Variables . . . .
6.4.2 Spatial Distributions of the Surface Variables . . . .
7 Discussion and Conclusions
7.1 Summary . . . . 7.2 Discussions . . . . 7.3 Future work . . . . A List A.1 A.2 A.3 A.4 A.5 of Notations
Symbols in Thesis Text . . . . Variables of BDPONT in bats.incl . . . .
Variables of BDCN in bats.incl . . . .
Variables of SURFAR and BATS2D in bats.icnl Other Variables in bats.incl . . . . B BATS Files Descriptions
C The MM5V2-BATS Coupled Model User Manual C .1 Introduction . . . . C.2 Modifications of MM5V2 when Coupling BATS . . C.3 Structure of the Coupled Model . . . . C.4 Inputs to the Coupled Model . . . . C.4.1 Input Data Information . . . . C.4.2 Configuration Files . . . . C.5 How to Run MM5V2-BATS . . . . C.5.1 Compiling MM5V2-BATS . . . . C.5.2 Running MM5V2-BATS . . . . C.6 Outputs from the Coupled Model . . . . C.7 Exam ples . . . . 92 92 102 102 103 104 112 112 115 117 119 120 122 124 124 125 125 126 127 128 129 129 130 130 132 . . . . . . . . . . . . . . . . . . . .
List of Figures
3-1 Diagram of MM5V2 Modeling System. ... 23
3-2 MM5V2 multi-level directory structure . . . . 25
4-1 Schematic diagram of the processes in BATS(modified from Dickinson et al.1993 .) . . . . 3 7 5-1 Coupled BATS computation flow chart . . . . 55
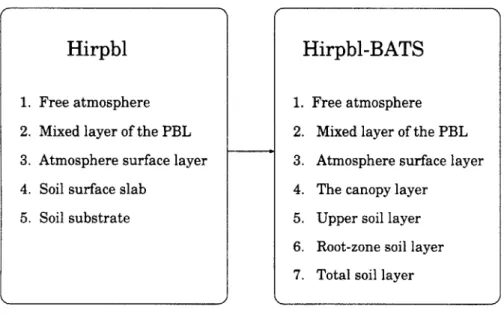
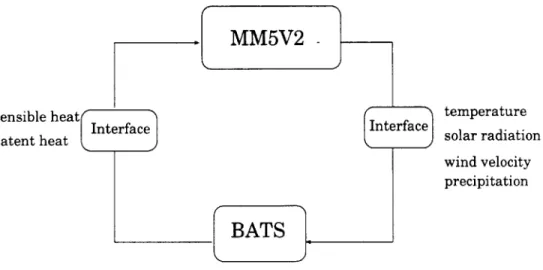
5-2 The Structures of the original Hirpbl scheme and the New Hirpbl-BATS scheme 56 5-3 The DATA Transfer Diagram between BATS and MM5V2 . . . . 61
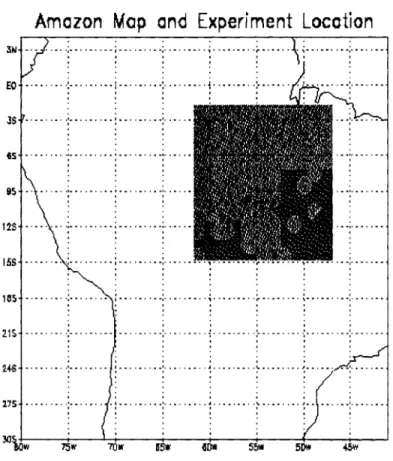
6-1 Location of the numerical experiment. . . . . 66
6-2 Diagram of the two-dimensional interpolation in DATAGRID. . . . . 67
6-3 Diagram of the one-dimensional interpolation in DATAGRID. . . . . 68
6-4 Time series of ground temperature, canopy temperature, sensible heat flux and latent heat flux at a savannah grid point . . . . 71
6-5 Time series of ground temperature, canopy temperature, sensible heat flux and latent heat flux at a forest grid point . . . . 72
6-6 The time series of the total accumulated rainfall at grid points (52w,10s) savannah and (58w, 9s) forest . . . . 73
6-7 The averaged fields of the ground temperature and canopy temperature over the simulation dom ain . . . . 75
6-8 The averaged fields of the net surface radiation and accumulated rainfall over the sim ulation dom ain . . . . 76
6-9 The averaged fields of the sensible heat flux and latent heat flux over the
sim ulation dom ain . . . . 77
6-10 Schematic representation of the dot (0) and cross (X) grid points . . . . 79 6-11 The Land cover distribution in Experiment 2. . . . . 81 6-12 Time series of ground temperature, canopy temperature, sensible heat flux
and latent heat flux at a savannah grid point . . . . 83
6-13 Time series of ground temperature, canopy temperature, sensible heat flux
and latent heat flux at a forest grid point . . . . 84
6-14 Time series of total rainfall in every 2 hours at grid points (63.6w,12.7s)
sa-vannah and (63w,10s) forest . . . . 85
6-15 Time series of accumulated total rainfall during the simulation period at grid
points (63.3w,12.7s) savannah and (63w,10s) forest . . . . 86
6-16 The spatial distribution of the averaged ground temperature and canopy
tem-perature in exp.2 . . . . 89
6-17 The spatial distribution of the accumulated total rainfall and net surface
ra-diation in exp.2 . . . . 90
6-18 The spatial distribution of the averaged sensible heat flux and latent heat flux
in ex p .2 . . . . 9 1
6-19 Time series of ground temperature, canopy temperature, sensible heat flux
and latent heat flux at a forest grid point in the control experiment . . . . . 93
6-20 Time series of ground temperature, canopy temperature, sensible heat flux
and latent heat flux at the same grid point in the deforestation experiment 94
6-21 Time series of accumulated rainfall at the grid point (60w, 10s) in the control
experiment and the deforestation experiment . . . . 95
6-22 The spatial distribution of the averaged ground temperature and canopy
tem-perature in the control experiment . . . . 97
6-23 The spatial distribution of the averaged ground temperature and canopy
tem-perature in the deforestation experiment . . . . 98
6-24 The spatial distribution of the averaged sensible and latent heat fluxes in the
6-25 The spatial distribution of the averaged sensible and latent heat fluxes in the deforestation experim ent . . . 100 6-26 The spatial distribution of the accumulated total rainfall in the control
exper-iment and the deforestation experexper-iment . . . 101
List of Tables
3.1 Terrain Heights Data Sources . . . . 26
3.2 Land Use Data Sources . . . . 26
3.3 Vegetation/land cover types in MM5V2 . . . . 33
3.4 Descriptions of vegetation categories and physical parameters for summer(15 April - 15 October) and winter(15 October - 15 April). . . . . 34
4.1 Vegetation/land cover types and their soil-texture classes and soil-color classes in B A T S . . . . 38
4.2 Vegetation parameterization in BATS (from Dickinson et al.1993) . . . . 39
4.3 Soil parameterization in BATS (from Dickinson et al.1993) . . . . 40
Chapter 1
Introduction
1.1
Scope
In order to address global environmental problems, the earth must be viewed as a whole system which includes atmosphere, biosphere and lithosphere. They interact with each other through physical, chemical and biological processes. The purpose of this study is to investigate the interactions between the atmosphere and the biosphere using numerical simulations. The earth's land surface plays a key role in the energy and water balances of the earth system. The land surface is spatially heterogeneous, characterized by land cover such as forest, grass, crop and desert. It also varies temporally. The land covers' properties are dependent on the season of the year. The atmosphere responds in many ways to the variable conditions of the land surface.
The land surface characteristics control the electromagnetic energy reflected, absorbed and emitted by the earth. The net solar radiation reflected by the land surface is determined by the surface albedo which is dependent on the vegetation type and the states of the soil and vegetation. The outgoing infrared radiation from the land surface to the overlying atmosphere is controlled by the surface temperature and emissivity. The surface roughness and vegetation characteristics and soil properties affect the turbulent energy fluxes in the planetary boundary layer. The structure of the atmospheric planetary boundary layer is controlled by the sensible and latent heat fluxes and by momentum flux from the land
surface. In turn, the states of the soil and the vegetation are affected by the atmosphere near the ground. The energy received at the surface will modify the states of soil and vegetation. The properties of soil and vegetation play a very important role in partitioning the net incoming radiation into sensible and latent heat flux. From the point of view of water transfer, the vegetation directly affects the rainfall interception and infiltration, evaporation and surface and ground water runoff. Therefore, the interaction between the atmosphere and land surface is very complicated.
Scientists have been trying to improve the descriptions of the hydrologic processes in the numerical models of the atmosphere. A large volume of research is focused on large scale models. For example, many general circulation models (GCMs) now include more and more detailed descriptions of the hydrologic processes. The results of the model simula-tions indicate that the hydrologic processes in the land surface play an important role in the atmosphere-land-ocean system. Many efforts are focused on the impact of the natural variability of land cover on the weather or climate. Other efforts are geared to understand human impact on climate such as that caused by deforestation and desertification. This study seeks to improve our understanding of the role of hydrology in the atmosphere-land interaction system in the Amazon basin by coupling a biosphere-atmosphere transfer scheme to a mesoscale atmospheric model and to investigate the impact of the present and future deforestation on the hydrologic processes and regional climate in the Amazon basin. The Amazon basin is important because it covers about six million squared kilometers and is a unique region which plays a significant role in the net global energy partition of sensible and latent heat fluxes. The Amazon river accounts for 20 percent of global runoff. The land cover change of this unique region will definitely impact the hydrologic processes and climate regionally and globally.
This study includes three parts. The first part includes a review and statement of the motivations of this study. The second part includes the descriptions of the NCAR/Penn State mesoscale atmospheric model MM5V2 and the Biosphere-Atmosphere Transfer Scheme and detailed description of the coupling procedure. This is the main part of the thesis. In the last part the coupled land-atmosphere model is used to study the impact of the change in vegetation/land cover, especially deforestation on the climate and hydrological processes in
the Amazon basin.
1.2
Outline
This thesis includes seven chapters. Chapter 2 is a review of relevant studies and the mo-tivation and objectives of this study. The overall approach is described. Chapter 3 is the description of the atmospheric model used in this study. Chapter 4 describes the biosphere-atmosphere transfer scheme which is to be coupled to the atmospheric model. Chapter 5 describes the motivations for the coupling and describes the process and method of coupling the two models. Chapter 6 assesses the performance of the coupled atmosphere-land model by designing two numerical simulation experiments in the Amazon basin. Following the two experiments, a deforestation experiment and a control experiment are carried out. The de-forestation experiment assumes that the tropical rainforest is replaced by savannah. Chapter
7 summarizes the numerical simulations and presents the conclusions from this study. Future
Chapter 2
Literature Review
2.1
Historical Perspective
The sea surface temperature(SST) particularly in the tropics, is the most important deter-minant of seasonal to inter-annual climate variability. Second in importance is the influence of soil moisture and vegetation on the energy, moisture and momentum transfers between the atmosphere and the land surface.
Charney(1973) describes the dynamics of droughts in terms of the interactions, via surface albedo of the atmosphere and the land cover of the Sahel in North Africa. The loss of the vegetation cover in the desert increases the surface albedo which increases the reflected solar radiation at the surface leading to a reduction in net incoming radiation at the surface. A reduction in net radiation will cool the surface. The cooling affects the overlying atmospheric circulations in such a way as to reduce rainfall which further decreases the vegetation cover in the region. Charney's mechanism has been developed for studying the feedback of the biosphere to atmosphere in desert or semi-desert regions. His hypothesis is strictly based on
radiative energy, without considering the role of water in the mechanism. However, can it be used to explain the interactions of biosphere-atmosphere in a warm and humid climate where atmospheric water vapor content is significant, e.g. in the Amazon tropical rainforest? After Charney pointed out the issue of atmosphere-biosphere interactions, numerous studies have evaluated the sensitivity of atmospheric circulation to different surface forcings
by using one-, two- and three-dimensional global or mesoscale atmospheric models.
The first General Circulation Models(GCMs) in the 1970s treated the land surface as a simple reservoir of water and energy. The first parameterizations had no dependence on any observed data. In the 1980s, GCMs began to include land surface models which described the functions of soil and vegetation. At the end of the last decade there were increasing number of studies trying to improve and validate land surface parameterizations. Satellites now provide more realistic descriptions of global land cover for GCMs studies, which helps scientists recognize the importance of spatial heterogeneities and the important role of vegetation in water transfer and carbon dioxide assimilation(recent reviews include Dickinson, 1995a and b). There is growing need for developing more complete and realistic land surface parameterizations.
Surface parameterizations have evolved significantly during the last two decades. Dear-dorff(1977) proposed the use of a budget equation for the soil-surface moisture content. Evaporation and precipitation were included in the water balance in the soil. The equation allows for precipitation to saturate the soil, and then for evaporation to occur at its poten-tial rate for some time. A plant module which includes a heat-balance equation for a single canopy layer, in addition to a heat-balance equation solved for the atmosphere-land sur-face intersur-face, was also developed by Deardorff (1978). Carlson and Boland (1978) designed a one-dimensional model to simulate surface temperature and heat flux. McCumber and Pielke(1981) developed a bare-soil parameterization scheme, which included a multi-level soil layer, and 11 types of soil.
The Biosphere-Atmosphere Transfer Scheme(BATS) was developed by Dickinson(1984)
and Dickinson et al.(1986). BATS is a surface-physics/soil-hydrology parameterization
scheme which includes three soil layers, partial vegetation cover and time-dependent surface characteristics. Taconet et al. (1986) developed a vegetation and soil model, which contained a parameterization scheme of the energy and water transfers within the canopy(following Deardorff, 1978). The simple biosphere model(SiB) of Sellers et al.(1986 and 1992) was designed to provide a biophysically realistic description of processes that control the trans-fer of radiation, sensible heat, latent heat, and momentum between the terrestrial surface and the atmosphere. SiB was more complicated and required more input parameters than
the other equivalent land surface parameterizations. Wetzel and Chang(1988) presented a model of evapotranspiration from a natural heterogeneous surface, which assumed that the area-averaged soil moisture and vegetation coverage are known. A parameterization of land-surface processes developed by Noilhan and Planton(1989) was designed to achieve an accurate description of the main physical processes using the least number of prescribed parameters. The model considered the effect of gravity only when it calculated the ground-surface moisture.
Avissar and Pielke(1989) developed a parameterization of subgrid-scale effects, where each heterogeneous grid cell was divided into several homogeneous subgrid classes. For each of these subgrid classes, a complicated micrometeorological model of the soil-vegetation-atmosphere system was developed to calculate the surface temperature and the surface heat fluxes into the atmosphere. The surface heat fluxes for the grid cell were obtained by aver-aging the fluxes form the subgrid classes according to their distribution.
Bonan(1995) developed a land surface model(LSM) which simulated the energy, water, and momentum balance of the soil-vegetation-atmosphere system and operated globally with geographically prescribed vegetation and soil characteristics. Foley et al.(1996) developed an integrated biosphere simulator(IBIS) to describe the land surface processes, canopy physiol-ogy, vegetation phenolphysiol-ogy, terrestrial carbon balance and vegetation dynamics. This model provided a more dynamic and holistic framework to study the issues of global ecology and biosphere-atmosphere interactions.
Because of uncertainty of the accuracy of specifying the numerous surface parameters, scientists have examined in detail their impact on the overlying atmosphere. Deardorff(1978) found that soil moisture has a major influence on the characteristics of the surface heat fluxes which lead to significant impact on the planetary boundary layer. Carlson and Boland(1978) showed that moisture availability and thermal inertial are the surface parameters most re-sponsible for the horizontal variation of the atmospheric temperature. Using their high-resolution PBL scheme, Zhang and Anthes(1982) found that the structure of the PBL dur-ing the daytime is most sensitive to the surface moisture availability and the roughness length. The one dimensional model of Colby(1984) showed that soil moisture has the great-est effect on the partitioning of energy between sensible and latent heat fluxes. Wetzel and
Chang(1988) concluded that the soil moisture and the fractional vegetation cover are the most important factors which affect the regional evapotranspiration. Segal(1989) studied the impact of very wet soil and canopy temperature on the surface sensible heat flux and the structure of the planetary boundary layer and found that the Bowen ratio over saturated or very wet surface is affected mostly by the surface temperature. Pinty et al.(1989) pointed out that the most sensitive parameter in the vegetation parameterization is the leaf stomatal resistance, which controls the Bowen ratio at the surface. They also found that the accuracy of the soil moisture data directly determines the accuracy of the surface predictions made by a mesoscale model. Giorgi(1989) used a two-dimensional mesoscale model coupled with BATS and found that the interception by the canopy foliage and the evaporation produced a sharp decrease in the canopy temperature when the precipitation began. Using a single vege-tation canopy in a parameterization of land surface processes, Mahfouf and Jacqumin(1989) concluded that the interception of rainfall by vegetation strongly affected the water budget at the land surface.
Accuracy of description of the surface characteristic in each grid cell in a model is essential to predict the surface temperature and fluxes. The surface characteristics include the amount of moisture in the soil, the surface albedo and roughness length, the soil thermal properties, etc. In BATS, Dickinson(1984) divided each grid cell into vegetation and bare soil subareas, each with distinguishing characteristics. Avissar and Mahrer(1988) regrouped the similar homogeneous land patches at different places inside each grid cell into subgrid classes. Then, for each one of the subgrid classes, a group of specific surface parameters are defined. The total energy transferred between the atmosphere and the land surface from each grid cell is calculated by averaging according to the distribution of the subgrid classes. This kind of parameterization of subgrid-scale heterogeneity would represent the surface forcing more accurately.
Recently most GCMs contain a land surface model which represents the biophysical interactions between land surfaces and the overlying atmosphere. Common land surface models include BATS of Dickinson et al.(1986), SiB of Sellers et al.(1986, 1992), LSX of Pol-lard and Thompson(1995) and LSM of Bonan(1995). The Biosphere-Atmosphere Transfer
Cli-mate Model(CCM). The current version of BATS is a piece of software with about four thousand lines of code that can run as an off-line version or coupled to an atmospheric model. Giorgi(1989) coupled a two-dimensional regional atmospheric model MM4 with BATS. Lakhtakia(1993) coupled a one-dimensional NCAR/Penn State mesoscale model with BATS. Their studies showed that coupling BATS in the atmospheric models can improve the simulation of the surface fluxes and therefore enhance the description of the evolution of the planetary boundary layer.
2.2
Motivation and goal
The Fifth-Generation NCAR/Penn State mesoscale atmospheric model MM5V2 is the latest in a series that developed from a mesoscale model used by Anthes at Penn State University in the early 70's that was later documented by Anthes and Warner (1978). The model can be applied to study a broad range of atmospheric phenomena. The model has many options for precipitation physics, planetary boundary layer processes and atmospheric radiation.
There are four types of planetary boundary schemes available in MM5V2. A surface processes parameterization is included in all of them. The surface module contains 13 veg-etation categories and use energy balance equations to predict the ground temperature. The surface fluxes and momentum are calculated in the planetary boundary layer schemes. Two kinds of methods are used to calculate the surface fluxes in the PBL schemes. One is bulk-aerodynamic theory following Deardorff(1972) which is used in the bulk-aerodynamic PBL scheme. The other is similarity theory which calculates the surface fluxes in terms of the friction velocity. This method is applied in the high-resolution Blackadar PBL scheme(Blackadar, 1766, 1979; Zhang and Anthes, 1982). In both cases, the surface charac-teristics in each grid cell are spatially homogeneous and temporally constant. The surface parameters are provided through a look-up table indexed by the vegetation type. Both cases do not consider water balance at the land surface.
This representation of the surface characteristics in MM5V2 is very simple, and, it may not work well in some simulations. For example, Zhang(1985) found that the soil moisture availability parameter had to be modified to represent the wetting of the surface during
the precipitation and the drying afterwards in order to get a reasonable feedback from the surface to the PBL. Oncley and Dudhia(1995) compared the direct observations of surface fluxes of momentum, sensible and latent heat and the results from MM5V2 and concluded that the the surface fluxes are very sensitive to the parameters such as roughness length and moisture availability. If they are not specified appropriately, the simulation results of the surface fluxes from MM5V2 do not correspond well with the observations.
The above calls the need for a more complete and sophisticated surface parameterization in the mesoscale atmospheric model MM5V2. A good choice is the Biosphere-Atmosphere Transfer Scheme(BATS) which is developed by Dickinson(1984, 1986). BATS is a compli-cated soil-vegetation-atmosphere transfer scheme which emphasizes the role of vegetation in the modifying the surface moisture and energy budgets. It allows for heterogeneity in each grid cell and time-dependent surface parameters. A combination of the NCAR/Penn State model version 1 and BATS, which is much simpler than the version MM5V2, has already been utilized in studies of the regional climate of the western United States by Dickinson et al.(1989) and Giorgi and Bates(1989). Lakhtakia(1993) coupled BATS within the one-dimensioanl NCAR/Penn State mesoscale model to improve the description of the land surface processes. Their studies showed that the simulation results improve after using BATS as the surface parameterization.
This study seeks to understand the water and energy balance over the Amazon and to investigate the impact of Amazonia deforestation on the regional climate and hydrologi-cal processes. Recent field observations from the Amazon confirm that conversion of the land surface cover from tropical rain forest to savannah increases sensible heat flux and sur-face temperature, while it decreases evaporation and rainfall. These results lead to modify the land surface energy balance and therefore impact the structure of the overlying atmo-spheric boundary layer. Several numerical experiments have been carried out by Dickinson and Henderson-Sellers(1988), Lean and Warrilow(1989), Dickinson and Kennedy(1992) and Dirmeyer and Shukla(1994). They used General Circulation Models(GCMs) to study the impact of the Amazonia deforestation. They concluded that larger-scale(the Amazon basin wide) deforestation will result in: higher surface temperature, less evaporation and less rain-fall. Eltahir and Bras(1994) performed several numerical experiment using a regional climate
model (MM4) with BATS in it. In the experiments, they assumed that the rain forest is replaced by short grass over an area 250km x 250km. The results indicated that the change of rainfall is of the same sign, but of much smaller magnitude, compared to the results from GCMs. However, Bastable et al.(1993) found that there is no significant difference between the observed rainfall over a rain forest area and that over the nearby deforested area of 1 to
100 squared kilometers.
The magnitude of predicted changes in climate seems to become smaller as the atmo-spheric numerical models become more refined and the land surface parameterization im-proves. Does scale influence the impact of deforestation? MM5V2 is a good atmospheric model to address this problem since MM5V2 can represent processes from global scale down to cloud scale. From the previous description, we know that the surface parameterization in MM5V2 is quite simple. The simulation of surface fluxes will improve if BATS is coupled into MM5V2. The high-resolution Blackadar PBL scheme is chosen to be used in the cou-pled model. More realistic and accurate simulation results are expected from MM5V2-BATS coupled model.
2.3
Overall approach
In coupling the Biosphere-Atmosphere Transfer Scheme (BATS) to the mesoscale atmo-spheric model MM5V2, the simple surface module in the high-resolution Blackadar PBL scheme is replaced by BATS. This requires a complete comparison and matching of variables and parameters in BATS and MM5V2. Additional initializations are required according to more parameters required by BATS. An interface is built to transfer the atmospheric and surface hydrological data between the atmospheric model MM5V2 and BATS. Some physical modifications are performed such as the calculation of Richardson number and the instantaneous precipitation rate.
After testing, debugging and choosing the appropriate physics options, two validation experiments are performed using the coupled model in the Amazon basin. A deforestation experiment and a control experiment are also carried out in order to study the impact of the Amazonia deforestation.
Chapter 3
Description of Mesoscale
Meteorological Model MM5V2
The PSU/NCAR mesoscale model is a limited-area, hydrostatic/non-hydrostatic, sigma-coordinate model designed to simulate or predict mesoscale and regional scale atmospheric circulation. It is a three-dimensional primitive equation solver. It was developed at Penn state and NCAR (National Center for Atmospheric Research) as a community mesoscale model and is continuously being improved. It can be used as a framework to test the parameterizations of the turbulent fluxes in the planetary boundary layer since model results can be compared to detailed and localized observations.
The fifth-Generation NCAR/Penn State Mesoscale Model (MM5) is the latest in a series that was developed from the mesoscale model used by Anthes at Penn State in the early 70's and was later documented by Anthes and Warner(1978). Since that time, it has undergone many changes designed to broaden its usage. These include: (i) a multiple-nesting capability, (ii) nonhydrostatic dynamics, and (iii) a four-dimensional data-assimilation capability. MM5 Version 1 was released early in 1994, but it assumed that most users use the NCAR Cray for running MM5 and all the pre-processors. In order to meet the need to use MM5 both on Cray and most workstations, MM5V2 was developed and also released in 1994. As a growing number of atmospheric physics options becomes available, MM5V2 has undergone many changes and still need more tests and improvement.
3.1
Structure of the MM5V2 Model System
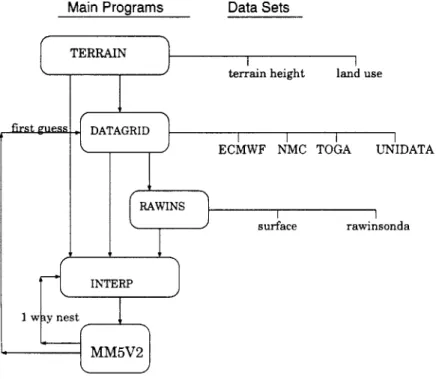
MM5V2 is supported by several auxiliary programs which are collectively called the MM5V2 modeling system. A schematic diagram Figure 3-1 is provided to show the complete MM5V2 modeling system. The MM5V2 modeling system includes TERRAIN, DATAGRID, RAW-INS, INTERP and MM5V2. The primary functions of these programs are described below. Terrestrial and isobaric meteorological data are horizontally interpolated ( programs TER-RAIN and DATAGRID ) from a latitude-longitude mesh to a variable high-resolution domain on either a Mercator, Lambert conformal, or polar stereographical projection. The horizon-tally interpolated data can be enhanced by the program RAWINS which handles the obser-vations from the standard network of surface and rawinsonde stations. Program INTERP performs the vertical interpolation pressure-level data from either RAWINS or DATAGRID to the sigma coordinate system of MM5V2. Sigma levels near the surface closely follow the terrain while the higher levels tend to approximate the isobaric surfaces.
3.2
Features of MM5V2 Model
MM5V2 was developed on the workstation version of MM5 and was first released in 1994. MM5V2 has been changed dramatically to meet a growing demand of scientific needs. Some of its features are listed below.
3.2.1
Terrain-following Coordinate
One of the features of MM5V2 is the terrain-following vertical coordinate which is essential to a mesoscale atmospheric model. The terrain following coordinate means that the lower levels are following the terrain while the top levels are very flat. A dimensionless variable o is used to represent the model levels and is defined by
P - (3.1)
Main Programs
Figure 3-1: Diagram of MM5V2 Modeling System
where p is the pressure, pt is the top pressure while p, is the surface pressure. From the formulation, we can see that o is zero at the top and one at the surface.
3.2.2
Directory Tree Structure
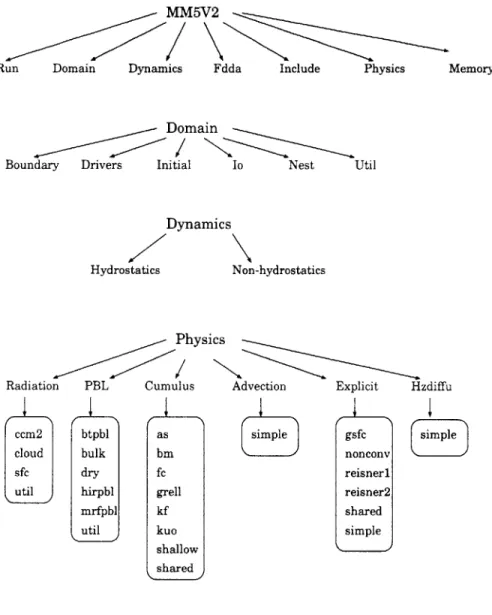
The NCAR/Penn State mesoscale atmospheric model MM5V2 has more than 200 subroutines and these are grouped according to functions or atmospheric physics options. A single directory may contain routines that are relevant to one parameterization. This allows easy and efficient compilation and modifications. The directory structure of MM5V2 is illustrated in Figure 3-2.
3.3
Input Data for MM5V2
MM5V2 allows real time data inputs. It can use routine observations, for example, upper air and surface observations, including wind, temperature, relative humidity, sea-level pressure, and sea surface temperature.
The results of other models, GCMs or the regional models, can be used as first guess for objective analysis or as lateral boundary conditions to drive MM5V2. Examples of these accessory models are the NCEP and ECMWF global analysis, NCEP/NCAR and ECMWF reanalysis, NCEP ETA model. Before incorporating into the MM5V2 model, the GCM data normally has to be interpolated from large grid resolution to mesoscale grid resolution.
Data required by MM5V2 include lateral boundary conditions and initial conditions. Required three-dimensional input variables are temperature, U-wind, V-wind and relative humidity. Needed two dimensional variables include terrain elevation, land use, snow cover, sea-level pressure and surface temperature.
The input data of temperature, U-wind, V-wind and relative humidity, snow cover, sea-level pressure and temperature are obtained and processed using program DATAGRID which accesses the archived low-resolution meteorological analysis stored in NCAR's mass storage system. These include: NMC(global analysis; grid size of 2.5' x 2.50), ECMWF(global analysis; grid size of 2.50 x 2.54; 1980-1989 only), TOGA(global analysis; grid size of 2.50 x
MM5V2
Run Domain Dynamics Fdda Include Physics Memory
Domain
Boundary Drivers Initial Io Nest Util
Dynamics
Hydrostatics Non-hydrostatics
Physics
Radiation PBL Cumulus Advection Explicit Hzdiffu
ccm2 btpbl cloud bulk sfc dry il hirpbl mrfpbl util as bm fc grell kf kuo shallow shared simple gsfc simple nonconv reisner1 reisner2 shared simple
Resolution Data source Coverage Size
1 deg.(111.0 km) PSU/NCAR Global 180x360
30 min.(55.0 km) PSU/NCAR Global 360x720
10 min.(18.5 km) Geophysical Data Center Global 1080x2160 5 min.(9.25 km) Geophysical Data Center Global 2161x4320 30 sec.(0.925 km) Defense Mapping Agency 51-23N,130-60W 3361x8401
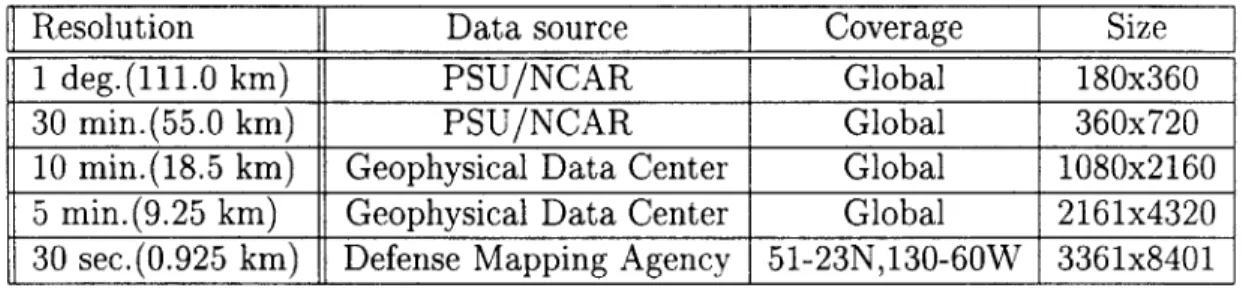
Table 3.1: Terrain Heights Data Sources
Resolution Data source Coverage Size
1 deg.(111.0 km) PSU/NCAR Global 180x360x13
30 min. (55.0 km) PSU/NCAR Global 360x720x13 10 min.(18.5 km) PSU/NCAR Global 1080x2160x13
Table 3.2: Land Use Data Sources 2.50), Unidata(NMC MRF forecasts, grid size of 2.5" x 5.00).
The input data of terrain height and land use are obtained and processed using program TERRAIN. There are five types of elevation data sources: 1-degree, 30-, 10-, 5-minute and 30-second, and three types of land-use data: 1-degree, 30- and 10-minute, available. Table 3.1 shows the information of terrain elevation data sources. Table 3.2 gives the information of land use data sources. There are 13 vegetation types in each land use data source. Data sources are selected to be compatible with the mesoscale grid resolution desired.
The output data from MM5V2 in each time period includes three-dimensional atmo-spheric variables and two-dimensional surface variables. Three-dimensional variables are U-wind, V-wind, temperature, water vapor mixing ratio, cloud water mixing ratio, rain wa-ter mixing ratio, cloud ice mixing ratio, snow mixing ratio, graupel, number concentration of ice, turbulent kinetics, atmospheric radiation tendency, vertical velocity and perturbation pressure. Two-dimensional forecast variables are ground temperature, accumulated convec-tive and nonconvecconvec-tive rainfall, PBL height, surface sensible heat flux, surface latent heat flux, frictional velocity, surface downward shortwave and longwave radiation.
3.4
Uses and Capabilities of MM5V2
The Mesoscale model MM5V2 can be used for a broad spectrum of theoretical and real-time studies, including simulation and four-dimensional data assimilation of monsoons, hurricanes and cyclones. The model is very flexible. The horizontal resolution can be set from the global scale down to cloud scale ( for example less than 5km). With high resolution of 2-200km, this mesoscale model can be used for studying mesoscale convective systems, mountain-valley circulations, land-sea breeze and urban heat islands. It can also be used as a framework to test parameterizations of the turbulent fluxes in the planetary boundary layer since results can be compared to detailed and localized observations.
MM5V2 can be used globally. The modeling system provides three kinds of projections to support the different latitudes. Polar projections are used for the latitude ranging from 600 to the pole in the southern or northern hemisphere. Lambert conformal projection serves the area between 30" and 604 latitude, while in the tropical range, Mercator is mostly used. One aspect of MM5V2 is its nesting capability which allows up to nine domains to run at the same time and to interact completely. It can be run in both 2-way and 1-way nesting mode. The 1 way nesting means that the fine-mesh model is driven by the coarse-mesh model. The 2-way nesting means fine-mesh model and coarse-mesh model interact with each other. The nest can be started, moved and ended at any time.
Another attractive feature of MM5V2 is that the model is free and widely available. It can run on various platforms, such as DEC, SUN, IBM, HP, SGI, Cray and some PCs which can run Linux.
MM5V2 has a wide range of applications for theoretical or real-time studies. It has various advanced physical parameterizations covering many different aspects of atmospheric processes. New physics options available include three cumulus parameterizations (Kain-Fritsch, Fritsch-Chappell and Betts-Miller), a new planetary boundary layer scheme(Burk-Thompson), radiation scheme(CCM2) and two microphysics schemes with graupel(Reisner-2 and Goddard).
MM5V2 is commonly used to simulate the atmosphere-land surface interactions. In studying this issue, a complete and realistic description of the land surface processes is
necessary. If a land surface scheme is to be coupled with MM5V2, it is very clear that the planetary boundary layer is a critical element. The PBL structure is determined by the spatial and temporal variations of sensible heat flux, latent heat flux and momentum flux from the land surface. In turn, the PBL conditions will directly affect land surface variables such as the temperatures of vegetation and soil. The PBL scheme is the key connection if we want to couple a model like the Biosphere-Atmosphere Transfer Scheme(BATS) with MM5V2. The following section is the detailed description of the PBL schemes used in MM5V2.
3.5
PBL schemes in MM5V2
The computation of the sensible heat flux and the latent heat flux depends on what PBL parameterization is used in MM5V2. There are five PBL options available in MM5V2: None, Bulk-aerodynamic PBL, High-resolution Blackadar PBL, Burk-Thompson PBL and MRF PBL. In None PBL scheme, there is no surface layer and is unrealistic in real-time solutions. The bulk-aerodynamic PBL parameterization calculates the surface fluxes using exchange coefficients and the characteristics of the land surface and the meteorological conditions of the atmosphere near the land surface. The bulk PBL parameterization is suitable for a coarse vertical resolution in the boundary layer, for example, more than 250m in the vertical grid. The high-resolution Blackadar PBL parameterization provides more vertical levels in the lower atmosphere. It is suitable for high resolution representation of the PBL, for example 5 layers in the lowest km and a surface layer less than 100m thick. Four stability conditions, stable, mechanically driven turbulence, forced convection and unstable(free convection) are considered in this scheme. The Burk-Thompson PBL scheme is good for both coarse and high-resolution PBLs. It can predict turbulent kinetic energy for use in vertical mixing, based on Mellor-Yamada formulas(see Burk-Thompson(1989) for details). The MRF PBL (or Hong-Pan PBL) is suitable for high-resolution in the PBL(as the Blackadar scheme). It is based on a Troen-Mahrt representation of the profiles in the well mixed PBL, as implemented in the NCEP MRF model(see Hong and Pan(1996) for details). The MRF PBL and Burk-Thompson PBL schemes are newly available. The high-resolution Blackadar scheme is chosen
in this study to be the PBL scheme when the Biosphere-Atmosphere Transfer Scheme is coupled to MM5V2.
The high-resolution Blackadar PBL scheme follows Blackadar (1976)'s pioneering work. It was further developed by Zhang and Anthes(1982). The scheme is designed to simulate the characteristics of the planetary boundary layer, the land surface and their interactions. The scheme includes three atmosphere layers and two soil layers. The atmosphere layers are: free atmosphere layer, mixed layer of the PBL and atmosphere surface layer. The soil layers are a soil surface slab layer and a soil substrate layer.
The surface fluxes in the high resolution PBL scheme are calculated on the basis of similarity theory. The friction velocity is defined as
u~=MAX(kV
Uu = MAX( U*o) (3.2)
ln(g) @
where k is the von Karman constant. uso is the background value (usually 0.1 m/s over land and zero over water). The local velocity V is given by
V = (V + V(3.3)
where Va is the local velocity at the lowest atmospheric layer while V is the local convective velocity, which is defined under unstable and neutral conditions as
V = 2(0, - Oa)2 (3.4)
while it is zero under stable condition.
Based on the similarity theory, the surface sensible heat flux is computed as
Hs = -Cmpaku*T, (3.5)
where
T Oa -09 (3.6)
where T, is the temperature scaling parameter, Cpm is the specific heat at constant pressure for moist air, zo is the roughness parameter, Za is the height of the lowest o- level. 6a and 0, are the atmosphere potential temperature at the lowest atmosphere level and ground level, respectively. a)h is a nondimensional stability parameter for sensible heat flux.
The surface moisture flux is calculated from
Es = -Mpahu~q, (3.7)
where M is the surface moisture availability which is a given constant based on the vegetation type. The approach to define q, is similar to the way to define T,. q, is given by
q = q (T9) (3.8)
where q, is the specific humidity scaling perameter, qa is the atmosphere specific humid-ity at the lowest atmosphere level, q,(Tg) is the saturated specific humidhumid-ity at the ground
temperature. V/m is the nondimensional stability parameter for moisture heat flux.
Both Oh and V)m are the nondimensional stability parameters which are functions of the
bulk Richardson number RiB which is defined as
RiB = YZa Ova - Ovg (3.9)
Oa V2
where the subscript v represents the virtual potential temperature. The definition of the virtual potential temperature is
E x (1 - 0.622) (3.10)
P
where Oa is the potential temperature, E is the actual vapor pressure and P is the pressure.
There are four stability cases in this scheme: the stable case, mechanically driven turbu-lence, the unstable(forced convection) case and the unstable(free convection) case.
For the stable case, RiB > Rc, where the critical Richardson number Ric is defined as
(3.11) In this case,
and
H, = Max(-250wm-2, -CpmPakuT,)
B) Mechanically driven turbulence For this case 0 < RiB < Rc,
Vm = V#h =-5( R 'B -),n Z
- 5RiB Za (3.14)
C) Unstable(forced convection) Here RiB < 0 and |h/L| 5 1.5, where the Monin-Obukhov length(L) defined as
L - cpmPmOau*
3 kgH,
where h is the height of the PBL. In this case, 'Om = Oh = 0.
D) Unstable(free convection)
For this case RiB < 0 and |h/L| > 1.5, and we get
'O= -3-23(e -a 1.99(Za)2 -0-474( Za )3
L ~LL (3.15) (3.16) and m = Oh = 10n -ZO (3.12) (3.13)
10m = -1.86( ) - 1.07( )2 - 0.249( )3 (3.17)
LL L
where Za/L is restricted to be no less than -2.0 in this approximation. For Za/L equal to -2.0, VP = 2.29 and Om = 1.43.
In the general case, Za/L is a function of Om. We can approximate Za/L as an explicit function of RiB as
Za _ Za (.8
= RiBin-
(3.13)
L zo
The high-resolution Blackadar scheme emphasizes the energy transfer between the land surface and the overlying atmosphere and ignores the water transfer. A slab model is used to calculate the surface temperature through an energy budget equation. The energy budget equation is based on the 'force-restore' method developed by Blackadar(Zhang and Anthes 1982). The budget equation is
C g = Rn - Hm - Hs - LvEs (3.19)
where C, is the thermal capacity of the slab per unit area, R" is the net radiation, Hm is the heat flow into the substrate, H. is the sensible heat flux into the atmosphere, Lv is the latent heat of vaporization, and Es is the surface moisture flux. Blackadar(1979) defines that
Cg = 3.293 x 10'X (3.20)
where x (cal cm-2K-ls-2; 1 cal = 4.18J) is the thermal inertia, specified in the model as a
function of vegetation/land-use characteristics(See in Table 3.4).
In Chapter 5, the differences in calculations of the surface fluxes between MM5V2 and BATS will be discussed.
Landuse Index MM5V2 1 Urban land 2 Agriculture 3 Range-grassland 4 Deciduous forest 5 Coniferous forest
6 Mixed forest and wet land
7 Water
8 Marsh or wet land
9 Desert
10 Tundra
11 Permanent ice
12 Tropical or sub tropical forest
13 Savannah
Table 3.3: Vegetation/land cover types in MM5V2
3.6
Vegetation
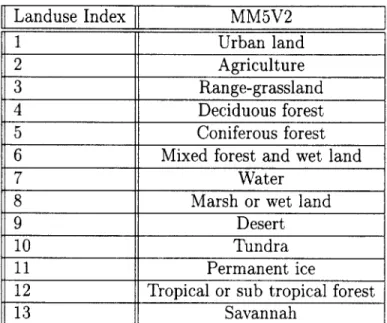
There are 13 vegetation types in MM5V2, shown in Table 3.3. Three types of land-use source data are available: 1-degree, 30-, 10-minute. The information about the land use dataset sources was presented in section 3.3. At each grid point of the dataset, there are 13 numbers of percentages for the 13 categories. The overlapping parabolic interpolation method is applied to obtain the percentages for each land-use category at the mesoscale grid point. If the water coverage is more than 50 percent at the mesoscale grid point, the category of water will be assigned to the mesoscale grid point. If the water coverage is less than 50 percent, the category with the maximum percentage excluding water will be assigned to the mesoscale grid point.
MM5V2 translates the vegetation type into the land surface characteristics, such as albedo, moisture availability, emissivity, roughness length, and thermal inertia, all of which are shown in Table 3.4.
The unit for albedo, moisture availability and emissivity is percentage, and the unit for thermal inertia is cal cm- 2k-s- 1/2. All the parameters of land surface characteristics in MM5V2 are temporally constant and seasonally dependent, according to summer or winter
Veg.Index Albedo Moi.Avail. Emissivity Roughness(cm) Thermal Inertia SW SW SW SW SW 1 18 18 5 10 8888 5050 0.030.03 2 1723 30 60 92 92 15 5 0.04 0.04 3 19 23 15 30 92 92 12 10 0.03 0.04 4 16 17 30 60 93 93 50 50 0.04 0.05 5 12 12 30 60 95 95 40 40 0.05 0.06 6 14 14 35 70 95 95 40 40 0.05 0.06 7 8 8 100 100 98 98 0.01 0.01 0.06 0.06 8 14 14 50 75 95 95 20 20 0.06 0.06 9 25 25 2 5 85 85 10 10 0.02 0.02 10 15 70 50 90 92 92 10 10 0.05 0.06 11 55 70 95 95 95 95 5 5 0.05 0.06 12 12 12 50 50 95 95 50 50 0.05 0.05 13 20 20 15 15 92 92 15 15 0.03 0.03
Table 3.4: Descriptions of vegetation categories and
- 15 October) and winter(15 October - 15 April).
physical parameters for summer(15 April
season(for northern hemisphere). All these values for the variables are climatological and may not be optimal for a particular case, especially moisture availability.
Chapter 4
Description of the
Biosphere-Atmosphere Transfer
Scheme
The Biosphere-Atmosphere Transfer Scheme(BATS) was introduced by Dickinson and Kennedy (1984). This scheme represents a comprehensive model of land-surface processes. Special emphasis has been given to properly describing the role of vegetation in modifying the surface moisture and energy fluxes. This model is suitable for use in "coupled mode" (inter-actively coupled to an atmospheric model) or in "stand-alone mode" (forced with observed atmospheric data). Several versions described by Dickinson(1984), Dickinson et al(1986), Wilson et al.(1989) and Dickinson(1993) were later developed with contributions from Klaus Bluemel, Filippo Giorgi, and Ann Henderson-Sellers. Initially BATS was developed for a multilevel GCM which had a very detailed description of the boundary layer and the soil layer. The present version, BATS1e, is used as the land surface parameterization for the NCAR Community Climate Model(CCM). We modify the BATS1e version and couple it within the mesoscale atmospheric model(MM5V2) in order to study the role of the land surface in the mesoscale atmospheric circulation. The summary of the features of BATS, as well as our modifications, are described below. Next several sections are mostly based on the document of BATS Version le described by Dickinson et al. (1993).
The purposes of BATS are
1. to determine the fraction of incident solar radiation that is absorbed by different surfaces and their net exchange of thermal infrared radiation with the atmosphere;
2. to calculate the transfers of momentum, sensible heat, and moisture between the earth's surface and the atmospheric layers;
3. to determine values for wind, moisture, and temperature in the atmosphere, within vegetation canopies, and at the level of surface observations;
4. to determine values of temperature and moisture quantities at the earth's surface. Included in point 4 are the determination of the moisture content of soil, the excess rainfall that goes into runoff, and the state of the moisture content of soil at the surface, i.e., whether it is snow or water. In order to carry out these calculations, it is important to prescribe a dominating land use type in each mesoscale grid point since the coverage of the vegetation has a significant impact on the exchanges of the energy and water between the atmosphere, vegetation and soil. BATS allows for heterogeneity over each grid cell. Bare-soil and vegetation-covered sub-areas can coexist in each grid cell. The vegetation coverage is seasonally varied.
BATS considers four layers: a vegetation layer, a surface soil layer, a root-zone soil layer and a deep soil layer. The schematic of the most important processes in BATS is presented in the Figure 4-1.
4.1
Parameters in BATS
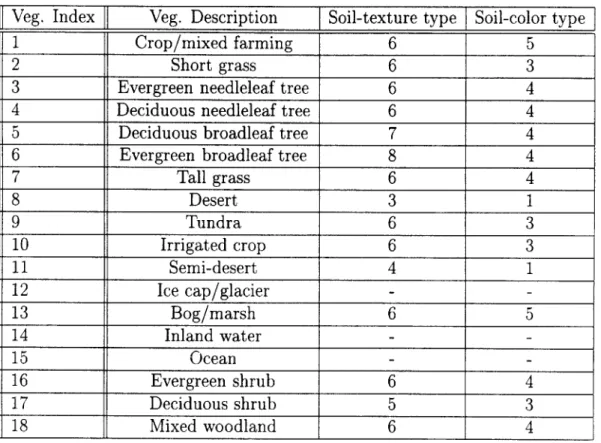
Many parameters are involved in the simulations of different processes at the land surface in BATS. These parameters are grouped into three categories: the type of vegetation cover, the soil texture and the color of the soil. BATS defines 18 vegetation types, 12 soil texture classes and 8 soil color types. Table 4.1 shows the vegetation types in BATS and their corresponding soil-texture classes and soil-color classes. Twelve soil-texture classes range from sand(class 1) to heavy clay(class 12) through loam(class 6). Eight soil-color classes range from light(class 1) to dark(class 8). Table 4.2 shows the parameters that are dependent on vegetation types, as well as their values. Those parameters which are dependent on the soil textures and soil
WIND
SURFACE'
RUNOFF IR f
SNOWI
PECLO upper soil layer rootzone soil layer
Total soil layer
GROUNDWATER RUNOFF
Veg. Index Veg. Description Soil-texture type Soil-color type
1 Crop/mixed farming 6 5
2 Short grass 6 3
3 Evergreen needleleaf tree 6 4
4 Deciduous needleleaf tree 6 4
5 Deciduous broadleaf tree 7 4
6 Evergreen broadleaf tree 8 4
7 Tall grass 6 4 8 Desert 3 1 9 Tundra 6 3 10 Irrigated crop 6 3 11 Semi-desert 4 1 12 Ice cap/glacier - -13 Bog/marsh 6 5 14 Inland water - -15 Ocean - -16 Evergreen shrub 6 4 17 Deciduous shrub 5 3 18 Mixed woodland 6 4
Table 4.1: Vegetation/land cover types and their soil-texture BATS
classes and soil-color classes in
colors are listed in Table 4.3.
The major parameters of vegetation in BATS include fractional vegetation coverage, leaf area index, vegetation albedo, roughness length, and emissivity. Among these, the leaf area index and the fractional vegetation coverage are seasonally dependent. Other parameters, such as minimum stomatal resistance, heat storage capacity and root depth must be specified.
4.2
Time-Dependent Parameters
Some parameters which describe surface characteristics in BATS are time-dependent. For example, BATS allows for varying albedos for the vegetation and the bare soil. There are three albedo variables for each grid cell in BATS. The albedo variables in BATS are visible
solar albedo of vegetation(A < 0.7pm), near-infrared albedo of vegetation(A > 0.7pm),