Publisher’s version / Version de l'éditeur:
ASTM Special Technical Publication, 254, pp. 168-177, 1960-12-01
READ THESE TERMS AND CONDITIONS CAREFULLY BEFORE USING THIS WEBSITE. https://nrc-publications.canada.ca/eng/copyright
Vous avez des questions? Nous pouvons vous aider. Pour communiquer directement avec un auteur, consultez la première page de la revue dans laquelle son article a été publié afin de trouver ses coordonnées. Si vous n’arrivez pas à les repérer, communiquez avec nous à [email protected].
Questions? Contact the NRC Publications Archive team at
[email protected]. If you wish to email the authors directly, please see the first page of the publication for their contact information.
NRC Publications Archive
Archives des publications du CNRC
This publication could be one of several versions: author’s original, accepted manuscript or the publisher’s version. / La version de cette publication peut être l’une des suivantes : la version prépublication de l’auteur, la version acceptée du manuscrit ou la version de l’éditeur.
Access and use of this website and the material on it are subject to the Terms and Conditions set forth at
Use of a one-point liquid limit procedure
Eden, W. J.
https://publications-cnrc.canada.ca/fra/droits
L’accès à ce site Web et l’utilisation de son contenu sont assujettis aux conditions présentées dans le site
LISEZ CES CONDITIONS ATTENTIVEMENT AVANT D’UTILISER CE SITE WEB.
NRC Publications Record / Notice d'Archives des publications de CNRC:
https://nrc-publications.canada.ca/eng/view/object/?id=a81c101d-ac42-446d-a7d1-d6b59d70ba32 https://publications-cnrc.canada.ca/fra/voir/objet/?id=a81c101d-ac42-446d-a7d1-d6b59d70ba32Ser
TH1
N21r2
no.
117
c. 2
BLDGNATIONAL
RESEARCH
COUNCIL
"
A
~
~
~
CANADA
DIVISION O F BUILDING RESEARCH
USE OF A ONE
-
POINT LIQUID LIMIT PROCEDURE
BY
W. J. EDEN
REPRINTED FROM
AMERICAN SOCIETY FOR TESTING MATERIALS SPECIAL TECHNICAL PUBLICATION NO. 254. 1959
P. 168
-
177RESEARCH PAPER NO. 1 1 7
O F T H E
DIVISION O F BUILDING RESEARCH
OTTAWA
DECEMBER 1960
This p u b l i c a t i o n i s being d i s t r i b u t e d by t h e Division of Building Research of t h e National Research Council a s a c o n t r i b u t i o n towards b e t t e r b u i l d i n g i n Canada.
It should not be
reproduced i n whole o r i n p a r t , without permission o f t h e ori- g i n a l publisher. The Division would be glad t o be of a s s i s t a n c e i n o b t a i n i n g such permission.F u b l i c a t i o n s of t h e Division of Building Research may be obtained by m a i l i n g the a p p r o p r i a t e remittance, (a 3ank, Express, o r Post Office Money Order o r a cheque made payable a t par i n Ottawa, t o t h e Receiver General of Canada, c r e d i t National Research council) t o t h e N a t i o r a l Research Council,
Ottawa. Stamps a r e not acceptable.
A coupon system has been introduced t o
make payments f o r p u b l i c a t i o n s r e l a t i v e l y simple. Coupons a r e a v a i l a b l e i n denominations of 5, 25, and
9
c e n t s , and may be obtained by makinga
re- mittance a s i n d i c a t e d above. . These couponsmay
be used f o r t h e purchase of a l l National Research Council p u b l i c a t i o n s including s p e c i f i c a t i o n s ofAuthorized Reprin ,yrighted Soils-192
Special Teclinical Plcblicaliotc iVo. 254
Published b y the
A ~ I E R I C A X SCCIETY FOR TESTISC SIATEBI:\LS
1959
ANALYZED
USE O F A O K E - P O I K T L I Q U I D L I M I T PROCEDURE
T h e Soil Mechanics Laboratory of thc Division of Builtling Research has used a 1-point liquid limit procedure for most routine tests since 1955. The decision to use the shortened method was based on a statistical study of 390
previous tests made by the 3-point method. This paper reviews the analysis of the test records available to the author along with the results of three other independent investigations on 1-point methods. After considering the vari- ability which call be expected in the liquid limit test, the conclu~ion is reached that no additional significallt errors are i~ltroduced through a 1-point method. A detailed 1-point test procedure is appended to the paper.
The 1-point liquid limit test depends mere assembled, it mas concluded that upon the assumption t h a t the flow line all soils, regardless of geological origin, for the number of blows, S, versus water might be treated as having a flow line of content is considered straight on a log- constant slope. The Vicksburg Labora- arithrnic plot over a limited range of 11-. tory (1) proposed the following equation Knowing the slope of the flow line, t h e for determining the liquid limit:
water content a t 23 blows may be extrap-
olated from the water conteilt deter- I.L = u, ( : ) t T z l B
mincd a t N blows, through use of a n
appropriate correction factor. where:
The 1-point liquid limit test has been LL = liquid limit of the soil, per cent, the subject of a number of investigations w = water content a t A' bloivs per since 1949. T h e U. S. Waterways Exper- cent,
iment Station a t Vicksburg published 11- = =umber of bloll~s, a n d
( I ) ~ the results of the analysis of 767 tests tan
p
= slope of the flow line on a log o n soils in the illississippi Valley. This water content logN
plot. investigation was started in view of For the 767 test results, i t mas found Casagrande's comment to the effect t h a t that the average value of tanp
nras soils of a common geological origin might 0.121 and that the standard deviatioll of have flow lines of a constant slope hen tanfl
was f 0.032. I t lvas concluded t h a tboth the water content and the number for classification purposes, the 1-point of blows were plotted on logarithmic method could be used if t h e number of scales. When the results of the 767 tests blows !Vas kept within the range of 15
1 nesearch officer, Division of Buildillg l i e - to 41. If t h e test results Were 10 be used search, National Research Cou~lcll of Canada, for quantitative correlation purposes, the Ottawa, Ont., Canada.
2 The boldface numbers in parenthesis refer number of blows should be kept within t o the list of references appended to thls paper. the range from 20 to 3 1 blows.
I n 1954, Olmstead and Johnston (2) previously (2,4) and has arrived a t the presented analyses of the results of 759 equation
tests on soils from various points in the fi o 10s
USA. Their treatment was slightly dif- LL = 2‘1
(%)
ferent than that of Vicksburg and ex-
pressed the flow ecluation as: Thus more than 2500 liquid limit tests have been studied, with a view to deter-
?a
LL = mining the slope of the flow line, for use
1.419 - 0.3 log N with a 1-point liquid limit test.
~vhich could be reduced to: TREATAIEXT OF RECORDS
I n this paper, the procedure for deter- mining the flow line was the same a s
Tan B
FIG. 1.-Histogram Showing Distribution ol Values of tan 0 Xboul Mean, 484 Observations.
T h e latest extensive investigation has that used by Vicksburg (1). Test results
been made by Norman (3) of the Road were assembled from which the liquid Research Laboratory in England. Five limit had been determined from three o r hundred and four tests on soils from more points indicating the water content Great Britain and overseas were treated a t a certain number of blows. From each and the following equation was obtained: test, the flow line was extended until the water content corresponding to 10 blows and 30 blows could be obtained. .Tan
0
for the test was calculated by: I n the present paper, the author has
analyzed the results for 484 tests on log zu10 - log ~0 t a n 01 =
The arithmetic mean for the value of tan from the 484 observations ~ v a s found to be 0.108. The results of the 484 determinations of t a n
p
are presented graphically on the histogram in Fig. 1. I t will be noted that the histogram is skewed. By graphical analysis following Inman's method (5), it was found that the geometric mean value of tanp
was 0.102late the liquid limit. I11 each case, the
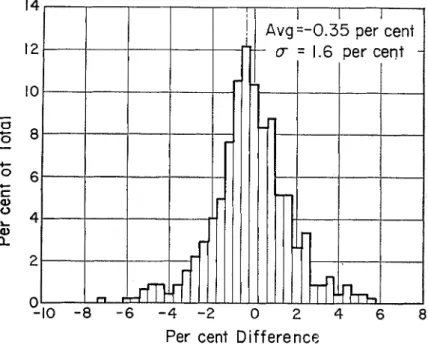
multi-point liquid litnit was assumed t o be correct and the 1-point liquid limit i n error. The differences obtained for 444 of the 484 tests are presented in the form of a histogram in Fig. 2. Geometric mean difference was found to be -0.35 per cent of the liquid limit with a standard deviation of &1.6 per cent. The same
Per cent Difference
FIG. 2.-Distribution of Differences Between LL. Determined by 3 Points and by 1 Point when
N was Between 15 and 20 and 30 and 35, 444 Observations.
and that the standard deviation was f 0.036.
I n order to assess the errors inherent in the 1-point method, the 484 observa- tions were treated in the following man- ner. First the liquid limits as determined by the multi-point method were tabu- lated. Then the test record sheets were screened, taking a water content corre- sponding to the number of blows in the range from 15 t o 20 or from 30 to 35. This water content was used in conjunc- tion with the coefficients given in the pro- cedure appended to this paper to calcu-
procedure was again repeated, this time keeping the number of blows in the range from 20 to 30. Figure 3 presents the histogram from the analysis of 453 tests. Here the geometric mean difference was observed to be -0.20 per cent of the liquid limit with a standard devia- tion of f 0.60 per cent.
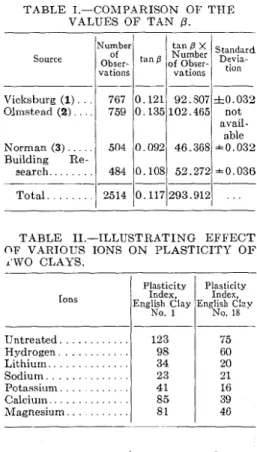
The values of tan
P
from four sources are tabulated in Table I. I t can be seen that the average value of t a n ,B of the 2514 observations is within the range of tanp
f the standard deviation fromFACTORS INFLUENCING LIQUID LI!+IIT concentration may be obtained from re- Before attempting to assess the l-point cent work in Norlvay by Bjerrum and liquid limit procedure, it may be helpful Rosenqvist (7). During experiments to to revielv the factors that might influ- measure the effect of leaching of salt ence the liquid limit determination. The the Norlvegian i t was found liquid limit value for a single test may be that the liquid limit of a leached clay influenced by ( a ) the salt or ion concen- Was 28 per cent. When sufficient salt
was added to the same sample to bring
Per cent Difference
TABLE I.-C031PARISON OF TFIE VALUES OF TAN P . Number Source Vicksburg (1). . . Olmsteacl (2). . . . Norman (3) . . .
1
504 10.0~21 46 .368/ h 0 . 0 3 2 Building Re- . . . search. 484 0.108 52.272 * 0.036 . . . Total./
2514 /0.1171293.912/ TABLE 11.-ILLUSTRATING E F F E C T OF VARIOUS IONS O N PLASTICITY O F r'WO CLAYS.Plasticity Plasticity Ions
1
'n Index I ~ s h d a y1
Englishzty8
d:nv5 0 . 1 Untreated . . . 123 75 . . . Hydrogen. Lithium. . . . . . Sodiu~n 23 21 . . .
FIG. 3.-Distribution of Differences Betwccn Potassium. 41 16
. . .
LL Determined by 3 Points and b y 1 Point Calciu~n.. 8 5 39
. . .
when A was Between 20 and 30, 6 3 M s e n r M a g n a i u m . . 81
1
46tions.
tration of the sample, (b) the drying history of the sample, and ( c ) the effect of different operators and apparatus.
Salt or ion concentration of the soil has a considerable effect on the liquid limit. Reference may first be made to the work of Ahlberg (6) in Sweden. Ahl- berg determined the plasticity index for two English clays which were treated with various ions. Table I1 has been taken from Ahlberg's paper.
Other evidence o n the effect of ion
the pore water salt concentration t o about 35 g per liter, the liquid limit in- creased to 41.5 per cent.
Recently some experiments were tried on samples from a profile of extremely sensitive Leda clay near Ottawa. At this site, the clay had a brown oxidized weathered surface crust lying over a stiff fissured clay which presumably resulted from another weathering process similar to that described by NIoum and Rosen- qvist (8). Below this the clay was soft
and unfissured with a sensitivity greater than 100. The pore-water salt concen- tration throughout the profile was found to be less than 1 g per liter. Liquid limits were conducted on samples dried from their natural water content to a value near their liquid limit. Then the salt concentration was adjusted on the sam- ple to a value slightly in excess of 30 g per liter and the liquid limit test repeated after the salted clay had been thoroughly mixed and allowed to soak for approxi- mately 24 hr. The results are presented in Table 111.
TABLE 111.-EFFECT O F SALT CONCEN- TRATION ON LIQUID LIMIT.
No. 8 7 - 9 . . . . . No. 87-10.. . . No. 87-11.. . . No. 87-12.. . . No. 87-13. . . No. 87-14. . . No. 8 7 - 1 5 . . . . . No. 87-16.. . . No. 87-17.. . . No. 87-18.. . .
I t will be noted that samples from be- low the 24-ft depth reacted strongly to the additions of salt, while those above 24-ft depth did not. This difference might be attributed to the entire clay profile a t this location being leached from its orig- inal salt concentration. In addition to the leaching, the upper portion of the clay profile has been weathered and hence the ion complex had again been altered. Thus when salt was added, the liquid limit of the leached clay was increased while in the leached and weathered clay this effect was offset by the weathering process.
Moum and Rosenavist (8) have dem- onstrated the effect of weathering in the presence of oxygen on the liquid limits of clays. The liquid limit of a natural
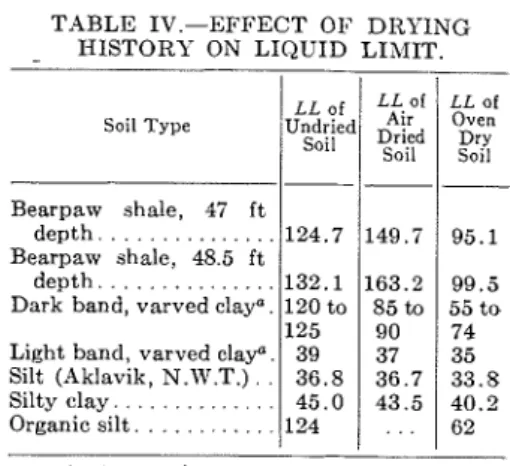
clay was 62.5 per cent. The same clay stored for 14 days at 60 C in space from which air had been evacuated gave a liquid limit of 61.0 per cent. Another portion of the same sample was stored for 14 days a t 20 C in the presence of air and gave a liquid limit of 73.3 per cent. I t follows from the previous para- graphs that the drying history of the sample previous to the liquid limit deter- mination can influence the value of the liquid limit. On a number of occasions, the Division of Building Research has
TABLE 1V.-EFFECT OF DRYING I l I S T O R T ON LIQUID LIMIT. -- I Soil Type Bearpaw shale, 47 ft depth . . . 124.7 Bearpaw shale, 48.5 ft depth . . . 132.1 Dark band, varved claya. 120 to 125 Light band, varved c l a p . 39 Silt (Aklavik, N.ITr.T.) . . 36.8 Silty clay. . . 45.0 Organic silt. . . 124
a (Cooling (9))
conducted liquid limits on samples near their natural state and in the air-dried and oven-dried state. Table I V presents some of the results along with two results on Bearpaw shale from Saskatchewan given here with the permission of R.
Peterson, Prairie Farm Rehabilitation Administration, Saskatoon, Sask.
I t is realized that the ASTM Method
D 423 - 54 T calls for the test to be con- ducted on samples which had been pre- viously air dried, so that all tests are conducted on specimens with a common drying history. I t will be noted, however, from Table I V and from the previous discussion, that all soils do not react similarly to drying. Therefore, the ques- tion arises as to whether it is advisable
to specify air-dried materials for the liquid limit test.
Errors due to the apparatus have re- cently been discussed by Casagrande (10) as follows:
1. Variations in size and resiliency of the base of the apparatus,
2. Influence of position of device on
bench or table,
3. Variation in dimensions of the
grooving tool,
4. Errors in adjustment of height of blow, and
5 . Surface of inside of cup.
Different operators have been found to give slightly different results. Olm- stead (2) states that based on many co- operative check tests using experienced operators, liquid limits cannot be ex- pected to agree any closer than within
k 2 per cent of the liquid limit value.
Olmstead's statement suggests that, if the errors due to the 1-point method fall within the same range (f 2 per cent) the
1-point test should be an acceptable pro- cedure. I t can be seen from the four in- vestigations that tan
/3
varies over a range of values from about 0.01 to 0.4. The arithmetical average value of t a n/3
for the 2514 tests reported is 0.117. Be- cause in the process of averaging the large values of tan
/3
will outweigh the small values, the geometric mean value of tan /3 will probably be somewhat less than 0.117. Inspection of the histograms presented by Vicksburg (I), Norman (3),and in Fig. 1 indicate that the frequency diagrams are skewed towards the smaller values of tan /3. This consideration has led the author (4) to adopt tan /3 = 0.1 for calculating correction factors given in the Appendix. T h e histograms show- ing the distribution of errors were cal- culated by using tan /3 = 0.1.
I t should be pointed out that varia-
tions in the value of tan
/3
have a com- paratively minor effect on the determina- tion of the liquid limit. According to the analysis of errors given b y Vicksburg (I), if the number of blows are kept within the range from 20 to 30, t a n /3 can vary within the limits of f 0.05 with errors of only 1 per cent or less. When the actual test records were used for assessing errors in the I-point method, it was found that when the blows are kept within the range from 20 to 30, 98 per cent of all the ob- servations have an error limited to thef 1.8 per cent error range. The only
criterion for selecting the records used in this analysis was that the flow line was determined by three or more points. Figures 2 and 3 are therefore considered to be a fair assessment of the 1-point method.
Major errors in the 1-point method can be prevented by repeating the mix- ing, grooving, and determination of blows until three successive determina- tions of iV show a logical agreement. The I-point method has been used in the Soil Mechanics Laboratory of t h e Division of Building Researchsince 1955, for almost all routine testing. The only exceptions are for organic soils and i n tests when there is difficulty in obtaining a logical sequence in the number of blows. On a number of occasions, the 1-point method has been checked by a 3-point method test and in no case has a serious discrepancy been found.
OTIIER POSSIBILITIES FOR SHORTENED
Since the liquid limit test is really a
dynamic shear test of the soil at a certain water content, Casagrande (lo) suggests that a more accurate determination might be made through use of a simple shear test. He suggests that a simple direct shear test, static penetration test, or "squeeze" test might eliminate some of the difficulties. Kecently, two author-
ities have published articles on the use of a cone penetrometer for determining the liquid limit. Uppal and Aggarwal (11) in India have found that a cone with a half angle of 15 deg 30 min, weighing 148 g, will give the liquid limit when the cone penetrates 1 in. Curves have been derived from which the liquid limit may be calculated and the penetration read- ing is within the range from 0.8 to 1.1 in. Feda and Skopek (12) report that the Vasiljev test (a 30 deg static cone weigh- ing 76 g) is in use in the Czechoslovakian Academy of Science and in the USSR. These writers claim that the variability of test results with the Vasiljev test is only half that of the Casagrande device. At the Soil Mechanics Laboratory, Division of Building Research, an at- tempt is being made to correlate pene- tration of a 60-deg cone weighing 60 g with the number of blows in the liquid limit determination. Sufficient results have not been obtained as yet to make any significant correlations, but if the correlation is good, as apparently other workers have found, the cone test will offer considerable savings in time over even the 1-point liquid limit test.
tic limit, has proved to be one of the most useful correlative values in the practice of soil mechanics. There are, for example, the plasticity chart developed by Casagrande (14), the activity chart proposed by Skempton (IS), and the re- lation between seilsitivity and liquidity index shown by B jerrum (16).
Because of the wide range of tolerance, which is apparently acceptable in the liquid-limit determination, the author submits that the errors introduced through the use of a 1-point method will not alter the general usefulness of the test, provided major errors are guarded against. If the number of blows is kept between 20 and 30, the error will be less than f 2 per cent of the liquid limit value for 99 per cent of the tests.
I t is suggested that the cone method offers considerable potential savings in time over even the 1-point method. Be- fore the cone method can be generally accepted, it should define accurately the liquid limit as determined by the Atter- berg method in order to make use of the great collection of useful correlations that has been derived through use of the Atterberg tests.
The liquid limit test is really a dy- namic shear test for finding the water content of a remolded soil when its shear strength is in the order of 0.2 psi. Nor- man (13) shows a range from 0.11 psi to 0.32 psi. Hence all the factors influencing shear strength of the soil also affect the value of its liquid limit. In spite of the limitations of the test, the liquid limit of a soil, considered together with its plas-
This paper is presented as a contribu- tion from the Division of Building Re- search, National Research Council of Canada with the approval of the Director of the Division. The author wishes to acknowledge the assistance given him by his colleagues in the Soil Mechanics Laboratory, particularly the research technicians who assembled and sum- marized the many test records.
(1) "Simplification of the Liquid Limit Test (2) F. R. Olmstead and C. &I. Johnston, Procedure," Tccl~nical Meiizora~tdz~iu N o . 3, "Rapid Methotis for Determining Liquid
U. S. Waterway Experiment Station, Vicks- Limits of Soils," Bzllleli?~ 95, Highway Re- burg, Miss., p. 286 (1949). search Board, Washington, p. 27 (1955).
(3) L. E. J. Norman, *'The One-Point Method of Determining the Value of the Liquid Limit of a Soil," Geolecltniqzre, Vol. 9, NO.
1, p. 1 (1959).
(4) W. J. Eden, "Trial of the One-Point Liquid Limit Method," Tecltnical Me?)zorandz~?)z N o . 41, National Research Council, Ottawa,
Associate Committee on Soil and Snow Mechanics, (1956).
(5) D . L. Inman, "Measures for Describing the Size Distribution of Sediments,"
Journal o j Sedit)zenlarjj Pelrology, Vol. 22, No. 3, p. 125 (1952).
(6) R. Ahlberg, "A Contribution of the Meth- ods of Measuring the Plasticity of Clays,"
Transaclions, Chalmers University of Technology, Gothernburg (Sweden), No.
119 (1951).
(7) L. Bjerrum and I. Th. Rosenqvist, "Some Experiments with Artificially Sedimented Clavs," Geoleclmiqzie, - .Vol. 6, No. 3, . p. - 124 (i956j.
(8) J. Moum and I. Th. Rosenqvist, "On the Weathering of Young Marine Clay,"
Proceedings, Fourth International Confer- ence on Soil Mechanics and Foundation Engineering, London, Vol. 1, p. 77 (1957). (9) L. Cooling, Discussion of "Soil Engineering
a t Steep Rock Iron Mines, Ontario, Can- ada," Proceedifzgs, Institution of Civil En- gineers, Papcr No. 6304, Vol. 13 (1959). (10) A. Casagrande, "Notes on the Design of
the Liquid Limit Device," Geolechniqzte,
Vol. 8, No. 2, p. 84 (1958).
(11) H. L. Uppal and H. R. Aggarwal, "A New Method of Determining Liquid Limit of Soils," Road Research Birllelin, The Indian Roads Congress, New Delhi, No. 4, p. 1 (1957).
(12) J. Feda and J. Skopek, "Letter to Editor,"
Geolecliniqzte, Vol. 9, No. 1, p. 30 (1959). (13) L. E. J. Norman, "A Comparison of Values
of Liquid Limit Determined with Appara- tus Having Bases of Different Hardness,"
Geolecl~niqz~e, Vol. 8, No. 2, p. 79 (1958). (14) A. Casagrande, "Classification and Identi-
fication of Soils," Proceedings, Am. Soc. Civil Engrs., Vol. 73, p. 783 (1947).
(1-5) A. W. Skempton, "The Colloidal 'Ac- tivity' of Clays." Proceedings, Third Inter- national Conference on Soil Mechanics and Foundation Engineering, Vol. 1, p. 57 (1953).
(16) L. Bjerrum, "Geotechnical Properties of Norwegian Marine Clays," Geolecl~tziqzre,
Vol. 4, No. 2, p. 49 (1954).
APPENDIX
S U G G E S T E D P R O C E D U R E F O R ONE-POINT LIQUID L I M I T D E T E R M I N A T I O N T h e liquid limit denotes t h a t moisture
content a t which a sample of soil just passes from a liquid to a plastic state. I t is arbi- trarily chosen a s the moisture content a t which two sections of a p a t of soil begin t o flow together when subjected in a cup t o the impact of 25 sharp blows from below. T o eliminate the personal element, which usu- ally has an important influence in this test, a standardized mechanical device is used.
Equipnzeirl
( a ) Morlar a n d Rtibber-Covered Peslle. ( b ) Sieve, No. 40.
( c ) D i s h , evaporating medium size.
( d ) Spattila.
( e ) W a s h Bottle with distilled water.
(f) L i q u i d L i m i t Device (as defined in X S T M Method D 423 - 54 T.3
3 Tentative Method of Test for Liquid Limit
of Soils (D 423-54 T), 1958 Book of ASTM Standards. Part 4, p. 1133.
( g ) Casagvande Grooving T o o l s , 3 or 4. (It) M e t a l Weighittg T i n s , 1 or 2.
(i) B a l a n c e sensitive t o f 0 . 0 1 g.
( j ) Ovew, constant temperature, 105 t o 1 l 0 C .
( k ) Desiccalor. Procedure
T h e test is often performed on a soil salll- ple in its natural state. If t h e sample h a s begun to d r y out, however, i t should b e thoroughly air-dried and tested from the air- dried state. A sample which h a s previously been oven-dried, or a sample whose "drying history" is unknown, should not be usecl. Note the original conditions of the sample on t h e d a t a sheet for "Xtterberg limits" which is used.
( a ) Choose a representative 150 t o 200 g sample of soil. If this sample is in the natural moist state, remove all particles larger than in. with the fingers. If the sanlple has been
air-dried, grind it in a mortar, using a rub- ber-covcrccl pestle, and pass it through a No. 40 sieve to relnove the coarse particles.
(b) Mix the sample in an evaporating dish
to the consistency ol a very thick paste, us- ing distillecl tvater.
(c) Cover the dish and allow the soil to
soak, preferably overnight. Record the time of soaking on the data sheet.
(d) Using the handle of the grooving tool as a gage, check the liquid linllt device to insure that the height of fall ol the cup is exactly 1 cm, and adjust if necessary. This should be the vertical clistallce lrom the center of the worn spot on the cup to the solid base, when the crank is just about to drop the cup. Set the device in a predeter- mined spot on a table ol sturdy construction, where it will remain throughout the test. (See "Soil Testing for Engineers," Lambe, p. 152, for an illustration of the adjustment of the device.)
(e) Place some of the soil sample in the cup of the liquid limit clevice to a depth of
-2 in., being careful not to entrap any air
bubbles, and smooth the surface with a spatula so that it is horizontal when the cup is a t rest in the device.
(f) Take the cup in the pall11 of one hand.
Holding the grooving tool perpendicular to the surlace of the cup, and starting a t the back, cut a groove in one colltinuous motion along the diameter through the center line
of the cam follower. I11 silt!; and sandy soils
it inay so~netimes be necessary to cut the groove with a spatula or special tool, using the grooving tool to chcclc dimensions.
(g) Place the cup gently in the liquid-
limit device. Turn the handle a t approxi- mately 2 turns per second until the bottom
of the groove is closed for a distance of $ in.,
and record the number of blo~vs. T o insure that the handle is rotated smoothly, the operator should stand facing the handle of the device. The number of blows must lie t)etmecn 20 and 30 before proceeding with the test. More blows than 30 require the addition of distilled water and remixing while less than 20 blows requires air drying.
(11) Repeat the operation of mixing in the cup, grooving and testing until 3 successive
dctcrlninations sho\v logical agreement \vith a difference oi not more than 1 or 2 blows. Record the number of blows for these last 3 determinations.
(i) Immediately transfer a minimum of
10 g of the soil from the vicinity of the closed groove to a weighing tin ancl cover the tin.
( j ) Weigh the tin containing the sample to the nearest 0.01 g and record.
(k) Dry the open tin in the own ovcr- night.
( I ) After drying, replace cover and place in the desiccator to cool and then weigh to 0.01 g.
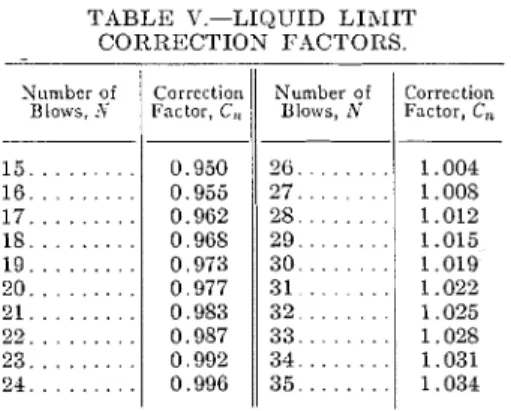
TABLE V.-LIQUID L I h I I T CORRECTION FACTORS.
-
Kornbcr of
/
Corrcction Number of Corrcction B i s i , I t oC,,1
0 ,I1
Fartar. C.(VL) Colnputc the water content based on
the dry weight of the soil. T h e liquid limit is then computed by multiplying the water
content a t 1V blo\vs by the correction factor
corresponcling to
iV
blows, in Table V.NOTIC.-The determination of the liquid limit by the methorl outlined above assumes that the slope ol the "flow line" is constant (0.100) for all soils. This assuinption is not strictly correct, but the error illtroduccd may be neglected in all cases except (1) where special accuracy is required of the test; (2) for highly organic soils.
If there is clificulty in obtaining a con- sistent number of blows for the one deterrni- nation, a second determination a t a different number of blows, preferably close to 25, should be made. In all cases, the nearer to 25 blows that the determination is made, the more accurate the test is likely to be.
Authorized Reprint from the Copyrighted Soils-1959 Meetings
Special T e c l m i ~ a l Plrblicalion Aro. 2f4
Published by the
A ~ R I C A K SOCIETY aoa TESTING MATERIALS 1959
DISCUSSION
MR. EDWARD A. ABDUN-NUR' (by letter).-In analyzing 2514 pairs of test results on the 1-point and the standard methods of liquid limit test, the author has given the profession a very fine sum- mary of the extensive work done to date in comparing the two methods, and pre- sents a very convincing case for the use of the 1-point test method.
The standard deviations for the vari- ous values of tan ,B appear a little high for good reliability. I t is, of course, true as the author points out, that small changes in tan
0
do not affect the final test result appreciably, and because of this, the relatively large standard devia- tions and the author's recommendation to use a value of 0.1 for tan p, would probably provide entirely adequate re- sults.I t would be of interest, however, to know what the coefficient of correlation and its probable error for this extensive
1 Consulting Engineer, Denver, Colo.
set of data might be. With over 2500 pairs of observations, the reliability of such a correlation would be high and would add confidence to the use of the 1-point test.
MR. W. J. EDEN (author).-Mr. Abdun-Nur has asked for the coefficient of correlation for the measurements of tan p given in the paper. This could be done for only the 484 tests conducted a t the Division of Building Research. Be- cause the final liquid limit result is rather insensitive to variations of tan p, the author hesitates to undertake the con- siderable volume of calculations neces- sary to do so.
By way of supplementing the informa- tion on tan given in the paper, refer- ence is made to D. Mohan and R. K.
Goel who report the analyses undertaken in India."
2D. Mohan and R. K. Goel, "Letter to Editor," Geotechnique, Vol. 9, No. 3, p. 144 (1959).
A