Crevice Volume Effect on Spark Ignition Engine Efficiency
byPatrick M. Smith
B.S., Mechanical Engineering Georgia Institute of Technology (2011)
Submitted to the Department of Mechanical Engineering in Partial Fulfillment of the Requirements for the Degree of
Master of Science in Mechanical Engineering
at the
MASSACHUSETTS INSTITUTE OF TECHNOLOGY
MASSACHUSETTS INSV OF TECHNOLOGY
NOV 12 2013
IUBRARIES
September 2013
© 2013 Massachusetts Institute of Technology. All rights reserved
Signature of A uthor...
Department of Mechanical Engineering July 8th 2013
C ertified b y ... ...
Wai K. Cheng Professor of Mechanical Engineering Thesis Supervisor
Certified by...I...
John B. Heywood Sun Jae Professor of Mechanical Engineering /-0 , }hesis Supervisor
A ccepted by ... ...
David Hardt Professor of Mechanical Engineering Chairman, Department Committee on Graduate Theses
Crevice Volume Effect on Spark Ignition Engine Efficiency
byPatrick M. Smith
Submitted to the Department of Mechanical Engineering on August 7 h, 2013 in Partial Fulfillment of the Requirements for the Degree of Master of Science in
Mechanical Engineering
Abstract
A set of experiments and a simulation study are completed to quantify the effect of the piston
crevice on engine efficiency. The simulation study breaks down the loss mechanisms on brake efficiency at different displacement volumes (300 - 500 cc) and compression ratios (8-20).
Experiments focus on indicated efficiencies for a narrow range of compression ratios
(9.24-12.57) with different piston crevice volumes. Piston crevice volume is increased in two steps by
machining a groove into the piston top land, and is decreased by raising the top ring. Indicated efficiency is measured at various loads (0.4 - 1.0 bar MAP), speeds (1500, 2000, 2500 rpm), and coolant temperatures (50'C and 80'C). All data points compared in this study are recorded at MBT timing with a relative air-fuel ratio (k) of 1.
For the baseline case (CR = 9.24, speed = 2000 rpm, coolant = 80'C), increased crevice
volume results in an indicated efficiency degradation of 0.3-0.5%-points per 1000 mm3. This absolute decrease corresponds to a 1.2-1.5% relative decrease for a 100% increase in crevice volume; referenced to the control piston crevice modification. Decreasing crevice volume leads to a gain in indicated efficiency of 2.3-3.5%-points per 1000 mm3, which corresponds to a
6.9-11.8% relative increase for a 100% decrease in crevice volume; referenced to the control piston
crevice modification.
Results of the experimental investigation, when compared across compression ratio, engine speed, and coolant temperature, show that the crevice effect on efficiency is largely independent of these three parameters. Large gains from decreased piston crevice volume prompt renewed discussions on piston top land, top ring, and crown design.
Thesis Supervisor: Wai K. Cheng
Title: Professor of Mechanical Engineering
Thesis Supervisor: John B. Heywood Title: Professor of Mechanical Engineering
Acknowledgments
I have to start with the two most important people to my research and experience here at
MIT, my advisors, Professors Wai Cheng and John Heywood. They constantly challenged me to dive deeper into results, while providing necessary guidance, so that I learned more than I could have previously imagined about automotive engines. They made possible numerous opportunities, significantly broadening my analytical, interpersonal, and teaching abilities. I've notched down so many firsts: became a teaching assistant, presented a paper at a major
conference, and discuss experimental results with industry leaders. One of the highlights of my two years at MIT was attending the SAE World Congress with Professor Cheng; delivering a presentation, learning about modern research topics, and general chilling with Professor Cheng. This time at MIT has taught me plenty about engineering, but significantly more about what I am personally capable of, and I owe a huge portion of this to Professors Cheng and Heywood.
The Sloan Automotive Lab has been a great place to work. I would like to thank all of the MIT employees who make sure the lab runs smoothly. Specifically, I would like to thank Janet Maslow and Karla Stryker for helping me set up meetings, putting together consortium presentations, and being patient helping me with the many little things I wasn't familiar with. On the technical side I would like to thank Raymond Phan for helping me build and fix things on my engine, and Thane DeWitt for coordinating purchases and repairs.
Without my fellow students in the Sloan Automotive Lab there were many days when I would have just been hopelessly lost. I want to thank Kevin Cedrone, Justin Ketterer, Jacob McKenzie, and Tomas Vianna Martins for all of their help around the lab. Each of you has helped me immensely in fixing engine problems, perfecting data analysis techniques, and providing valuable insight into experimental techniques.
I would also like to thank Dr. Tian Tian for helping out on blowby simulations. Even with
very little notice and many other things going on you helped me get some valuable results. I really appreciate that.
My research is made possible by members of the MIT Engine and Fuels Consortium: Borg
Warner, Chrysler, Ford, and General Motors. I would especially like to thank Tom Leone and Rick Davis, who both took an active interest in my project and whose cooperation contributed to many aspects of this project and thesis. These consortium meetings were incredibly valuable in advancing my research and always provided great feedback. The regular meetings provided necessary structure to this study and kept me on my toes trying to obtain and explain data. They also provided a great excuse to celebrate over a couple of drinks.
I would like to thank all of my friends for making certain I had fun outside of research. Y'all
made sure my two years at MIT were anything but dull and for that I am incredibly grateful. Finally, I would like to thank my family for always being supportive, pushing me to succeed, and giving me great advice along the way. I may not even have applied to MIT without your encouragement and definitely wouldn't have gotten in without your guidance. You guys have always been there for me and I love you all so much. I couldn't have asked for a better family.
Table of Contents
A b stra ct ... 3 Acknowledgm ents ... 5 Table of Contents ... 7 List of Figures ... I I List of Tables ... 17 Nom enclature ... 19 1 Introduction ... 211. 1 Turbocharged Downsized Engines ... 21
1.2 Total Engine Crevices ... 22
1.3 Crevice M echanism ... 24
1.3.1 Lam inar Flam e Quenching ... 24
1.3.2 Piston Therm al Expansion ... 25
1.4 Crevice Effect on Efficiency ... 26
1.4.1 Crevice Outflow ... 26
1.4.2 Crevice Oxidation ... 27
1.5 Crevice Effect on Em issions ... 29
1.6 Compression Ratio Effect on Efficiency ... 30
1.7 Research Objectives ... 33
2 Efficiency Sim ulation Study ... 35
2.1 Introduction ... 35
2.2 M ethodology ... 35
2.2.1 Friction M odel ... 37
2.2.2 Crevice M odel ... 37
2.2.3 W ork Accounting ... 40
2.3 Part Load Results ... 41
2.3.1 Pum ping Loss ... 41
2.3.2 Friction Loss ... 42
2.3.3 Heat Loss ... 44
2.3.5 Brake Efficiency ... 46
2.3.6 Com ponent Breakdown ... 48
2.4 Full Load Results ... 49
2.4.1 Pum ping Loss... 49
2.4.2 Friction Loss ... 50
2.4.3 H eat Loss ... 51
2.4.4 Crevice Loss... ... 51
2.4.5 Brake Efficiency ... 52
2.4.6 Com ponent Breakdown ... 53
2.5 Sum m ary and Conclusions ... 55
3 Experim ental M ethod... 57
3.1 Engine Setup... 57
3.1.1 Engine Specifications... 57
3.1.2 A ir Inductance System ... 59
3.1.3 Fuel System ... 60
3.2 Engine Control and M easurem ent ... 60
3.2.1 Engine Control U nit... 60
3.2.2 D ata Acquisition System ... 61
3.2.3 Manifold Absolute Pressure Measurement and Control... 61
3.2.4 In-Cylinder Pressure M easurem ent... 61
3.2.5 Fuel Flow M easurem ent ... 62
3.2.6 A ir Flow M easurem ent ... 63
3.2.7 A ir-Fuel Ratio M easurem ent ... 63
3.2.8 Hydrocarbon Em issions M easurem ent... 63
3.2.9 CO and CO 2 Em issions M easurem ent ... 64
3.2.10 Tem perature M easurem ent and Control... 65
3.3 Total Engine Crevices... 65
3.4 Piston Crevice M easurem ents and M odifications... 67
3.5 Experim ents ... 70
3.5.1 Procedure ... 70
3.5.2 Fuel ... 70
4 A nalysis Tools... 73
4.1 One Zone H eat Release... 73
4.1.1 Ratio of Specific Heats ... 74
4.1.2 Residual M ass Fraction... 75
4.1.3 H eat Transfer ... 76
4.1.4 Crevice M odel... 78
4.2 Crevice H ydrocarbon Em ission M odel... 78
4.3 Piston-Ring Pack M odel ... 80
5 Experim ental Results and Analysis... 81
5.1 Part Load D efinition ... 81
5.2 Baseline Case ... 81
5.2.1 Case D efinition ... 81
5.2.2 M ass Trapped in Piston Crevice ... 82
5.2.3 Flam e A rrival at Piston Crevice... 87
5.2.4 Crevice V olum e Effect on Efficiency ... 89
5.2.5 Burning Characteristics... 94
5.2.6 Em issions ... 105
5.2.7 Blow by... 110
5.3 Effect of Com pression Ratio... 110
5.3.1 Com pression Ratio Effect on Efficiency ... 110
5.3.2 Baseline Case w ith Com pression Ratio Effect ... 112
5.3.3 Crevice V olum e Effect on Efficiency ... 114
5.3.4 Blow by... 119
5.4 Effect of Engine Speed ... 119
5.4.1 Crevice V olum e Effect on Efficiency ... 119
5.4.2 Blow by ... 126
5.5 Effect of Coolant Tem perature ... 126
5.5.1 Crevice V olum e Effect on Efficiency ... 126
6 Conclusions...133
6.1 Crevice V olum e Effect on Efficiency ... 133
6.1.1 Sim ulation Study... 133
6.1.3 A cross Com pression Ratio... 134
6.1.4 A cross Engine Speed ... 134
6.1.5 A cross Coolant Tem perature ... 134
6.2 Com pression Ratio Effect on Efficiency ... 135
6.2.1 Sim ulation Study... 135
6.2.2 Experim ental Results ... 135
6.3 A pplication to Engine D esign... 135
6.3.1 N ew Top Land H eight ... 135
6.3.2 Piston and Top Ring Concerns ... 136
6.3.3 Increased Im portance in Future Engines... 136
Appendix A : Tw o-Plate Quench D istance... 137
A .1 G as Properties ... 137
A .2 Lam inar Flam e Speed ... 140
A ppendix B : Orifice Flow ... 143
B.1 Liquid Flow ... 143
B.2 G as Flow ... 144
Appendix C : A dditional Plots across Speed ... 147
A ppendix D : A dditional Plots across Coolant Tem p... 153
List of Figures
Figure 1-1 LA4 drive cycle results for a small passenger vehicle showing majority of city driving takes place at p art lo ad ... 2 2
Figure 1-2 Various engine crevices present in a modern spark ignition engine...23
Figure 1-3 Crevice outflow geometry in the reference frame of piston. The outflow is stretched into a thin layer in a laminar fashion by the upward moving liner in the expansion stroke [28]... 27
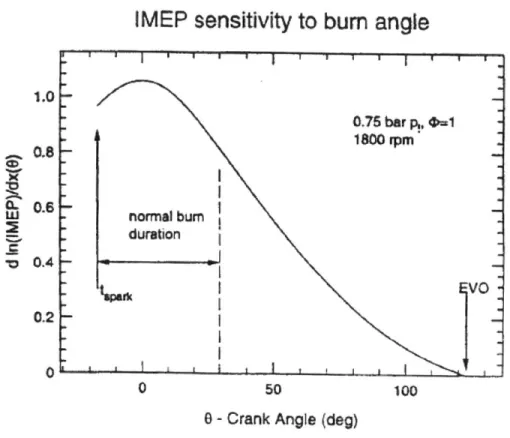
Figure 1-4 Indicated mean effective pressure sensitivity to burn angle. dln(imep)/dx(e) denotes the percentage change in imep due to a 1 percent additional mass burned at crank angle
e. During the
normal burn duration it has a value of about 1.0 [32]. ... 29Figure 1-5 Fuel-air cycle results for indicated fuel conversion efficiency as a function of compression ratio and equivalence ratio. Fuel: octane; p1 = 1 atm, T1 = 388 K, xr = 0. 05 [23]...31
Figure 1-6 Normalized change of net indicated efficiency with compression ratio; lambda=1.0 [36]. ... 32
Figure 2-1 Sensitivity of GIMEP to heat release schedule plotted alongside crevice outflow of reference engine (see Table 2-1) operating at part load (see Table 2-3). ... 40
Figure 2-2 Manifold absolute pressure at part load condition...41
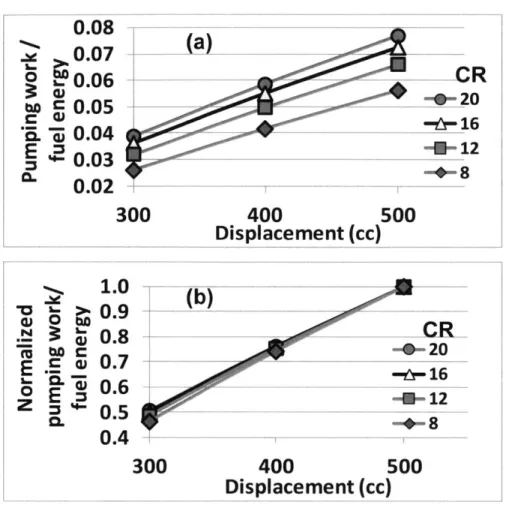
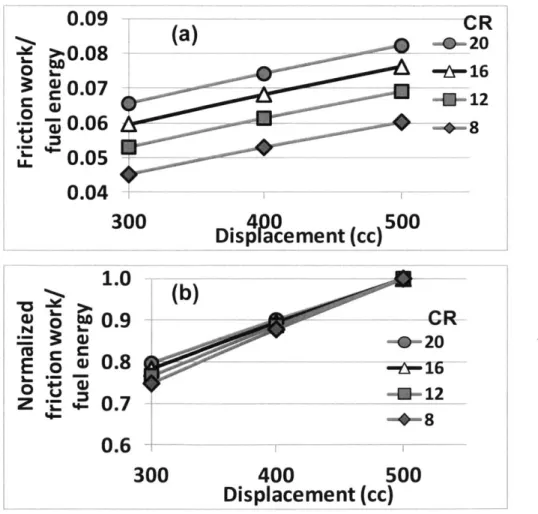
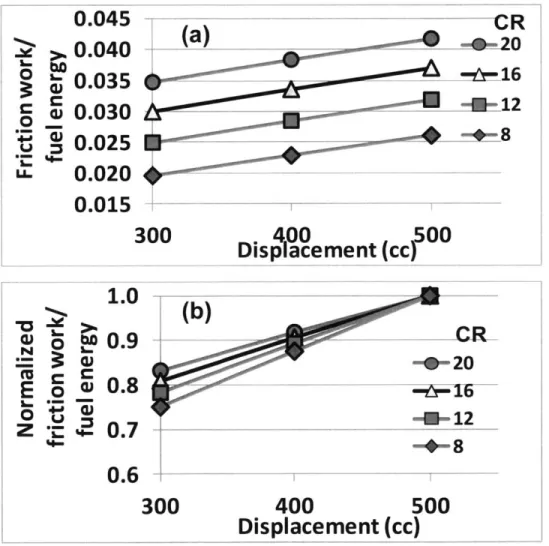
Figure 2-3 Pumping work at part load; (a) pumping work/fuel energy; (b) values of (a) normalized by those at 5 0 0 cc V d...4 2 Figure 2-4 Component friction work at part load; (a) friction work/fuel energy; (b) values of (a) normalized by tho se at 500 cc V d...4 3 Figure 2-5 H eat Loss per fuel energy at part load... 44
Figure 2-6 Charge behavior for CR=8 and 20 at part load...45
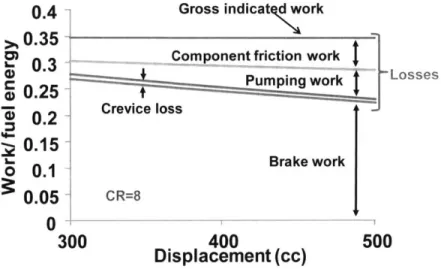
Figure 2-7 Crevice work at part load; (a) crevice work loss/fuel energy; (b) values of (a) normalized by those at 5 0 0 cc V d...4 6 Figure 2-8 Brake fuel conversion efficiency at part load; (a) pumping work/fuel energy; (b) values of (a) norm alized by those at 500 cc Vd... 47
Figure 2-9 Deconstruction of engine work output at part load; CR=8, 1600 rpm. ... 48
Figure 2-10 Deconstruction of engine work output at part load; CR=20, 1600 rpm. ... 48
Figure 2-11 M anifold absolute pressure at full load. ... 49
Figure 2-12 Pumping work per fuel energy at full load...49
Figure 2-13 Friction work at full load; (a) friction work/fuel energy; (b) values of (a) normalized by those at 5 0 0 cc V d ... 5 0 Figure 2-14 H eat loss per fuel energy at full load... 51
Figure 2-15 Crevice work loss at full load; (a) crevice work loss/fuel energy; (b) values of (a) normalized by th o se at 5 0 0 cc V d...52
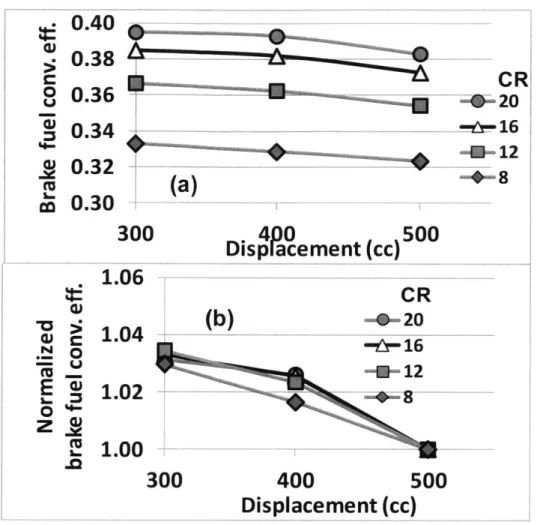
Figure 2-16 Brake fuel conversion efficiency at full load; (a) brake fuel conversion efficiency; (b) values of (a) norm alized by those at 500 cc V d. ... 53
Figure 2-17 Deconstruction of engine work output at full load; CR=8, 1600 rpm. ... 54
Figure 2-18 Deconstruction of engine work output at full load; CR=20, 1600 rpm. ... 54
Figure 3-1 Low, medium, and high compression ratio pistons, left to right. ... 58
Figure 3-2 Picture of pent-roof, central spark Volvo head and cross section of highest compression ratio piston in com bustion cham ber at TD C ... 58
Figure 3-3 Intake air system schem atic...59
Figure 3-4 Various charge motion plates used in previous experiments [41]...59
Figure 3-5 Fuel system schem atic...60
Figure 3-6 Results of encoder phasing experiments using AVL capacitive TDC sensor with correct offset ap p lied ... 6 2 Figure 3-7 Schematic of fast-response FID sampling head from Cambustion used in hydrocarbon emissions m easurem ent [43]...64
Figure 3-8 Drawings of (a) spark plug thread crevice, (b) head gasket crevice, (c) valve seat crevice, and (d) p isto n crev ice. ... 6 6 Figure 3-9 To-scale drawing of piston-ring pack crevices for low compression ratio piston showing locations of crevice volum es listed in Table 3-3. ... 67
Figure 3-10 Piston crevice modifications; (a) control piston, (b) increased crevice volume, (c) decreased crev ice volum e. ... 69
Figure 4-1 Schematic of thermodynamic system and sign convention [26]. ... 73
Figure 4-2 Complete flow chart for the gasoline fuel, which enters each cylinder, through both the normal combustion process (left side) and the unburned hydrocarbon mechanisms (right side). Numbers in parenthesis denote an HC emission index (% of gasoline entering the cylinder each cycle) for each step in the total process [32]. ... 79
Figure 5-1 Peak pressure versus MAP for the baseline case with control piston crevice modification...83
Figure 5-2 Crevice temperature versus NIMEP for the baseline case at various piston crevice modifications. ... 84
Figure 5-3 Crevice volume versus NIMEP for the baseline case at various piston crevice modifications... 85
Figure 5-4 Crevice mass versus NIMEP for the baseline case at various piston crevice modifications. ... 86
Figure 5-5 Crank angle locations of peak pressure and 90% mass burned versus NIMEP for the baseline case w ith control piston crevice m odification ... 88
Figure 5-6 Two-plate quench distances and piston crevice clearances versus NIMEP for the baseline case at various piston crevice m odifications ... 89
Figure 5-7 Indicated efficiency versus NIMEP for the baseline case at various piston crevice modifications...90
Figure 5-8 Indicated efficiency versus crevice volume for the baseline case at two part load NIMEP values...91
Figure 5-9 Relative indicated efficiency change versus relative crevice volume change for the baseline case at tw o part load N IM EP values...92
Figure 5-10 Mass fraction burn curve for the baseline case with control piston breaking down different com ponents of heat release. ... 95
Figure 5-11 Mass fraction burn curve for the baseline case with groove 1 piston modification breaking down different com ponents of heat release... 96 Figure 5-12 Mass fraction burn curve for the baseline case with groove 2 piston modification breaking down
different com ponents of heat release... 97 Figure 5-13 Mass fraction burn curve for the baseline case with new top land piston modification breaking
down different com ponents of heat release ... 98 Figure 5-14 Cumulative heat transfer at EVO per fuel energy versus NIMEP for the baseline case at various
piston crevice m odifications...100 Figure 5-15 Cumulative crevice enthalpy change at EVO per fuel energy versus NIMEP for the baseline case
at various piston crevice m odifications...102 Figure 5-16 10-90 burn durations versus NIMEP for the baseline case at various piston crevice modifications. ... 104 Figure 5-17 Hydrocarbon emission index versus NIMEP showing crevice models and FFID measurements for
compression ratio of 9.24, control, 2000 rpm, 80'C coolant...105 Figure 5-18 Hydrocarbon emission index (g HC/kg fuel) versus NIMEP for the baseline case at various piston
crevice m odifications. ... 106 Figure 5-19 Hydrocarbon emission index (g HC/kg fuel) versus crevice volume for the baseline case at two
part load N IM E P values...107 Figure 5-20 Relative hydrocarbon emission index change versus relative crevice volume change for the
baseline case at tw o part load N IM EP values. ... 108 Figure 5-21 Combustion inefficiency versus NIMEP for the baseline case at various piston crevice
m o d ification s...10 9 Figure 5-22 Indicated efficiency versus NIMEP for the control piston modification, speed of 2000 rpm, and
80'C coolant temperature at various compression ratios. ... 111 Figure 5-23 Relative indicated efficiency change versus compression ratio for the control piston modification,
speed of 2000 rpm, and 80'C coolant temperature at two part load NIMEP values; referenced to a com pression ratio of 10. ... 112 Figure 5-24 Indicated efficiency versus crevice volume for the baseline case at two part load NIMEP values;
corrected for compression ratio change resulting from crevice volume change. ... 113 Figure 5-25 Relative indicated efficiency change versus relative crevice volume change for the baseline case
at two part load NIMEP values; corrected for compression ratio change resulting from crevice v o lu m e ch an g e. ... 1 14 Figure 5-26 Indicated efficiency versus crevice volume for a speed of 2000 rpm, 80'C coolant temperature,
and an NIMEP value of 3.6 bar at various compression ratios. ... 115 Figure 5-27 Relative indicated efficiency change versus relative crevice volume change for a speed of 2000
rpm, 80'C coolant temperature, and an NIMEP value of 3.6 bar at various compression ratios. ... 116 Figure 5-28 Indicated efficiency versus crevice volume for a speed of 2000 rpm, 80'C coolant temperature,
and an NIM EP value of 5.6 bar at various compression ratios. ... 117 Figure 5-29 Relative indicated efficiency change versus relative crevice volume change for a speed of 2000
rpm, 80'C coolant temperature, and an NIMEP value of 5.6 bar at various compression ratios. ... 118 Figure 5-30 Indicated efficiency versus crevice volume for a compression ratio of 9.24, 80'C coolant
Figure 5-31 Relative indicated efficiency change versus relative crevice volume change for a compression ratio of 9.24, 80'C coolant temperature, and an NIMEP value of 3.6 bar at various speeds. ... 121 Figure 5-32 Indicated efficiency versus crevice volume for a compression ratio of 10.87, 80'C coolant
temperature, and an NIMEP value of 3.6 bar at various speeds...122 Figure 5-33 Relative indicated efficiency change versus relative crevice volume change for a compression
ratio of 10.87, 80'C coolant temperature, and an NIMEP value of 3.6 bar at various speeds. ... 123 Figure 5-34 Indicated efficiency versus crevice volume for a compression ratio of 12.57, 80'C coolant
temperature, and an NIMEP value of 3.6 bar at various speeds...124 Figure 5-35 Relative indicated efficiency change versus relative crevice volume change for a compression
ratio of 12.57, 80'C coolant temperature, and an NIMEP value of 3.6 bar at various speeds. ... 125 Figure 5-36 Indicated efficiency versus crevice volume for a compression ratio of 9.24, speed of 2000 rpm,
and an NIM EP value of 3.6 bar at two coolant temperatures...127 Figure 5-37 Relative indicated efficiency change versus relative crevice volume change for a compression
ratio of 9.24, speed of 2000 rpm, and an NIMEP value of 3.6 bar at two coolant temperatures...128 Figure 5-38 Indicated efficiency versus crevice volume for a compression ratio of 10.87, speed of 2000 rpm,
and an NIM EP value of 3.6 bar at two coolant temperatures...129 Figure 5-39 Relative indicated efficiency change versus relative crevice volume change for a compression
ratio of 10.87, speed of 2000 rpm, and an NIMEP value of 3.6 bar at two coolant temperatures...130 Figure 5-40 Indicated efficiency versus crevice volume for a compression ratio of 12.57, speed of 2000 rpm,
and an NIM EP value of 3.6 bar at two coolant temperatures...131 Figure 5-41 Relative indicated efficiency change versus relative crevice volume change for a compression
ratio of 12.57, speed of 2000 rpm, and an NIMEP value of 3.6 bar at two coolant temperatures...132 Figure A-I Burned gas ratio of specific heats versus fuel/air equivalence ratio for various temperatures
[2 2 ,2 3 ]...14 0 Figure C-I Indicated efficiency versus crevice volume for a compression ratio of 9.24, 80'C coolant
temperature, and an NIM EP value of 5.6 bar at various speeds...147 Figure C-2 Relative indicated efficiency change versus relative crevice volume change for a compression
ratio of 9.24, 80'C coolant temperature, and an NIMEP value of 5.6 bar at various speeds. ... 148 Figure C-3 Indicated efficiency versus crevice volume for a compression ratio of 10.87, 80'C coolant
temperature, and an NIM EP value of 5.6 bar at various speeds...149 Figure C-4 Relative indicated efficiency change versus relative crevice volume change for a compression
ratio of 10.87, 80'C coolant temperature, and an NIMEP value of 5.6 bar at various speeds. ... 150 Figure C-5 Indicated efficiency versus crevice volume for a compression ratio of 12.57, 80'C coolant
temperature, and an NIM EP value of 5.6 bar at various speeds...151 Figure C-6 Relative indicated efficiency change versus relative crevice volume change for a compression
ratio of 12.57, 80'C coolant temperature, and an NIMEP value of 5.6 bar at various speeds. ... 152 Figure D-I Indicated efficiency versus crevice volume for a compression ratio of 9.24, speed of 2000 rpm,
and an NIMEP value of 5.6 bar at two coolant temperatures...153 Figure D-2 Relative indicated efficiency change versus relative crevice volume change for a compression
Figure D-3 Indicated efficiency versus crevice volume for a compression ratio of 10.87, speed of 2000 rpm, and an NIM EP value of 5.6 bar at two coolant temperatures...155 Figure D-4 Relative indicated efficiency change versus relative crevice volume change for a compression
ratio of 10.87, speed of 2000 rpm, and an NIMEP value of 5.6 bar at two coolant temperatures...156 Figure D-5 Indicated efficiency versus crevice volume for a compression ratio of 12.57, speed of 2000 rpm,
and an NIM EP value of 5.6 bar at two coolant temperatures...157 Figure D-6 Relative indicated efficiency change versus relative crevice volume change for a compression
List of Tables
Table 2-1 Typical modern naturally aspirated engine geometry used as baseline engine in simulation study...35
Table 2-2 Various test parameters used in simulation study. ... 36
Table 2-3 Crevice Geom etry at part and full load points... 37
Table 2-4 Effect of downsizing on loss mechanism and brake work at part and full load points; 1600 rpm. ... 56
Table 3-1 Experim ental engine specifications... 57
Table 3-2 Total engine crevices for all three compression ratios tested, measured at room temperature...66
Table 3-3 Summary of piston-ring pack crevice volumes for all three compression ratio pistons tested; cold refers to room temperature measurements; hot refers to measurements under maximum load conditions expected for this set of experim ents. ... 68
Table 3-4 Piston crevice modification dimensions and percent change in total piston crevice volume for each com pression ratio piston. ... 69
Table 3-5 Test m atrix for efficiency experim ents. ... 71
Table 4-1 Experimental test points simulated using the dynamic piston-ring pack model...80
Table 5-1 Part load NIMEP values for naturally aspirated and turbo-downsized displacement volumes...81
Nomenclature
AcronymsABDC After Bottom Dead Center
ATDC After Top Dead Center
BBDC Before Bottom Dead Center
BDC Bottom Dead Center
BMEP Brake Mean Effective Pressure
BTDC Before Top Dead Center
CA90 Crank angle at 90% mass fraction burned
CAD Crank Angle Degree
CAFE Corporate Average Fuel Economy
COV Coefficient of Variation
CR Compression Ratio
DAQ Data Acquisition
ECU Engine Control Unit
El Emission Index
EVC Exhaust Valve Closing
EVO Exhaust Valve Opening
FFID Fast Flame Ionization Detector
GIMEP Gross indicated Mean Effective Pressure
IMEP Indicated Mean Effective Pressure
IVC Intake Valve Closing
IVO Intake Valve Opening
LA4 Urban Dynamometer Driving Schedule
MAP Manifold Air Pressure
MBT Maximum Brake Torque
MCU Main Control Unit
MFB Mass Fraction Burned
NEDC New European Driving Cycle
NIMEP Net Indicated Mean Effective Pressure
NVH Noise-Vibration-Harshness
PFI Port Fuel Injection
RPM Revolutions Per Minute
TDC Top Dead Center
he Ecrev Pe2
QLHV
Rswirl Rtumble SL Tcrev Uswiri Utumble Vcrev Vd Wf Wp cp dq,2 mcrev mfcrev mf mr Ppeak rc XrIvo Xr,back flow Xr r7f,ig 7 i,g p T A N R k m x a y 0 p (pSymbols
Mean piston speed
Convective heat transfer coefficient
Fuel energy of the trapped fuel in the crevice volume at peak pressure Peclet number
Lower heating value Swirl Ratio
Tumble ratio
Laminar flame speed Crevice gas temperature
Swirl velocity Tumble velocity Crevice volume Displacement volume Friction Work
Indicated gross work output Pumping Work
Specific heat at constant pressure Two-plate quench distance Mass trapped in the crevice Mass of fuel in the crevice Fuel mass
Residual mass Peak pressure Compression ratio
Residual mass fraction due to trapped mass at IVO Residual mass due to exhaust backflow
Residual mass fraction
Indicated gross fuel conversion efficiency
Gross indicated efficiency of burning crevice gas Pressure
Temperature Area
Engine speed in rev/s Gas constant
Thermal conductivity Total charge mass Mass fraction burned
Coefficient of thermal expansion Ratio of specific heats
Crank angle Density
1
Introduction
Since the introduction of the CAFE standards in 1975 the US has been moving toward a more fuel efficient passenger vehicle fleet. Recently, CO2 emissions have become a key issue in global energy use, with automotive applications as an important focus. In 2012 an aggressive new standard [1] was introduced requiring vast improvements in vehicle fuel economy extending to 2025. To satisfy these strict requirements more efficient engine technology is required. It has been shown that there are large gains to be had by improving current gasoline engine technology [2-4]. One very promising solution successfully being realized by automotive manufacturers is shifting towards turbocharged downsized engines [5-11].
1.1 Turbocharged Downsized Engines
Current production engines tend to be naturally aspirated engines matched to vehicles based on maximum expected loads. To improve fuel economy these naturally aspirated engines are being replaced by smaller turbocharged engines. Figure 1-1 shows a typical drive cycle across the performance map of a naturally aspirated engine. It can be seen that a significant portion of the drive cycle is spent at part load. Downsized engines have reduced displacement volumes, thus requiring the engine to work at a higher mean effective pressure under part load conditions to meet the same torque. This lowers pumping, friction, and heat transfer losses. The turbocharger then acts to match, and in many cases exceed, the maximum torque of the replaced naturally aspirated engine. Significant fuel consumption gains (upwards of 15% over the NEDC cycle) have been reported [8].
8
6
a. (U M0 CO 4 2 0 0 500 1000 1500 2000 2500 3000 3500 Speed (rpm)Figure 1-1 LA4 drive cycle results for a small passenger vehicle showing majority of city driving takes place at part load.
To decrease engine displacement there are two options: decrease the number of cylinders
and/or decrease individual cylinder size. Due to noise-vibration-harshness (NVH) concerns the number of cylinders is limited to at least 2. Therefore, at some point, individual cylinder size must be reduced. As cylinder size is reduced engine crevice volumes become a major source of inefficiency due to a number of factors, but mainly from disproportionate scaling of the gap between piston and cylinder. Therefore the crevice effect on engine efficiency has become an important loss mechanism to quantify as engine displacement continues to decrease.
1.2 Total Engine Crevices
Engine crevices consist of small spaces within the combustion chamber, filled with unburned mixture, whose characteristic dimension does not allow a flame to penetrate. The various crevices present in modern engines are displayed in Figure 1-2. The head gasket crevice is composed of the gaps between the head gasket and cylinder liner and the head gasket and head.
0---0
The spark plug crevice consists of the space between the spark plug threads and engine head ignoring the space between the spark plug central electrode and spark plug body that is large enough for a flame to enter. The valve seat crevice is the space between the valves and their seats in the engine head. The piston ring-pack crevice consists of the top land volume, the side and back top ring volume, and the volume between the first and second rings. Within the piston ring-pack crevice the top land volume and side and back top ring volumes will be collectively known as the piston crevice. This piston crevice is by far the largest crevice and has been shown to account for 80% of the crevice hydrocarbon emissions [12]. In addition, the remaining crevices (valve seat, spark plug thread, and cylinder-head gasket) all scale with engine size, so as engines downsize the piston crevice will only further dominate the total crevice volume. The piston crevice has thusly been chosen as the focus of this project.
q
Sp
ph
p
cre
ark
ug
vice
Head
gasket
crevice
Piston
ring-pack crevice
Valve seat
crevice
1.3 Crevice Mechanism
A crevice becomes a source of inefficiency and hydrocarbon emissions when the unburned
mixture trapped within escapes primary combustion. This occurs when the entrance to said crevice is geometrically such that a flame cannot enter. This phenomenon is known as flame quenching and occurs when a flame loses energy (through heat transfer to the walls, burned mixture, and unburned mixture) faster than it can be created from the chemical reaction within the flame. The balance between energy loss and generation is dictated by fuel properties, in-cylinder conditions (pressure, temperature, and composition), and crevice geometry. At the very narrow crevice entrances wall surface area becomes large compared to flame front area and quenching occurs.
1.3.1 Laminar Flame Quenching
Over the past half century laminar flame quenching has been a major topic in the combustion field, with many studies focusing on applications to internal combustion engines. Multiple approaches have been pursued using parallel plates, tubes, channels and other simple geometry to measure this quenching effect. Of particular relevance to engine crevice quenching are the parallel-plate quenching experiments, which find the minimum distance between two large parallel plates that a flame can propagate. Various studies have been completed, successfully relating two plate quench distances to quenching in engine [13-16]. In these studies crevice gaps were varied and tested in engines and compared to laminar flame quenching dimensions. Multiple analysis techniques were used to detect flame quenching using ionization probes [13,14], optical measurements [15], and hydrocarbon emissions data [16]. These studies show the applicability of using simple two plate quench distance calculations for crevice flame quenching in engines.
There are a number of correlations available for finding two plate quench distances given engine conditions [17-19]. Portions of the methods used by Lavoie and Williams are combined in this study to calculate quench distances. Lavoie suggests a correlation for Peclet numbers shown in Equation 1.1 based on experiments using propane:
9.5 (p).26-min (1,1/<p2)
Pe2 = * ( [1.1]
where Pe2 is the Peclet number, 'p is the fuel/air equivalence ratio, and p is the in-cylinder
pressure, in atmosphere. Then, similar to Williams' correlation but with Peclet numbers replacing the experimental constant, the quench distance is calculated based on heat conduction losses using Equation 1.2:
_Pe 2 kf
dq,2 - [ 1.2]
PUSL CPJf
where dq,2 is the two-plate quench distance, kf is the thermal conductivity at flame conditions, pu is the unburned gas density, SL is the laminar flame speed, and cpf is the specific heat at constant pressure at flame conditions. Laminar flame speeds are calculated using correlations found for gasoline [20,21]. Unburned and flame properties are calculated using results from NASA equilibrium programs [22] found in Professor Heywood's textbook [23]. Under normal operating conditions quench distances can range from 0.2 to 0.8 mm, and further details regarding quench distance calculations are available in Appendix A:.
Focusing on the piston crevice, the characteristic quench dimension is the radial clearance between the piston and cylinder. In a rather simplified view, if the radial clearance of the piston is smaller than the laminar flame quench distance upon flame arrival then the flame cannot penetrate into the crevice. Based on this view of flame quenching it is important to accurately measure room temperature piston-cylinder clearance and understand piston and cylinder temperatures so as to estimate thermal expansion.
1.3.2 Piston Thermal Expansion
Piston and cylinder thermal expansion dictate piston-cylinder clearance design in modern engines. The clearance must be large enough to handle thermal expansion at the highest expected component temperatures experienced at full load. These maximum temperatures are similar between engines of dissimilar size. A smaller piston will expand slightly less at a given
temperature, allowing for a slightly tighter clearance, but this benefit does not scale as quickly as clearance volume in engine downsizing. This leads to the piston crevice volume making up a larger percent of the clearance volume in downsized engines. Additionally, because the clearance is designed for maximum load it will be larger under the part load conditions of interest to this study.
Engine component temperatures have been studied while looking at heat transfer characteristics of engines [24-26]. From these component temperatures a simple application of unrestrained thermal expansion can be applied using Equation 1.3:
diameter = diameter * [1 + a * (Thot - Troom temp)] [1.3]
where a is the coefficient of thermal expansion and T is temperature. For the piston an unconstrained expansion approximation reflects the physics of the actual expansion and for the cylinder lower temperatures and a low coefficient of thermal expansion limit expansion, thus allowing the approximation to remain close.
1.4 Crevice Effect on Efficiency
Unburned fuel-air mixture is pushed into the piston crevice as the charge is pressurized by the piston compression stroke and the expansion of the burned gas. When quenching at the crevice entrance occurs, this unburned fuel-air mixture escapes oxidation in the main combustion process. After the main combustion process completes, the unburned crevice mixture discharges into the cylinder due to the lowering charge pressure and piston downward movement. As the crevice gas mixes with hot burned gases in the cylinder, it is oxidized in a secondary oxidation process, which contributes to engine work output at a discounted rate due to a less favorable heat release schedule.
1.4.1 Crevice Outflow
To fully grasp the crevice effect on efficiency it is vital to understand the outflow and secondary oxidation of trapped unburned crevice gas. In a Schlieren visualization study
conducted at the Sloan Automotive Laboratory Namazian [27] showed that during the expansion stroke the crevice gas slowly expands upward and is left in a thin layer above the crevice as the piston moves downward. Expanding on a crevice outflow model developed by Namazian, Min looked at crevice outflow velocities and characteristics [28,29]. Using normalized velocities it was shown that the escaping gas from the piston crevice flows upward with respect to the piston but downward with respect to the liner. This flow out of the piston crevice was found to be laminar with normalized velocity independent of speed and load. Combined these conclusions show that as the piston moves downward it lays down a thin layer of crevice gas along the cylinder wall in a laminar fashion, with a majority of the crevice mass deposited early in the expansion stroke. In Figure 1-3, a visualization taken from Min [28] shows the laydown process.
Liner
Piston
Figure 1-3 Crevice outflow geometry in the reference frame of piston. The outflow is stretched into a thin layer in a laminar fashion by the upward moving liner in the expansion stroke [28].
1.4.2 Crevice Oxidation
Once the crevice gas is deposited on the walls of the cylinder it then has the opportunity to undergo secondary oxidation. A useful approximation in this oxidation process is to treat the crevice gas as vertically stationary along the wall diffusing outward into the bulk burned gas. Min [29] and Wu [30] used this one dimensional approach to simulate crevice gas oxidation. Both of these studies showed that the dominant factor in this oxidation process is bulk gas
temperature and that most hydrocarbons trapped in the crevice are consumed before exiting the cylinder. Min gave a detailed view of crevice oxidation, looking at the time history of crevice gas particles laid along the cylinder. In this view it was shown that crevice gas leaving the piston crevice early in the exhaust stroke is almost fully oxidized. This, combined with the fact that most crevice gas exits early in the expansion stroke, showed that most hydrocarbons trapped in the piston crevice are oxidized before leaving the cylinder. Additionally this study showed an interesting look at heat release piggybacking that caused engine configurations with high crevice volumes to continue crevice gas oxidation further into the expansion stroke. Wu showed the cutoff temperature for nearly complete oxidation to be about 1400 K and found that between 50 and 90 percent of the trapped hydrocarbons are consumed in post flame oxidation. Another study using laser-induced fluorescence to look at both unburned mixture and oxidation reactions confirmed these simulations by showing that nearly all crevice gas exiting the piston crevice is oxidized until bulk gas temperature is dramatically cooled by exhaust valve opening [31].
Knowing that most of the trapped crevice mass, especially that released early, is oxidized in the expansion stroke, it becomes necessary to look at the effect of late oxidation on engine work output. To quantify this effect a curve showing the sensitivity of indicated mean effective pressure to the heat release schedule was computed, and is reproduced in Figure 4 below [32]. This curve has been obtained by perturbing the burn curve x(0) with a delta function of a small amount of extra mixture burned at a sequence of crank angles from spark to EVO. This curve shows how substantially little the crevice gas oxidation during the exhaust stroke contributes to engine work output. Thus, the unburned mixture trapped in the piston crevice escaping primary combustion causes a significant degradation of engine efficiency.
IMEP
sensitivity
to bum
angle
1
4 1 -1 1 1 1 1 1 1 1.0 0.75 bar p,, 6=1 1800 rpm 0.1 L 0 .6 -6normal bum duration v0.4 Cr~kEVO 0.2 -0 0 50 1000 - Crank Angle (deg)
Figure 1-4 Indicated mean effective pressure sensitivity to burn angle. dln(imep)/dx(6) denotes the percentage change in imep due to a 1 percent additional mass burned at crank angle 6. During the normal burn duration it has a value of about 1.0 [32].
1.5 Crevice Effect on Emissions
Nearly the entirety of previous research on engine crevices has been focused on unburned hydrocarbon emissions. Beginning in 1970 Daniel validated an analytical model with engine experiments to look at crevice quenching, post flame oxidation, exhaust of burned products, and oxidation in the exhaust system [17]. Wentworth then went on to show that the virtual elimination of piston crevices can result in a 47-74 percent reduction in hydrocarbon emissions
[33]. Adamczyk used combustion bombs and gas chromatography to quantify different crevice
contributions to emissions, showing the importance of the piston crevice [12]. Cheng then completed a broad and thorough study quantifying all of the different hydrocarbon emissions
mechanisms in an SI engine for warmed up and cold start conditions [32]. Min altered piston and head gasket crevices to study their sensitivities with regard to hydrocarbon emissions, showing that the piston crevice had a very small effect on hydrocarbon emissions [28]. Thompson similarly experimented with different piston and ring combinations, employing natural gas to isolate crevice mechanisms, to conclude that hydrocarbon emissions did not change significantly with different piston crevices [34]. Sterlepper used optical-fiber experiments to look at flame entrance into crevices and actually saw that a bigger piston-cylinder clearance resulted in less hydrocarbon emissions due to greater flame penetration [15]. Finally, Boam gave a useful overview of hydrocarbon emissions during the cold start period of engine operation [35].
1.6 Compression Ratio Effect on Efficiency
Increasing compression ratio is a well-known way to improve engine efficiency. These compression ratio increases are predominantly limited by knock concerns at maximum engine load, and this limit is especially noticeable in turbo-downsized engines, where production engine compression ratios lag behind similar naturally aspirated engines. Various fuel and engine control strategies can be employed to abate knock and realize efficiency gains from increasing compression ratio.
As a first look at the compression ratio effect on efficiency an ideal gas constant-volume cycle is investigated. The working fluid in this case has constant specific heat capacities. The cycle consists of an isentropic compression, constant volume heat addition, isentropic expansion, and constant volume heat rejection. The efficiency in this cycle is related to compression ratio in Equation 1.4:
1
1 7~i
=1-1 [1.4]
where r7fig is the indicated gross fuel conversion efficiency, rc is compression ratio, and y is the ratio of specific heats. This model gives a very simple relation between compression ratio and efficiency to show that efficiency increases with increased compression ratio. In this cycle many real-engine effects are neglected.
To give a more accurate estimate of the effect of compression ratio on engine efficiency a
fuel-air cycle analysis can be used. In this cycle fluid properties and combustion chemistry are taken into account. The working fluid no longer has constant specific heat capacities and its composition changes within the cycle. Results of the fuel-air cycle for various compression ratios and equivalence ratios are shown in Figure 1-5. These results show that indicated efficiencies
increase at an ever decreasing rate with increasing compression ratio.
Cf. ________ - I 0.601-0.55 0.5( y , 0.41 0.4( 0.35 0.3( n i ) 0.4 0.5 0.6 0-t
I
. 1.0 atm 388 K 0.05 , 1.2 1.4/
I
B ~ 1FI
0 5 10 15 Compresion ratio 20' r, 25 30Figure 1-5 Fuel-air cycle results for indicated fuel conversion efficiency as a function of compression ratio and equivalence ratio. Fuel: octane; pi = 1 atm, T, =
388 K, x, = 0. 05 [231.
. _ _ _ _
1 .
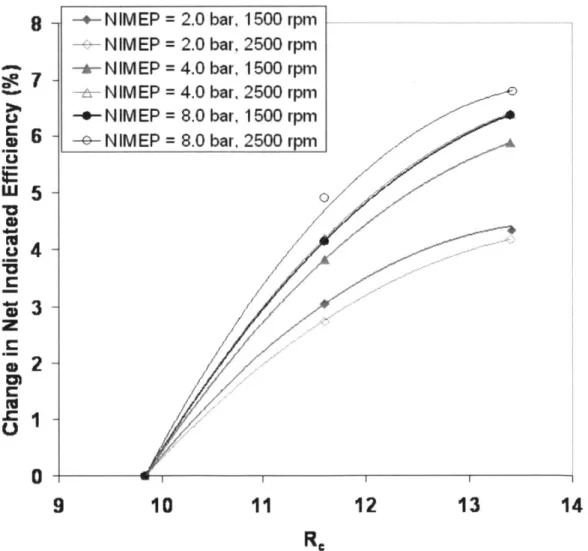
The fuel-air cycle still leaves out many important engine-related variables when calculating efficiency. Some of these include heat transfer, crevice effects, and burning characteristics. All of these factors lead to a lower increase in indicated efficiency with compression ratio increase than that predicted by the fuel-air cycle analysis. A more realistic and modern look at efficiency changes with compression ratio is given by experimental engine results shown in Figure 1-6. In this plot changes are normalized by those at the lowest compression ratio tested and are significantly lower than those predicted with the fuel-air cycle analysis.
8-
7-
6-5
4-
3-
21
-09
-+NIM - -N IM -*-N IM - NIM -- NIM -G NIM EP EP EP 2.0 2.0 4.0 bar, bar, bar, 1500 2500 1500 rpm rpm rpm EP = 4.0 bar, 2500 rpm EP = 8.0 bar, 1500 rpm EP = 8.0 bar, 2500 rpm 1011
12
13
14
Figure 1-6 Normalized change of net indicated efficiency with compression ratio; lambda=1.0 [361.
LU
a)
1.7 Research Objectives
The objectives of this study are as follows:
1. To understand the loss mechanisms on engine efficiency associated with engine downsizing, with a focus on crevice loss.
2. To experimentally quantify the piston crevice effect on indicated efficiency for a warmed up engine operating at various loads, speeds, and coolant temperatures.
3. To test and verify the effects of the piston crevice on engine out hydrocarbon
emissions.
4. To investigate compression ratio effects on indicated efficiency and crevice loss.
5. To recommend a viable course for future engine piston design with a focus on top land height.
2 Efficiency Simulation Study
2.1 Introduction
As mentioned previously, turbocharged downsized engines have been instituted as a means of increasing engine efficiency. To better understand the efficiency loss mechanisms and how they scale with different engine displacements a simulation study has been completed [37]. Of particular interest is the behavior of the crevice loss, which increases with downsizing because of disproportionate scaling of the crevice gap with engine displacement. This study quantifies the loss mechanisms on engine efficiency using a cycle simulation model containing a friction and crevice model.
2.2 Methodology
In this study engine downsizing is simulated by reducing individual cylinder size. Bore to stroke ratio is kept constant, while engine displacement is reduced from 500 cc/cylinder to 300 cc/cylinder. This constitutes a significant reduction in engine displacement from modem naturally aspirated engines. A standard setup for a modem naturally aspirated engine is used as a baseline in this study with details given in Table 1 below. Throughout this study bore/stroke ratio, con rod/stroke ratio, number of valves, and valve timing are set to baseline values.
Table 2-1 Typical modern naturally aspirated in simulation study.
engine geometry used as baseline engine
Displacement Volume/cylinder 500 cc
Compression Ratio 10:1
Bore (mm)/Stroke(mm) 86/86
Connecting Rod to Stroke ratio 1.58
Number of Valves 16
Intake Valve Open 0' BTDC-intake
Intake Valve Close 60' ABDC-intake
Exhaust Valve Open 450 BBDC -exhaust
In addition to downsizing crevice loss is expected to change with compression ratio, so this simulation study looks at compression ratio changes ranging from 8 to 20. Finally, two load cases are investigated keeping brake torque output per cylinder at 13.4 Nm for part load and 43.6 Nm for full load. For the reference engine, these torque values correspond to BMEP values of 3.4 and 11 bar, respectively. A summary of the parameters used in this study is presented in Table 2-2.
Table 2-2 Various test parameters used in simulation study.
Displacement Volume/cylinder 300, 400,500 cc
Compression Ratio 8, 12, 16,20
Speed 1600 rpm
Load (as measured by brake torque) Part (13.4 Nm/cyl); Full (43.6 Nm/cyl)
Spark timing MBT
Spark timing is fixed at MBT timing so that different cases have similar combustion phasing. In practice, especially at high loads and high compression ratios, spark timing must be retarded for knock. Relaxing this restraint provides a useful upper bound on performance assuming a knock resistant fuel, such as E85 or M85, or a knock abatement strategy [38] is implemented.
Combustion is modeled by using a Wiebie function for the cumulative mass fraction burn profile. Burn duration is 65 crank angle degrees for part load and 55 crank angle degrees for full load, which ensures the heat release schedule is the same across each load.
The exhaust pressure is kept at 1.05 bar for non-boosted operation. When the engine is boosted, the pumping loss depends on the characteristics of the compression system which determines the intake and exhaust pressure. For example, when the intake pressure is higher than the exhaust, the pumping work could be negative (work output in the gas exchange process). To decouple this issue from the discussion, the exhaust pressure is set to the same value as the intake pressure when the engine is boosted so that pumping work is only due to the
valve flow losses. The actual pumping work corresponding to the proper matching of the engine and compression system is to be addressed separately.
2.2.1 Friction Model
Engine friction is calculated using a model developed by Patton, Nitschke, and Heywood
[39], which has been updated by Sandoval and Heywood [40]. This model is based on an in-line
4-cylinder configuration with 4 valves per cylinder and double-overhead-cams. It estimates friction from components such as the crank shaft, piston rings and skirt, cam shafts, and valves. These components scale geometrically with bore size. Friction values are apportioned to each cylinder via the frictional mean effective pressure. Pumping and accessory losses are not included in the friction model. The former is already incorporated in the cycle simulation, and is accounted for in the net indicated output. The latter is very much technology dependent (e.g. fuel pumping power for PFI versus DI), and is best left for a separate assessment.
2.2.2 Crevice Model
The piston crevice is by far the most important crevice and so, to simplify the analysis, it is the only crevice modeled. For durability reasons the top land height is taken to be 6 mm. Radial clearance between the piston and liner is estimated based on thermal expansion considerations presented earlier in 1.3.2. The side and back top ring volumes are assumed to be a fixed fraction of the top land volume. The full crevice specifications are shown in Table 3.
Table 2-3 Crevice Geometry at part and full load points.
Part Load Full Load
Brake Torque (Nm/ cylinder) 13.37 43.63
Avg Piston Temperature (K) 430 490
Avg Liner Temperature (K) 360 390
Head Temperature (K) 380 415
Crevice Temperature (K) 425 480
Top land / liner clearance (mm) 0.300 0.270
Side and Back Top Ring 0.65 0.7
Volume/Top Land Volume
In analyzing the crevice effect on engine efficiency it is important to know how much unburned-mixture has escaped primary oxidation. This study assumes that flame arrival coincides with the peak pressure point, which results in a maximum for trapped crevice mass. Since the crevice volume is in pressure equilibrium with the combustion chamber this peak crevice mass can be found using Equation 2.1:
(Ppeak - MAP)Vcrev
mcrev = RT[2.1 ]
RuTcrev
where mcrev is the mass trapped in the crevice, Ppeak is peak pressure, MAP is manifold absolute pressure, Vcrev is crevice volume, Ru is the unburned gas constant, and Tcrev is crevice gas temperature. The fuel mass trapped in the crevice is then calculated from mc, based on the air-fuel ratio and residual gas fraction.
After primary oxidation has completed, in-cylinder pressure decreases and trapped crevice mixture is released into the combustion chamber. Based on crevice outflow and oxidation considerations explained in Chapter 1, full and instant oxidation is assumed as crevice mixture is released. This assumption is combined with the heat release schedule sensitivity curve from Figure 1-4 to find the efficiency of the secondary crevice oxidation.
The increase in GIMEP due to the in-cylinder secondary crevice oxidation is small compared to the overall GIMEP. Therefore, the change in GIMEP is approximated by Equation 2.2:
AGIMEP = GIMEP dln(GIMEP) dx dmf2]
J
dx dmf dooutflow
where GIMEP is the gross indicated mean effective pressure, x is mass fraction burned, mf is fuel mass, and 0 is crank angle. Since dx/dmf = l/mf, the gross indicated efficiency from the secondary oxidation is given by Equation 2.3:
AGIMEP * Vd
[
d In(GIMEP) dmfcrev d&, AIMP*a outf low dx d@ 0
7
ig = dmf,crev =lig ' dmf,crev d6 [2.3]
QLHv OUtf low dO outflow dO
where 77', is the gross indicated efficiency of burning crevice gas, Vd is displacement volume, QLHV is the lower heating value of the fuel, and mf,crev is the mass of fuel in the crevice. Figure 2-1 shows the heat release schedule sensitivity curve [32] alongside the crevice outflow [28,29] (positive for outflow; negative for inflow) for the reference engine at part load (see Table 2-3 for crevice condition). The value of the square bracket term in [2.3] is simply the integral of product of these two curves during the crevice outflow divided by the integral of the crevice outflow. The value of the square bracket comes out to 0.62, which is rounded off to a nominal value of 0.6. This nominal value of 17', is equal to 60% of the average overall fuel conversion efficiency, and this is emphasized in Equation 2.4. It is also insensitive to load, and is used for both the part load and full load calculation. It is important to remember that this value for 17' is an upper estimate since it was assumed that all crevice mixture is oxidized instantaneously upon crevice exit.
1.2 1 0.8 0.6. 0.4 0.2 0 -20 0 Crank 20 40 60 80 100 120 angle (0 atdc-compression)
Figure 2-1 Sensitivity of GIMEP to heat release schedule plotted alongside crevice outflow of reference engine (see Table 2-1) operating at part load (see Table 2-3).
2.2.3 Work Accounting
The brake work output comprises the gross work minus the losses and is displayed in Equation 2.5:
Wbrake - Wgs - Ecrev(7i,g - 77,g) - W, - Wf [2.5]
Here, Wgs is the indicated gross work output of the engine obtained from the cycle simulation without the crevice loss. The second term on the right hand side represents the work loss due to the crevice presence: Ecrev is the fuel energy of the trapped fuel in the crevice volume at peak pressure, calculated from Equation 2.1 by accounting for A/F and residual fraction; rli,g
-I. 0U w
d
In(GIMEP)
Sparkdx
EVO Crevice flow I 0.6 0.5 0.4 0.3 0.2 0.13 0 -0.1 -0.2 -0.3 -, I . , I I Iis the gross indicated fuel conversion efficiency of the charge; r7" is the gross indicated fuel conversion efficiency of the crevice mass from secondary oxidation. The pumping and friction work losses are W, and Wf. In the following results, the work loss terms are normalized by the fuel energy.
2.3 Part Load Results
2.3.1 Pumping Loss
The manifold absolute pressure (MAP) is varied to match indicated torque per cylinder, and is presented in Figure 2-2 for the part load case. As the engine is downsized, MAP must increase to allow a similar mass of air at the smaller displacement volume. As compression ratio is increased the engine becomes more efficient and so MAP decreases slightly to match the load. Even at the lowest compression ratio and displacement volume the engine is still throttled.
0.6
CR
.0.6 -- - - - -- - -- _.0O.5_
-+-8 -5-12 50.4--1 -- 16-0-20
0.3300
400
500
Displacement (cc)
Figure 2-2 Manifold absolute pressure at part load condition.Pumping work per unit fuel energy follows MAP trends very closely and is displayed in absolute terms for the part load case in Figure 2-3 (a). These values are normalized by those at
Vd = 500 cc per cylinder and are shown in Figure 2-3 (b).
With downsizing the reduction in pumping work per fuel energy is significant and amounts to 1.5-2 %-points per 100 cc decrease in per cylinder Vd. The normalized values are insensitive