Construction of a Classification Hierarchy for Process Underspecification to Streamline Life-Cycle Assessment
by
Victor E. Cary
SUBMITTED TO THE DEPARTMENT OF MATERIALS SCIENCE AND ENGINEERING IN PARTIAL FULFILLMENT OF THE REQUIREMENTS FOR THE DEGREE OF
BACHELOR OF SCIENCE IN MATERIALS SCIENCE AND ENGINEERING
AT THE ACE S
MASSACHUSETTS INSTITUTE OF TECHNOLOGY
MAY 2014
OF TECHNOLOGY
IBRARIES
02014 Victor E. Cary. All rights reserved.
The author hereby grants to MIT permission to reproduce and to distribute publicly paper and electronic copies of this thesis document in whole or in part in any medium now known or
hereafter created.
Signature of Author:
,Signature
redacted
41% -inent of Materials Science and Engineering
Certified by:
Accepted by:
Signature redacted
May 2, 2014Elsa Olivetti Thomas Lord Assistant Professor of Materials Science and Engineering
Signature redacted
Thesis SupervisorV
/F/
Jeffrey C. Grossman Undergraduate Committee Chairman Department of Materials Science and Engineering
Construction of a Classification Hierarchy for Process Underspecification to Streamline Life-Cycle Assessment
by
Victor E. Cary
Submitted to the Department of Materials Science and Engineering on May 2, 2014 in Partial Fulfillment of the Requirements for the Degree of Bachelor of Science in Materials Science and
Engineering
ABSTRACT
Concerns over global warming potential and environmental degradation have created a demand for accurate assessment of the impact of various products and processes. Life cycle assessment (LCA), a quantitative assessment method, has been employed primarily to products, analyzing the energy inputs and environmental consequences for the manufacture and use of
specific goods. While it has not seen widespread use in assessment of industrial processes, its methodology can be adapted for such purposes; indeed, LCA may be a powerful tool for analyzing processes. This thesis aims to explore the viability of LCA as applied to the process industry. Building on previous research designed to provide high-quality assessment despite varying levels of uncertainty associated with material inputs, this research constructs a system which classifies processes into a hierarchy based on their degree of underspecification.
Simulations are performed using Oracle's Crystal Ball software to assess the usefulness and accuracy of the classification system. The system and its components are modified and tested again to achieve better results. Owing to time constraints and fundamental differences between energy inputs for processing different types of materials, the classification system presented herein concerns itself only with metals. Nonetheless, this system seeks to provide a logical approach to process underspecification, and lays the foundation for similar systems for other processes and other types of materials.
Thesis Supervisor: Elsa Olivetti
Acknowledgments
I am quite grateful for the opportunity to get involved in this work. I would like to extend
my sincere gratitude to my thesis advisor Elsa Olivetti, without whom none of this work would have been possible. She has been an excellent mentor, and was very helpful in guiding me through research, testing, writing, and editing. I would also like to thank Jocelyn and Stian for
suggesting literature and helping me with hierarchy construction.
Huge thanks are due to my good friend Matthew Brenner, who hosted me at his place in Philadelphia over Patriot's Day weekend, when I wrote a significant chunk of this document.
Great documents get written in Philadelphia, after all.
Finally, I would like to thank my parents for all their support and encouragement that brought me to this point. You are great.
Table of Contents
Abstract -2 Acknowledgments - 3 List of Tables -5 List of Figures - 5 1. Introduction -61.1 Uncertainty and Probabilistic Underspecification -7
1.2 Application of Life Cycle Assessment to Processes - 11 1.3 Goals of This Research - 13
2. Methodology - 14
2.1 Data Collection - 14
2.2 Simulations to Test Classification Hierarchies - 16
3. Results and Analysis - 18
3.1 Inspiration for Hierarchy System, and Its Limitations - 19 3.2 Developing the Deformation Branch - 21
3.3 Developing the Consolidation Branch -24
3.4 Developing the Mechanical Reducing Branch - 27
3.5 Assembling Smaller Branches Into a Larger Hierarchy -29
3.6 Modifying the Hierarchy to Differentiate by Metal Type at Li and L2 -30
4. Conclusions and Future Work - 33 5. References - 34
6. Appendix - 35
A. 1 Complete Hierarchy of Levels and Processes - Initial Test - 35
A.2 Classification Hierarchy for Deformation L3 and Metal Type L4 - 40 A.3 Initial Classification Hierarchy for Mechanical Reducing L3 - 40
A.4 Complete Hierarchy of Levels and Processes - Metal Type at Li - 41
List of Tables
Table 1 Conversion factors from fuel inputs to the energy they provide. Data from MIT Energy
Club Units & Conversions Fact Sheet (Supple, 2007). ... 15
Table 2 The six scoring factors and criteria used to determine standard deviations (Frischknecht, 2 007)... 15
Table 3 Number of categories for the branches underneath L3 category "deformation."... 21
Table 4 Number of categories for the branches underneath L3 category "consolidation."... 24
Table 5 Number of L5 entries per L4 category... 26
Table 6 Number of categories for the branches underneath L3 category "mechanical reducing." ... 2 8 Table 7 MAD-COV values for classification hierarchy with metal type defined at LI, showing split between mass-conserving and mass-reducing at L2... 32
List of Figures Figure 1 (a). Energy breakdown for a 1988 Cincinnati Milacron milling machine. (b). Energy breakdown for a 1985 Bridgeport milling machine. Adapted from Dahmus & Gutowski, 2004... 8
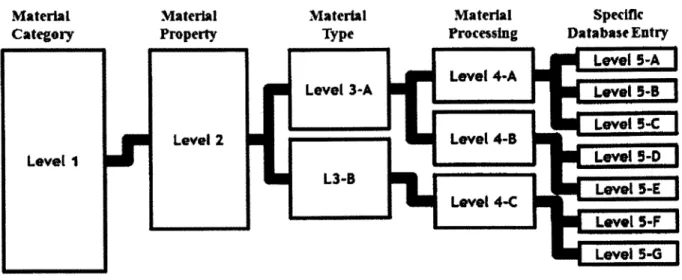
Figure 2 Hierarchical classification of structured underspecification system. Each level has a higher level of specificity than the one to its left. Adapted from Patanavanich, 2011... 10
Figure 3 The manufacture of an incinerator is broken down into its component processes, each of which has its own input and emission data. Adapted from da Silva & Amaral, 2009... 12
Figure 4 The Microsoft Excel interface used to generate values to input for simulations. ... 17
Figure 5 The basis for hierarchies used in this research... 19
Figure 6 MAD-COV averages for deformation L3. ... 22
Figure 7 MAD-COV averages for deformation L3 with metal type L4... 23
Figure 8 MAD-COV averages for consolidation L3. ... 25
Figure 9 MAD-COV averages for mechanical reducing L3 with cutting distinction L4... 27
Figure 10 MAD-COV averages for mechanical reducing L3 with metal type L4. ... 29
Figure 11 MAD-COV averages for entire initial classification hierarchy... 30
Figure 12 Left: MAD-COV averages for classification hierarchy with LI metal type. Right: MAD-COV averages for classification hierarchy with L2 metal type. ... 32
1. Introduction
The purpose of life cycle assessment (LCA) is to quantify the environmental impact of a product or process over its life cycle (Jacquemin, Pontalier, & Sablyarolles, 2012). It is no
surprise, then, that LCA has become increasingly relevant in the modem world. Fluctuations in energy prices makes it desirable to investigate how to reduce energy inputs; the recent trend of 'going green' to reduce environmental degradation requires accurate assessments of industrial emissions. Thus, methodologies which can reasonably generate this information, such as LCA, are in demand. Indeed, the popularity of LCA has grown enormously since its founding, going from about a dozen studies in the early 1970s to being the subject of an international initiative by the United Nations Environment Programme in the 2000s (Curran, 2006).
Of course, any such assessment must address the question of what the life cycle of a
process or product is; this depends on the nature of the assessment. Fundamentally, a
manufacturing process can be described in terms of thermodynamic parameters, accounting for mass, heat, and work flows within and across specific boundaries (Gutowski, Branham, et al.
2009). An important component of analysis, therefore, is choosing boundaries relevant to the
problem at hand - whether it's the operation of a single piece of equipment in a factory, or a complex series of operations. Boundaries may be 'cradle to gate,' in which the analysis concerns itself with impacts arising from extraction of raw materials until the end of processing, 'gate to gate,' in which case the boundaries encompass only certain industrial operations, or 'cradle to grave,' which is like cradle to gate but also extends to the impacts from a product's use and end of life. In the case of products and services where energy is not consumed in the use phase, the distinction makes little difference, as the most energy and emissions intensive processes take place before reaching the consumer; cradle to grave analysis is more significant for electric and
electronic products, and also if recycling is to be considered or disposal of hazardous waste is required. Methodology may have to be tweaked to account for byproducts which occur for or last for hundreds of years, such as radioactive waste (Frischknecht, 2007). For purposes of this paper, analysis will be gate to gate, with the boundary defined as the machinery used to perform the processes analyzed.
Once the boundaries for the LCA analysis have been established, one must prepare an inventory assessment, and acquire data to do the impact assessment for the inventory. While there are numerous databases cataloguing hundreds of thousands of inputs and emissions for
various processes and products, special care must be taken to ensure that the data obtained are used appropriately. This will be discussed in further detail in the methodology section. It is also important to note that fully accurate life cycle assessment is not practical, owing to the
tremendous amount of detail that would be necessary in gathering all data. Even if such accurate data were collected, it would not be perfectly applicable to operations under different conditions. Thus, it becomes necessary and practical to use data in a more general way. This work focuses on probabilistic underspecification, a method to streamline life cycle assessment by accounting for uncertainty in data.
1.1 Uncertainty and Probabilistic Underspecification
In order to be useful, life cycle assessment must strike a balance between accuracy and convenience: on one hand, an assessment must convey accurate information about what it purports to assess, and be relatable to similar situations. The assessment must also be done in a relatively transparent manner, ensuring that it can be repeated and verified. On the other hand, it must also be done in a convenient and efficient way: as mentioned previously, meticulously
cataloguing all inputs and emissions at every stage of life for a product might be accurate and repeatable for that very specific case, but it would also be prohibitively costly if used generally.
Such precise information might not even be possible to obtain - owing to the globalized
economy of the modem era, inputs may come from all around the world, often from third parties which might not be willing to disclose necessary details. Considering that some products and processes involve hundreds or even thousands of inputs, it becomes nearly impossible to obtain
highly accurate data. Some degree of uncertainty in LCA data must not only be tolerated, but
may be necessary.
(a) One way of dealing with lack of data is to employ a
first principles approach, estimating the energy of a process
TWa (1e%) whoz) from the actual physical energy change - for example, using
Coolmi
(12%(9%)Cosn
the specific cutting energies of aluminum alloys to estimate
Coewwd o Fa (13,5%)
the energy in an aluminum alloy cutting operation (Dahmus
& Gutowski, 2004). This type of estimate may be useful, but (b) does not hold up in cases where the energy of the machines
used in the operation is significantly greater than simply the
Mactwwi (694%)
physical energy of the process. As Figure 1 demonstrates,
depending on the machine used, the actual energy of the L"'"" *
process may or may not constitute the majority of the energy LAW
of the operation being examined. Consequently, using first Figure 1 (a). Energy breakdown for a 1988 Cincinnati Milacron milling machine. (b). Energy breakdown for a 1985 Bridgeport milling machine.
principles estimates in the face of uncertainty about the Adaptedfrom Dahmus & Gutowski, 2004. actual operation is not likely to yield particularly useful or meaningful results.
Another method for dealing with a lack of primary data in LCA is modifying scope - for a certain assessment, one can identify a "set of interest," or SOI (Patanavanich, 2011). Even if an exact contribution towards the product or process as a whole is not known, if one knows that this particular contribution is small compared to other major contributions, then it might be
appropriate to approximate it using generalized information. Other modifications to scope may improve life cycle assessment: while it may be ideal to have all the information for the inputs and emissions of products or processes, such an analysis may not be practical, and there may yet be utility in focusing on the contribution of a smaller subset. For instance, it may be desirable to have data throughout an entire industry to figure out what the industry as a whole could do to reduce greenhouse gas emissions; however, if industry-wide collaboration is not possible, individual firms within the industry might nonetheless find it useful to conduct their own,
smaller-scale assessments (Todd & Curran, 1999). If process inputs and emissions vary widely depending on whether operations are large or small scale, altering the scope may indeed improve
LCA results.
Ultimately, life cycle assessment is a quantitative technique, and it would be helpful to establish definite bounds for the uncertainties resulting therefrom, rather than simply using good judgment in selecting which parameters to use or approximate. It was from this need that the
concept of structured underspecification emerged. Patanavanich and collaborators designed this method, developing a hierarchical classification system that classifies materials into discrete
hierarchies depending on the level of specificity (Figure 2)
Material Material Material Material
Category Property Type Processing
Level 4-A Level 3-A Level 2 Level 4-8 Level 1I 1.3-8 Level 4-C Specific DatabaseEntry Level $-A Level 5-8 Level 5-C Level 5-E L"e 5-E0 Level 5-F:] Level 5-G J
Figure 2 Hierarchical classification of structured underspecification system. Each level has a higher level of specificity than the
one to its left. Adaptedfrom Patanavanich, 2011.
It was found that a well-constructed hierarchy system showed lower values of the
Median Absolute Deviation Coefficient of Variation (MAD-COV) for emissions estimates as the level of specificity increased (Patanavanich, 2011). Moreover, it has been demonstrated that lower-fidelity data points can supplement higher-fidelity data points in a so-called 'probabilistic triage' to improve life cycle assessment. As Olivetti reports, by using a combination of high-fidelity and low-high-fidelity data for the given SOI, the MAD-COV for the final product is
comparable to the MAD-COV achieved through only high-fidelity data, and much less than the
MAD-COV obtained through only low-fidelity data (Olivetti, Patanavanich, & Kirchain, 2014).
Thus, the probabilistic triage succeeds in quantifying useful information for life cycle assessment at reduced cost. This way of streamlining life cycle assessment enables a practitioner to obtain less specific information about the type of activities associated with the object of the study, yet still obtain an effective assessment.
1.2 Application of Life Cycle Assessment to Processes
So far, life cycle assessment research has largely focused on inputs and emissions for specific materials and products. This is not particularly surprising given the interests of many firms conducting life cycle assessment: if a company conducts LCA with the aim of making their products more 'eco-friendly', the focus would naturally be on the material inputs and emissions for the product; collecting data to generalize the impact of the processes involved in the
product's manufacture may be deemed less important, especially if the processes are upstream and beyond the scope of the assessment. However, gathering data from a product-oriented perspective has its limitations, especially in industries where manufacturing techniques are
frequently updated. One such example is the semiconductor industry, which evolves so rapidly that by the time a thorough life cycle assessment can be completed, manufacturing has likely
already started on a newer model (Murphy, Kenig, et al. 2003). In that instance, generalized data for the process of wafer fabrication may be more useful.
By employing data gathered for individual processes, products can be assessed from a
bottom-up perspective. Such a method has already been developed to improve life cycle
assessment for semiconductor manufacturing: Murphy et al. model manufacturing as a series of parametric modules, analyzing wafer production by its constituent processes, such that they can generally make accurate estimates of the inputs and emissions for semiconductors (Murphy, Kenig, et al. 2003). However, the promise of this process-oriented view is not limited to just semiconductor manufacture and other rapidly-evolving industrial techniques. Indeed, it has the potential to impact all types of manufacturing. Ideally, if data on a sufficient number of
processes were collected, any product could be broken down into its constituent processes, and the inputs and emissions for the end product could be determined from the sum of inputs and
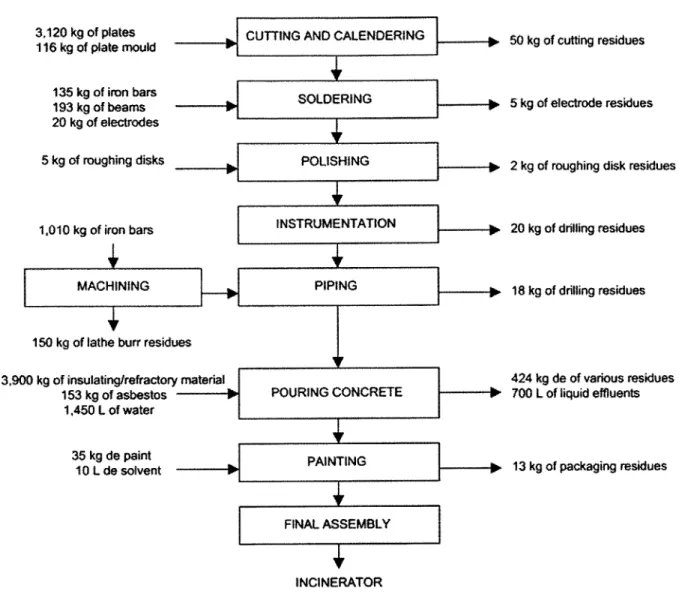
emissions for individual processes. This could apply to something as simple as the manufacture of a soda can, or something as complex as the manufacture of an incinerator (Figure 3).
3,120 kg of plates 116 kg of plate mould 135 kg of iron bars 193 kg of beams 20 kg of electrodes 5 kg of roughing disks 1,010 kg of iron bars MACHINING
150 kg of lathe burr residues 3,900 kg of insulating/refractory material
153 kg of asbestos
-1,450 L of water
35 kg de paint
10 Lde solvent -
p-CUTTING AND CALENDERING
SOLDERING POLISHING INSTRUMENTATION PIPING 1 POURING CONCRETE
I
PAINTING FINAL ASSEMBLY INCINERATOR.
I
...
Figure 3 The manufacture of an incinerator is broken down into its component processes, each ofwhich has its own input and emission data. Adaptedfrom da Silva & Amaral, 2009.
If this type of process-based life cycle assessment were adapted for more general use, its consequences could be profound. "Design for the environment," a paradigm by which producers would develop products and operations with environmental consequences in mind, could become
much more widespread (Jacquemin, Pontalier, & Sablyarolles, 2012). Depending on the accuracy of LCA simulations, one could even conduct LCA before establishing operations,
lip
50 kg of cutting residues
5 kg of electrode residues
2 kg of roughing disk residues
20 kg of drilling residues
18 kg of drilling residues
424 kg de of various residues
700 L of liquid effluents
enabling producers to evaluate environmental impact from the very beginning of the manufacturing process.
1.3 Goals of This Research
While a complete framework suitable for widespread industry use is as of yet
unrealizable, the components to begin construction of such a framework are there. This thesis aims to apply underspecification to manufacturing processes, which will enable low fidelity quantification of manufacturing processes where detailed information does not yet exist, thereby laying the groundwork for streamlining life cycle assessment. To determine what principles are important in the construction of a classification hierarchy system for manufacturing processes, various hypotheses will be put forth and tested. The test results will show the highlights and shortcomings of initial hypotheses, which may be modified or discarded in favor of new hypotheses. Many hypotheses involve specification of material type: as processes on the same type of metal might have similar energies, it is important to figure out at which level of the hierarchy it would be best to specify this. Finally, once smaller hypotheses for material
classification have been adequately tested and refined, this research will present an attempt at a broad, overarching classification system which could theoretically be expanded to account for all materials processes which can be described in units of energy per kilogram of material
processed. Regardless of how useful this particular hierarchy is for process-based life cycle assessment, it is one of the first attempts at such a comprehensive system, and as such provides much useful information for future research. Ultimately, this research aims to serve as a springboard for future process-based LCA research, which will hopefully become widespread and raise awareness of environmental issues associated with industrial processes.
2. Methodology
Employment of a structured underspecification system facilitates use of the probabilistic triage method, thereby streamlining life cycle assessment. This section describes the methods which went into developing a classification hierarchy for industrial operations on metals. The hierarchy consists of five levels, increasing in order of specificity from level Ll, the most
underspecified and least certain level to level L5, which consists of individual entries on specific industrial process energies.
2.1 Data Collection
Several data points were gathered for the construction of L5 points, drawing from sources such as the ecoinvent Life Cycle Inventory database (Frischknecht, 2007), the Department of Energy-Rutgers University Industrial Assessment Centers database (Industrial Assessment
Centers Database), the U.S. Life-Cycle Inventory Database (LCA Digital Commons), as well as various papers on specific processes (Steiner & Frischknecht, 2007) (Dahmus & Gutowski,
2004) (Eppich, 2004). Some of these sources listed energy inputs directly in terms of energy per unit mass of material processed; these data were used in simulations without any further
modification. Some sources did not give the value for energy per unit mass of material
processed, but nonetheless supplied data such that it could be calculated easily: the DOE-Rutgers database, for instance, gives data on the total amount of material processed by an operation over a certain period of time, as well as the total energy used in the operation over that time; dividing the latter by the former provides a good estimate of the desired value, often in good agreement with data on the same process from other sources. However, in some cases, data on energy inputs was given in terms of the amount of fuel used, e.g. cubic meters of natural gas or kilograms of
coal per unit mass of material processed. The conversion factors used to estimate energy from these sources are listed in Table 1 below.
Fuel Input Equivalent Energy
I Liter Gasoline 32.1 MJ
I Liter Diesel 35.8 MJ
I Kilogram Bituminous Coal 27 MJ
1 Cubic Meter Natural Gas at STP 38.2 MJ
Table 1 Conversion factors from fuel inputs to the energy they provide. Data from MIT Energy Club Units & Conversions Fact Sheet (Supple, 2007).
While the structured underspecification framework provides an organized way to estimate uncertainty at lower fidelity levels, uncertainty must also be accounted for at L5, the highest fidelity level. The standard deviations for the L5 data points were determined through a pedigree matrix which scores data based on certain criteria (Table 2).
Score 1 2 3 4 5
Ul -Reliability 1.00 - Verified data 1.05 - Verified data 1.10 - Non-verified 1.20 - Qualified 1.50 - Non-qualified
based on partly based on data partly based on estimate (e.g. by estimate
measurements assumptions or non- qualified estimates industry expert)
verified data based on derived from
measurements theoretical
information
U2 - 1.00 - Representative 1.02 - Representative 1.05 - Representative 1.10-
1.20-Completeness data from all sites data from >50% of the data from only some Representative Representativeness
relevant for the market sites relevant for the sites (<<50%) data from only one unknown or data
considered over an market considered relevant for the site relevant for the from a small number
adequate period to over an adequate market considered market considered of sites AND from
even out normal period to even ott OR >50% of sites but OR some sites but shorter periods
fluctuations normal fluctuations from shorter periods from shorter
periods
U3 - Temporal 1.00 - Less than 3 1.03 - Less than 6 1.10 -Less than 10 1.20 - Less than 1.50 - Age of date
correlation years of difference to years of difference to years of difference to 15 years of unknown, or more
current year current year current year difference to than 15 years of
current year difference to current
year
U4 - 1.00 - Data from area 1.01 -Average data 1.02 - Data from 1.10 - Data from
Geographical under study from larger area in smaller area than area unknown OR
correlation which the area under under study, or from distinctly different
study is included similar area area (ex. North
America instead of middle east)
US -Further 1.00 -Data from 1.20 -Data on related 1.50 - Data on 2.00 - Data on
Technological enterprises, processes, processes or materials related processes related processes or
correlation and materials under but same technology or materials but materials but on
study different laboratory scale of
technology different technology
U6 -Sample >100, continuous >20 >10, aggregated >=3 Unknown
Size measurement, balance figure in
of purchased products environmental report
All data entries were evaluated according to this pedigree matrix; as this scoring system
is quite commonplace in the field of life cycle assessment, some data entries came with scoring information. The remaining entries were scored according to the judgment of the author. Once quality numbers were assigned, standard deviations were calculated according to
SD = o.2 = expV(ln(U1))2+(In(U2))2
+(In(U3)) 2+(In(U4))2+(In(U5)) 2 +(In(U6))2 Equation 1
The original data entries were then multiplied by the standard deviation calculated through Equation 1. These deviations were added to the database with their respective data entries. Lognormal distributions were assumed for all L5 entries.
2.2 Simulations to Test Classification Hierarchies
The collected data entries put into a database at L5, and different possibilities for higher-order classification levels were assigned. Monte Carlo simulations were performed in Microsoft Excel using Oracle's Crystal Ball add-in to assess the merits of various classification hierarchies.
A Microsoft Excel spreadsheet was set up such that when the author input a specific L5
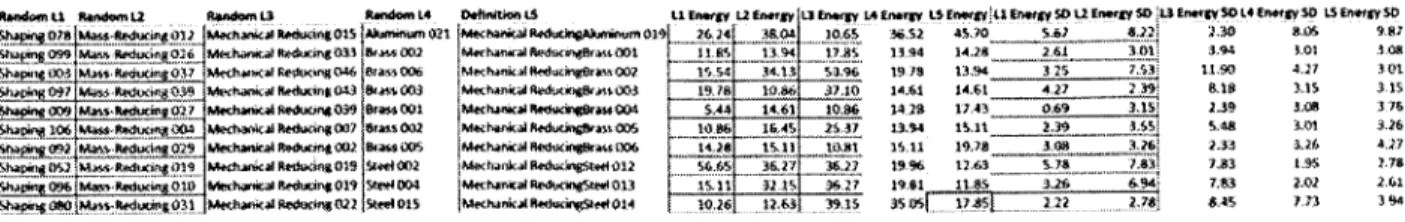
entry, the program would match it with the database entry, and recognize all levels of its classification scheme. Excel would fetch the energy and standard deviation for that specific entry, and then, using the RANDBETWEEN function, select random entries from that process's LI-L4 classifications, and then fetch the energies and standard deviations for those random entries. For instance, if the user input "steel forging" as an L5 entry, the program would not only retrieve its energy and standard deviation, but also recognize its L4 as "forging", then retrieve energy and standard deviation for a random process with L4 "forging," and so on for higher levels. Figure 4 shows the interface and its outputs.
Rmn.dom 1 .1ndmU 34sxlm .L3 Random V D40M8an 1. U EOWg L nOtMY E LU nr g 4 tnqV 1S Enefgl .EniWY $O U E1w8y 0 1.3 Lilt $O O L4 Enrgy SO LS Inwy SD
M. M102 s0 1 I A m391 264 38. 0.'o 8A6.2 4S.70 1.67 82': i30 8111 9W..
: 9 R 0.aM ftr dng 0 008X2 Methan1aid 001 11.6 _394 7. 1194 1428 2.61 01 194 1001
6Me
d64hi
ON i1.9 eWngOrK02 1s.s 4 34.10 1978 1394 32 7-s-- 11-90 47 101 ___________ m014 Me6j.A8 uoin '1 8s0034 Ma~6 88 19esn an au e~ se 1461 14 1 427 94 8.1 3.1 2.1
4 Mcsoft Exc.ed86flW039 nerase001 8~k4*r4M004 vmaleUsl 1.44 14.61 10.86 uat 1n2u 12.4 0.69 2.3n 3s1. 376 Mnatp cal tril, 007thes 002 ry salallftedwiNWAss - 1086 164, tak 237 .4 16.11 2. 3n t d26648 3.01 devip~4aion and utput% an energy value o06 14.2 16.1 11s11t1.11 1 .0 r6 we re.7 2
1648 ~ ~ ~ 16i614101941.0 24.,46d.~1 R*6 UM M 6., .1.1061 1.162 6.27 19.66 12.63 ... 178 784W 7813 1.96 77 664101. *34u 1All Mfh .4*6w3093*01 114.13. 1 .. 1 11 27 19.41 11.81 W.6 64 76.20 2.61
Figure 4 The Microsoft Excel interface used to generate values to input for simulations.
In a typical trial, the Crystal Ball add-in would take in each energy and standard deviation, and output an energy value from the lognormal distribution. 1000 trials were
performed for each L5 entry; it is pertinent to note that for each trial, the random selections for L1-L4 values corresponding to an L5 entry's hierarchy were reset and randomized again.
Two key metrics obtained from the simulation data are the Median Absolute Deviation (MAD) and the Median Absolute Deviation-Coefficient of Variation (MAD-COV). The MAD, represented by Equation 2,
MAD = mediani(|Xi - medianj(X)1) Equation 2
is obtained by first taking the median of all trial values, then taking the absolute value of the difference between that median and a trial value for all trial values. The median of the resulting set of values is the MAD, which gives information about the distribution of data in the set. Compared to the standard deviation, this value is less affected by outliers. The MAD-COV, represented by Equation 3,
MAD
MAD - COV = Equation 3
median1
(X
1
)
is obtained by dividing the MAD by the median of all trial values. Not only does this metric capture the information about distribution provided by the MAD, but it also presents it in terms of a percentage, which enables comparison across all process energies.
MAD-COV values were obtained from among all trials for each L5 entry and its
associated L1-L4 values. The values were averaged for each branch within a level of
classification: for instance, since there was only one branch for LI, there was only one average LI MAD-COV (though, given that 1000 trials were performed for each process, all Li values were close to this average); since there were two L2 values, there were two average L2
MAD-COV values, etc. Since each L5 entry is an individual datum, no averages were taken for L5; the MAD-COV values for individual L5 entries were used as-is.
Comparison of MAD-COV values across classification levels reveals critical information about the classification hierarchy. Ideally, the greater underspecification at higher-order levels should translate to higher MAD-COV values than those of more specified levels. If, for a certain classification hierarchy, the MAD-COV increases when moving from lower-fidelity to higher-fidelity levels, the hierarchy does not exhibit characteristics suitable for probabilistic life cycle assessment. New hypotheses must be formulated to improve the classification system. In some cases, the issue may be resolved by switching levels to specify certain characteristics before others. Other instances might require deeper analysis of the processes involved: perhaps there is something inherent in the nature of a certain group of processes that would make another type of classification more favorable.
3. Results and Analysis
A classification hierarchy system for manufacturing processes common to metals with
multiple levels of specification was developed. Drawing from a database of energy inputs for
113 different processes, the system was refined through multiple hypotheses and tests such that
more underspecified levels had higher MAD-COV values, while still maintaining an organized structure. The complete classification hierarchies for all tests are in the Appendix.
3.1 Inspiration for Hierarchy System, and Its Limitations
The hierarchy expounded in Manufacturing Process Reference Guide (Todd, Allen, & Alting, 1994), which logically branches out types of manufacturing processes into more specific ones, serves as the basis for the hierarchies tested in this research (Figure 5).
Mechanical Reducing Shaping Nonshaping Mass-Reducing Thermal Reducing iChemical Reducing Mass-Conserving Joining Consolidation Deformation Mechanical Joining Thermal Joining Chemical Joining Heat Annealing Treatment Hardening Other
Surface Surface Preparation
Finishing Surface Coating Surface
Modification
Figure 5 The basis for hierarchies used in this research. Shaping/nonshaping corresponds to level L1, while the branches beneath them correspond to L2,
and the branches below those correspond to L3. More specified levels not shown. Adapted from Todd, Allen, andAlting, 1994.
However, numerous changes were made to adapt this hierarchy to the purposes and limitations of this work. Many branches of the hierarchy could not be satisfactorily completed
owing to a limited number of data points. Although several sources for process data were consulted, data simply weren't available for several processes, or were only available for such a small portion of a branch (one or two points) that including it in tests wouldn't provide
meaningful information about the usefulness of the classification.
Furthermore, even in some instances where data could be acquired, it turned out that the units were incompatible with the simulations: consider many chemical processes, which often involve the coating of metal surfaces. Naturally, data for these processes comes in units of energy per surface area, as opposed to energy per mass of metal processed. Theoretically, given the density of the metal and the processing rate, one could convert these data into units of energy per mass, but as the processing rate varies from operation to operation, and may indeed be dictated by additional factors (e.g. processing rates limited by material properties, or economic conditions driving the rate at which a factory conducts its operations), it would be cumbersome and of limited utility to try to include these data points in simulations. Ultimately, it may not make sense to deal with such processes in terms of energy per kilogram of material processed. Perhaps it would be useful to develop a separate classification hierarchy system for processes best represented in units of energy per unit area. Such a construction, however, is beyond the
scope of the current research.
As this research was significantly impacted by the availability of data, only a few
branches were thoroughly completed. For this reason, early experimental simulations focused on lower-order levels, neglecting LI and L2 in favor of refining the L3 categories of deformation, consolidation, mechanical reducing, and the branches underneath them. After these L3 categories were sufficiently refined, attempts were made to incorporate them in a broad, overarching
3.2 Developing the Deformation Branch
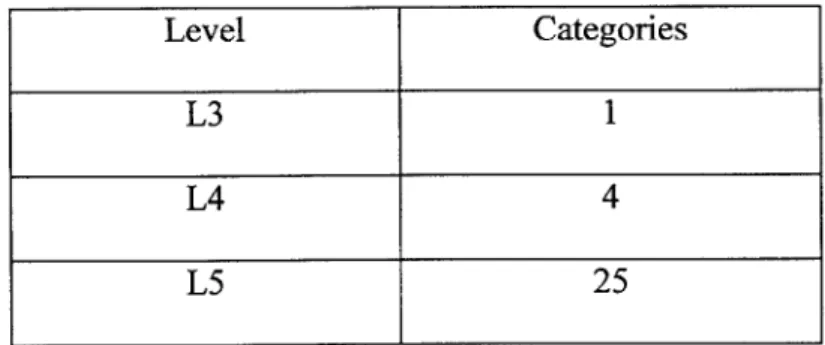
The branch of processes categorized as deformation was the first to be explored. Starting with deformation at L3, processes were differentiated into forging, extruding, wire drawing, and sheet rolling at L4. L5 consisted of the individual data points gathered for various processes (e.g. steel forging, aluminum forging, copper wire drawing, etc.). A numerical breakdown of the deformation categories is show in Table 3 below. The complete list of deformation categories and processes is in Appendix A. 1.
Level Categories
L3 1
L4 4
L5 25
Table 3 Number ofcategories for the branches underneath L3 category "deformation."
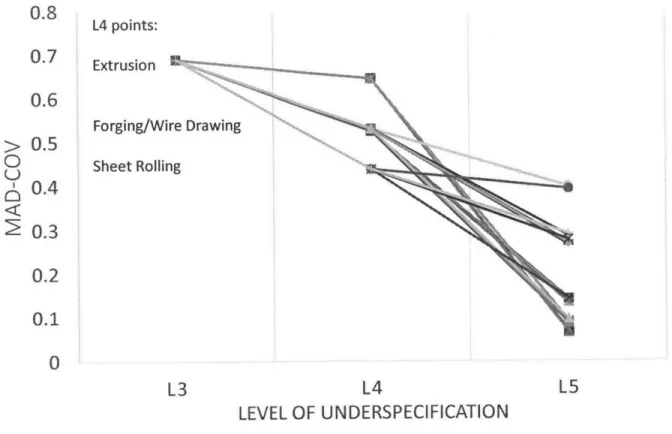
The MAD-COV averages were calculated for each classification in each level and plotted in Figure 6 below. As the figure shows, the MAD-COV starts out at around 69% for L3, then decreases for each successive level, varying from 43% to 66% for the four L4 categories, and varying from 6% to 42% across the 25 entries for L5. In all cases, the MAD-COV decreased as
specification of the process increased, demonstrating the viability of this classification scheme for life cycle assessment of these deformation processes.
0.8 L4 points: 0.7 Extrusion 0.6 Forging/Wire Drawing > 0.5 0 Sheet Rolling U S0.4 ~0.3 0.2 0.1 0 L3 L4 L5 LEVEL OF UNDERSPECIFICATION
Figure 6 MAD-COV averages for deformation L3.
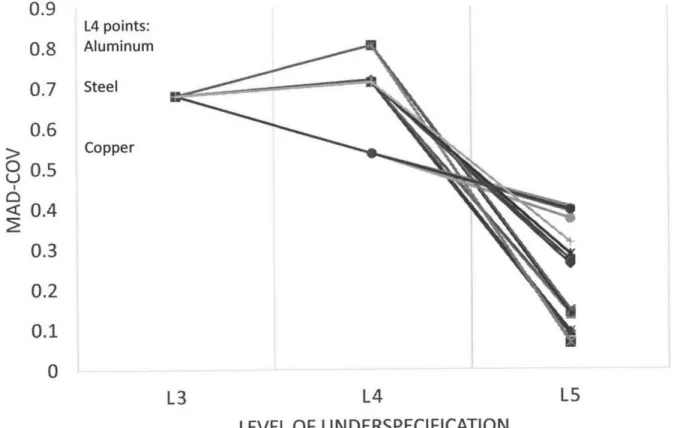
Another classification system was explored with deformation at L3, which can be found in Appendix A.2. To investigate at which point it becomes useful to define material type, L4 was changed to consist of aluminum, steel, and copper, while actual deformation processes were defined by individual entries at L5. MAD-COV values for simulations with this hierarchy are plotted in Figure 7.
This classification scheme was not as effective as the other one for L3 deformation. L4 MAD-COVs were higher than the L3 MAD-COV for steel and aluminum, demonstrating that this classification is not favorable for probabilistic LCA involving those materials. However, this was not the case for copper, which exhibited a lower MAD-COV at L4 than at L3. This could be due to a number of reasons, the most likely being the amount of data points and the processes covered. Entries with copper L4 only constituted five of the 25 data points in deformation L3,
with aluminum and steel covering the rest. Moreover, four of the five copper entries were for wire drawing; it is not surprising that there is less variation within this category as compared to steel and aluminum, which have multiple entries for a greater diversity of processes. The lower
MAD-COV for L4 copper might also be related to its material properties. Owing to the high
ductility of copper, it is possible that the energies to deform it are low in general, and therefore have a smaller distribution than processes on aluminum and steel, which may have a larger range of input energies depending on how they are deformed. The more likely explanation is that the variation is caused by fewer and less diverse entries for copper, but it might be pertinent to do further investigation on how materials properties could affect distribution.
0.9 L4 points: 0.8 Aluminum 0.7 Steel 0.6 Copper U
S
5
< 0.4 0.3 0.2 0.1 0 L3 L4 L5 LEVEL OF UNDERSPECIFICATION3.3 Developing the Consolidation Branch
Consolidation was the next branch to be developed. Originally, the goal was to break down the consolidation L3 into various types of casting (investment, sand, die, lost foam, etc.) at L4, with individual entries at L5. This could not be carried out due to limitations in data
availability; for instance, there was only one entry on lost foam casting, rendering such an L4 classification superfluous. In another case, the author was unsure whether 'high pressure die casting' would best be grouped with die casting or on its own; in the latter case, it would again incur the issue of an L4 classification functionally identical to an L5 entry. Of the processes with more than one data point, there tended to be an abundance for a certain metal type - the vast majority of points for die casting were aluminum die casting, which would skew a process-based classification at L4 towards aluminum values. Overall, this proposed classification proved inadequate before simulations were even performed.
Naturally, then, the alternative is to classify by metal type at L4. Consolidation was broken down into aluminum, gray and ductile iron, magnesium, steel, zinc, copper, iron, and titanium. Table 4 shows the category breakdown by level for a total of 42 L5 entries. The complete consolidation hierarchy is the consolidation branch in Appendix A. 1.
Level Categories
L3 I
L4 8
L5 42
Table 4 Number ofcategories for the branches underneath L3 category "consolidation."
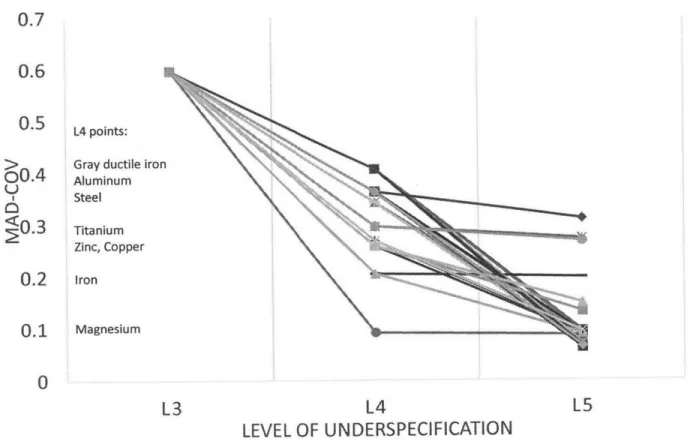
Results of trial simulations are plotted in Figure 8 below, with labels along the Y axis in descending order to indicate which points correspond to different L4 categories.
0.5 L4 points:
0.4 Gray ductile iro
iO.4 Aluminum Steel 0.3 Titanium Zinc, Copper 0.2 Iron 0.1 Magnesium 0 L3 L4 LEVEL OF UNDERSPECIFICATION
Figure 8 MAD-COV averages for consolidation L3.
As the plot shows, this classification scheme does a good job at representing
underspecification for consolidation processes. All points at L4 have a lower MAD-COV than
L3, and the points at L5 are either lower than or nearly equal to the points at L4. However, while
this hierarchy may very well be useful, it is pertinent to understand to what extent the number of data points may influence MAD-COV values. Table 5 lists the number of data points underneath each L4 classification. In the obvious cases of magnesium and titanium, it would be premature to conclude the effectiveness of this system due to the limited number of data points. It is also no surprise that aluminum and gray and ductile iron have higher MAD-COV values; there were several entries for these materials, retrieved from a diversity of operations, some of which were orders of magnitude different in their scale.
0.7 0.6 C C.-L5 n
L4 Category Number of Entries in L5 Magnesium 1 Titanium 2 Iron 2 Copper 3 Zinc 3 Steel 5
Gray and Ductile Iron 13
Aluminum 13
Table 5 Number of L5 entries per L4 category.
There are some more issues with the general validity of this classification system. Additional data on other types of casting could potentially raise MAD-COV values such that they are higher for L4 than for L3. For instance, the aluminum data are disproportionately for
aluminum die casting, the individual entries for which make up 8 of the 13 aluminum entries. If more data were acquired such that other types of aluminum casting were better represented,
depending on the energies of the added processes, the aluminum L4 MAD-COV could go from its already high value to a point which would render the classification invalid. For this reason, future research should focus on the acquisition of more data points, keeping open the possibility for alternative classifications (e.g. casting type at L4). Nonetheless, within the context of the current work, it appears that specifying metal type for casting operations will aid in probabilistic life cycle assessment.
3.4 Developing the Mechanical Reducing Branch
The third and final smaller branch completed was a set of processes grouped together as mechanical reducing at L3. The hierarchy in Manufacturing Process Reference Guide divides mechanical reducing into two parts used as L4 categories, single-point cutting and multi-point
cutting. Data were obtained for the energies of different types of milling and turning for various metals for a total of 46 L5 entries. MAD-COV values obtained from test simulations are plotted in Figure 9. The initial hierarchy is presented in full in Appendix A.3.
0.6 L4 points: 0.5 Single-point cutting 0.4 Multi-point cutting 0 0.2 0.1 0 L3 L4 L5 LEVEL OF UNDERSPECIFICATION
Figure 9 MAD-COV averages for mechanical reducing L3 with cutting distinction L4.
It is apparent that specifying single versus multi point cutting at L4 would not be very effective for probabilistic analysis, as multi-point cutting has greater variation than the
mechanical reducing L3. Alternative classifications were investigated for the L4. The obvious alternative for the available data points would be a distinction between turning and milling, but
as all turning entries were single-point cutting and all milling entries were multi-point cutting, this would have produced the exact same results. Instead, metal type was selected to specify L4, with milling and turning grouped together for each metal. Table 6 displays the number of categories for each level of underspecification. The hierarchy investigated is the Mechanical Reducing branch in Appendix A. 1.
Level Categories
L3 1
L4 5
L5 46
Table 6 Number of categories for the branches underneath L3 category "mechanical reducing."
Simulations were tested using the new L4 classifications, the results of which are displayed in Figure 10. This turns out to be a much better distinction than single versus multi point cutting.
MAD-COV
values decrease from around 43% at L3 to a range of 17% through23% at L4, and then decrease even further for individual L5 entries. Results are unlikely to be
significantly influenced by quantity or quality of entries; all metal types have 10 entries, with the exception of brass (which has 6), and all cover both turning and milling processes, except for brass (which only covers turning).
0 U)
b
0.5 0.45 0.4 0.35 0.3 0.25 0.2 0.15 0.1 0.05 L4 points: Steel Iron/Chromium Steel Aluminum/Brass 0 L3 L4 L5 LEVEL OF UNDERSPECIFICATIONFigure 10 MAD-CO V averages for mechanical reducing L3 with metal type L4.
It appears that specifying metal type for mechanical reducing processes could indeed reduce uncertainty for probabilistic LCA. This is fairly intuitive, as mechanical reduction of material mass will likely be dictated by various moduli unique to each material. However, as with the previously developed branches, more data points for additional processes would be
helpful in determining just how useful this classification is.
3.5 Assembling Smaller Branches Into a Larger Hierarchy
With three branches sufficiently completed at the L3, a first attempt was made at putting all data into a complete hierarchy of five levels. The hierarchy was structured as in Figure 5, putting consolidation and deformation under L2 category 'mass conserving,' while placing mechanical reducing under 'mass reducing.' No further modifications were made; Section Al
shows the five-level hierarchy in full. 1000 trials were conducted for each process entry to acquire MAD-COV values for all levels of underspecification. Results are plotted in Figure 11.
0.8 0.7 Mass conserving o 0.6Consoli a 0.6 0.5 Mechanical Reducin Mass reducing 0.4 0.3 0.2 0.1 0 L1 L2 L3 L4 L5 LEVEL OF UNDERSPECIFICATION
Figure 11 MAD-CO V averages for entire initial classification hierarchy.
As is plainly evident, simply grouping processes according to the textbook hierarchy does not reflect a decreasing uncertainty for each successive level: the all-encompassing 'shaping' LI category has a lower MAD-COV than two of the three L3 branches, while the grouping of consolidation and deformation under 'mass conserving' does not result in a classification with
general decreased uncertainty for increased specificity. Moreover, as the only branch of mass reducing is mechanical reducing, their L2 and L3 values are the same. It is clear that the system must be altered and refined for a five level classification to be useful.
3.6 Modifying the Hierarchy to Differentiate by Metal Type at Li and L2
Since defining metal type often improved results for lower branches, an important test for a five-level hierarchy is which level would be best to make this specification. As the initial LI and L2 classifications were not productive towards the end of this research, the hierarchy was modified to define metal type at those levels. This change enabled and required some
modifications to already existing branches: for instance, with the consolidation branch underneath metal type, all MAD-COV values for L4 category 'aluminum casting' would be equivalent to L3 category 'aluminum consolidation.' However, whereas previously, grouping by specific types of casting was avoided because it tended to skew results in favor of one metal, it was not an issue in this case because metal type had already been defined. Thus, where it could be done, casting type was defined at L4. In instances where there was only one entry for a
specific casting type, it was simply repeated for both L4 and L5. The complete modified
classification hierarchies introducing metal type at LI and L2 can be found in Appendix A.4 and
A.5.
Trials were conducted to test the effectiveness of the new hierarchies. MAD-COV values are displayed in Figure 12. Figure 12.a plots the results for defining metal type at Li. This classification actually proved worse than the initial one - LI MAD-COV values were lower than
L2 MAD-COVs for all categories, as well as some L3 values. As it may be difficult to determine individual categories from the chart, select LI and L2 MAD-COV values are displayed in Table 7. This category breakdown suffered from a similar problem as the initial hierarchy, namely, a split between relatively higher MAD-COV values for mass-conserving L2 categories and relatively lower COV values for mass-reducing L2 categories. In other cases,
0.9 0.9 0.8 0.8 0.7 0.7 >>0.6 0.6 0 0, U 0.5 u 0.5 0.4.4 0.3 0.3 0.2 0.2 0.1 0.1 A 0 0 L0 L2 L3 14 LI 1 L2 L3 L4 L5
LEVEL OF UNDERSPECIFICATION LEVEL OF UNDERSPECIFICATION
Figure 12 Left: MAD-COV averages for classification hierarchy with Ll metal type. Right: MAD-COV averages for
classification hierarchy with L2 metal type.
Li category Li MAD-COV average L2 category L2 MAD-COV average
Steel 0.47 Steel mass-conserving 0.64
Steel mass-reducing 0.38
Aluminum 0.40 Aluminum mass-conserving 0.55
Aluminum mass-reducing 0.17
Copper 0.36 Copper mass-conserving 0.71
Copper mass-reducing 0.16
Iron 0.30 Iron mass-conserving 0.37
Iron mass-reducing 0.2
Table 7 MAD-CO V values for classification hierarchy with metal type defined at L1, showing split between mass-conserving and
mass-reducing at L2.
It makes little sense to group mass-conserving and mass-reducing under the same higher-order category, at least with the data currently available. When refining the hierarchy to specify metal type at L2, therefore, the distinction between mass-conserving and mass-reducing was made at the LI. Figure 12.b plots the MAD-COV values by level for this second modified hierarchy. Compared to the previous two attempts, this classification scheme appears to be better
suited for probabilistic life cycle assessment, as a good amount of MAD-COV values at more specified levels are lower than those at less specified levels. However, for both hierarchies defining metal type at higher order classifications, certain drawbacks are apparent. The higher
Section 3.2, are better specified by process type than metal type. Indeed, these higher values can be attributed to the large number of entries for steel and aluminum deformation processes, which cover small to large operations and have a lot of variation. At this point, a large classification hierarchy does not yet appear to be viable for probabilistic life cycle assessment, at least for the branches of processes and data entries collected for this work.
4. Conclusions and Future Work
This thesis investigates the viability of adapting probabilistic underspecification methods for life cycle assessment to industrial processes on metals. Previously established methodologies for life cycle assessment of products are analyzed and modified towards this end. Data on the energy inputs for several industrial processes were used to construct classification hierarchies, which were then tested with Monte Carlo simulation to obtain MAD-COV values, which led to the formation of new classification hypotheses and further testing.
These results indicate that realization of a broad hierarchy for a wide variety of materials processes is not on the immediate horizon.
MAD-COV
values for all proposed hierarchies for the given data points were scattered, and often higher at more specified levels, rendering themunsuitable for probabilistic life cycle assessment. Nonetheless, it is remarkable that for smaller branches consisting of only three levels of underspecification, MAD-COV values decreased as
specification increased, suggesting that multiple smaller hierarchies may more effectively
address the issue of uncertainty with process-based LCA. Indeed, there is no inherent demand to branch all material processes under the same hierarchy.
Of course, these results apply mainly to the entries on process energy collected for this
work included data points on several processes, it only captures a fraction of the proposed general hierarchy, let alone the actual breadth of industrial process energies. This was noted in the analysis of all proposed hierarchies; additional hypotheses were suggested in case more database entries invalidated the current system. Future work should therefore focus on acquiring more data, expanding existing hierarchies, revisiting some discarded hierarchies, and even developing new ones.
Even though the results of this work may require modification to accommodate for additional data and processes, they represent an important foray into the field of process-based life cycle assessment. The methodology developed herein may be adapted to industrial processes for other materials, such as plastics and metals. Further research in this field has significant potential to change the operation of certain facilities, if not entire industries, and may eventually reduce the impact of industrial processing on the environment.
5. References
Curran, M.A. (2006). Life Cycle Assessment: Principles and Practice. Scientific Applications International Corporation, Reston, VA.
da Silva, P.R.S., & Amaral, F.G. (2009). An integrated methodology for environmental impacts and costs evaluation in industrial processes. Journal of Cleaner Production, 17,
1339-1350.
Dahmus, J.B., & Gutowski, T.G. (2004). An Environmental Analysis ofMachining. 2004 ASME International Mechanical Engineering Congress and RD&D Expo, Anaheim, California. Eppich, R.E. (2004). Energy Use in Selected Metalcasting Facilities. United States Department
of Energy Industrial Technologies Program.
Frischknecht, R (2007). The Ecoinvent Database System: Overview and Methodology. Swiss Centre for Life Cycle Inventories, Dubendorf, Switzerland.
Gutowski, T., Branham, M., & et al. (2009). Thermodynamic Analysis of Resources Used in Manufacturing Processes. Environmental Science and Technology, 43 (5), 1584-1590.
Industrial Assessment Centers Database. Rutgers University, New Brunswick, New Jersey.
Accessed March 2014. <http://iac.rutgers.edu/database/>.
Jacquemin, L., Pontalier, P., & Sablyarolles C. (2012). Life cycle assessment (LCA) applied to the process industry: a review. The International Journal ofLife Cycle Assessment, 17,
1028-1041.
LCA Digital Commons. United States Department of Agriculture National Agricultural Library.
Accessed March 2014. < https://www.lcacommons.gov/discovery/>.
Murphy, C., Kenig, G. & et al. (2003). Development of Parametric Material, Energy, and Emission Inventories for Wafer Fabrication in the Semiconductor Industry.
Environmental Science and Technology, 37, 5375-5382.
Olivetti, E., Patanavanich, S., & Kirchain, R. (2014). Exploring the viability of probabilistic under-specification to stramline life-cycle assessment. Environmental Science and
Technology, 47 (10), 5208-5216.
Pantanavanich, S. (2011). Exploring the Viability of Probabilistic Underspecification as a Viable
Streamlining Methodfor LCA. Massachusetts Institute of Technology, Department of
Materials Science and Engineering, Cambridge, Massachusetts.
Steiner, R., & Frischknecht, R. (2007). Metals Processing and Compressed Air Supply. Swiss Centre for Life Cycle Inventories, Dubendorf, Switzerland.
Supple, D. (2007). Units & Conversions Fact Sheet. MIT Energy Club, Cambridge, Massachusetts.
Todd, J.A., & Curran, M.A. (1999). Streamlined Life-Cycle Assessment: A Final Report
from
the SETA C North America Streamlined LCA Workgroup. Society of EnvironmentalToxicology and Chemistry (SETAC).
Todd, R.H., Allen, D.K., & Alting, L. (1994). Manufacturing Processes Reference Guide. New York, New York: Industrial Press Inc.
6. Appendix
A.1 Complete Hierarchy of Levels and Processes
-
Initial Test
Li L2 L3 L4 L5
Shaping Mass- Deformation Forging carbon and alloy steel forgings Conserving
Shaping Mass- Deformation Forging steel forgings Conserving
Shaping Mass- Deformation Forging steel forgings Conserving
Shaping Mass- Deformation Forging steel forgings Conserving
Shaping Mass- Deformation Forging steel forging Conserving
Shaping Mass- Deformation Forging steel forgings Conserving
Shaping Mass- Deformation Forging aluminum forgings Conserving
Shaping Mass- Deformation Forging aluminum forgings Conserving
Shaping Mass- Deformation Extrusion steel extrusion Conserving
Shaping Mass- Deformation Extrusion aluminum extrusions Conserving
Shaping Mass- Deformation Extrusion aluminum extrusions Conserving
Shaping Mass- Deformation Extrusion aluminum extrusions Conserving
Shaping Mass- Deformation Extrusion aluminum extrusions Conserving
Shaping Mass- Deformation Extrusion aluminum extrusions Conserving
Shaping Mass- Deformation Wire Drawing copper wire drawing Conserving
Shaping Mass- Deformation Wire Drawing copper wire drawing Conserving
Shaping Mass- Deformation Wire Drawing copper wire drawing Conserving
Shaping Mass- Deformation Wire Drawing copper wire drawing Conserving
Shaping Mass- Deformation Wire Drawing steel wire drawing Conserving
Shaping Mass- Deformation Wire Drawing steel wire drawing Conserving
Shaping Mass- Deformation Wire Drawing steel wire drawing Conserving
Shaping Mass- Deformation Sheet Rolling aluminum sheet rolling Conserving
Shaping Mass- Deformation Sheet Rolling chromium steel sheet rolling Conserving
Shaping Mass- Deformation Sheet Rolling copper sheet rolling Conserving
Shaping Mass- Deformation Sheet Rolling steel sheet rolling Conserving
Shaping Mass- Consolidation gray ductile gray iron casting
Conserving iron
Shaping Mass- Consolidation gray ductile ductile iron pipe casting
Conserving iron
Shaping Mass- Consolidation steel steel casting
Conserving I
Shaping Mass- Consolidation aluminum high pressure aluminum die casting
Shaping Mass- Consolidation aluminum aluminum sand casting Conserving
Shaping Mass- Consolidation magnesium magnesium die casting Conserving
Shaping Mass- Consolidation zinc zinc die casting Conserving
Shaping Mass- Consolidation copper copper sand casting Conserving
Shaping Mass- Consolidation iron iron sand casting Conserving
Shaping Mass- Consolidation aluminum aluminum lost foam casting Conserving
Shaping Mass- Consolidation aluminum aluminum sand casting Conserving
Shaping Mass- Consolidation aluminum aluminum casting Conserving
Shaping Mass- Consolidation steel steel casting Conserving
Shaping Mass- Consolidation aluminum aluminum die castings Conserving
Shaping Mass- Consolidation gray ductile gray iron
Conserving iron
Shaping Mass- Consolidation steel steel and iron castings Conserving
Shaping Mass- Consolidation aluminum aluminum die castings Conserving
Shaping Mass- Consolidation gray ductile gray and ductile iron castings
Conserving iron
Shaping Mass- Consolidation aluminum aluminum die castings Conserving
Shaping Mass- Consolidation gray ductile gray and ductile iron castings
Conserving iron
Shaping Mass- Consolidation gray ductile gray iron castings
Conserving iron
Shaping Mass- Consolidation steel steel investment castings Conserving
Shaping Mass- Consolidation gray ductile gray and ductile castings
Conserving iron
Shaping Mass- Consolidation gray ductile gray iron castings
Conserving iron
Shaping Mass- Consolidation aluminum aluminum die castings Conserving
Shaping Mass- Consolidation gray ductile gray and ductile castings
Conserving iron
Shaping Mass- Consolidation steel steel castings Conserving
Shaping Mass- Consolidation aluminum aluminum die castings Conserving
Shaping Mass- Consolidation gray ductile gray and ductile castings
Shaping Mass- Consolidation iron iron sand castings Conserving
Shaping Mass- Consolidation gray ductile gray and ductile iron castings
Conserving iron
Shaping Mass- Consolidation zinc zinc die casting Conserving
Shaping Mass- Consolidation gray ductile gray and ductile iron castings
Conserving iron
Shaping Mass- Consolidation gray ductile gray and ductile iron castings
Conserving iron
Shaping Mass- Consolidation aluminum aluminum die castings Conserving
Shaping Mass- Consolidation aluminum aluminum die castings Conserving
Shaping Mass- Consolidation aluminum aluminum die castings Conserving
Shaping Mass- Consolidation copper brass castings Conserving
Shaping Mass- Consolidation copper brass castings Conserving
Shaping Mass- Consolidation zinc zinc die casting Conserving
Shaping Mass- Consolidation titanium titanium castings Conserving
Shaping Mass- Consolidation titanium titanium castings Conserving
Shaping Mass-Reducing Mechanical Reducing Steel Turning steel, conventional, average
Shaping Mass-Reducing Mechanical Reducing Steel Turning steel, conventional, primarily roughing
Shaping Mass-Reducing Mechanical Reducing Steel Turning steel, conventional, primarily dressing
Shaping Mass-Reducing Mechanical Reducing Steel Turning steel, CNC, average Shaping Mass-Reducing Mechanical Reducing Steel Turning steel, CNC, primarily
roughing
Shaping Mass-Reducing Mechanical Reducing Steel Turning steel, CNC, primarily dressing
Shaping Mass-Reducing Mechanical Reducing Chromium Steel Turning chromium steel, conventional, average Shaping Mass-Reducing Mechanical Reducing Chromium Steel Turning chromium steel,
conventional, primarily roughing Shaping Mass-Reducing Mechanical Reducing Chromium Steel Turning chromium steel,
conventional, primarily dressing Shaping Mass-Reducing Mechanical Reducing Chromium Steel Turning chromium steel, CNC,
average
Shaping Mass-Reducing Mechanical Reducing Chromium Steel Turning chromium steel, CNC, primarily roughing
Shaping Mass-Reducing Mechanical Reducing Chromium Steel Turning chromium steel, CNC, primarily dressing
Shaping Mass-Reducing Mechanical Reducing Iron Turning cast iron, conventional, average