HAL Id: hal-02878893
https://hal-enpc.archives-ouvertes.fr/hal-02878893
Submitted on 3 Jun 2021HAL is a multi-disciplinary open access archive for the deposit and dissemination of sci-entific research documents, whether they are pub-lished or not. The documents may come from teaching and research institutions in France or abroad, or from public or private research centers.
L’archive ouverte pluridisciplinaire HAL, est destinée au dépôt et à la diffusion de documents scientifiques de niveau recherche, publiés ou non, émanant des établissements d’enseignement et de recherche français ou étrangers, des laboratoires publics ou privés.
Mechanisms of liquid imbibition in Douglas-fir inferred
from 1H Nuclear Magnetic Resonance methods
Dang-Mao Nguyen, Sabine Caré, Denis Courtier-Murias, Meng Zhou, Philippe
Coussot
To cite this version:
Dang-Mao Nguyen, Sabine Caré, Denis Courtier-Murias, Meng Zhou, Philippe Coussot. Mechanisms of liquid imbibition in Douglas-fir inferred from 1H Nuclear Magnetic Resonance methods. Holz-forschung, De Gruyter, 2021, 75 (3), pp.225-236. �10.1515/hf-2020-0051�. �hal-02878893�
1
Soumis et accepté à HOLZFORSHUNG (18 Juin 2020)
1 2
Short title:
Imbibition in softwood observed by
1H NMR methods
34 5
Mechanisms of liquid imbibition in Douglas-fir inferred from
1H Nuclear
6Magnetic Resonance methods
78
Dang Mao NGUYEN 1, Sabine CARE 1, *, Denis COURTIER-MURIAS 1, Meng ZHOU 1,
9
Philippe COUSSOT 1
10
1 Lab. Navier, Ecole des Ponts, Univ Gustave Eiffel, CNRS, Marne-la-Vallée, France
11
* sabine.care@univ-eiffel.fr
12 13 14
Abstract: This study aims at identifying the mechanisms of oil and water imbibition in
15
heartwood and sapwood of Douglas-fir through a combination of original experiments with
16
Magnetic Resonance Imaging (MRI) and Nuclear Magnetic Resonance (NMR) relaxation
17
measurements for oil and free water, and deformation measurements for bound water.
18
Experiments by weighing are performed to verify whether the imbibition process is also
19
consistent with Washburn law. All the results are discussed taking into account the structure of
20
wood (tubular tracheids closed at their tips, but possibly connected to each other via open pits
21
on the side faces) and the preparation of samples.
22
The observation of relatively fast oil flow imbibition confirms that sapwood exhibits a
23
connected hydraulic network through which a liquid can a priori flow and climb along the
24
structure. However, the spontaneous water imbibition is strongly damped by its very poor
25
wetting when in contact with cell-walls only partially saturated with bound water, so that the
26
diffusion of bound water control the uptake dynamics. However, due to preferentially closed
27
pits, the heartwood does not exhibit a continuous hydraulic network and water essentially
28
penetrates into wood by diffusion through the cell walls.
29 30
Keywords: Free and bound water, Magnetic Resonance Imaging, Nuclear Magnetic Resonance
31
Relaxation, oil, permeability, softwood, Washburn.
32 33
2
Introduction
34
Water transport in wood material plays a major role with regard to its physical properties in
35
various situations, leading to a possible deterioration in performance of the timber elements.
36
Moreover, liquid (oil or water) impregnation to make the wood more resistant to decay or to
37
improve the process of peeling of wood logs for new product design (e.g. Plywood) is an
38
important subject in wood sciences. Therefore, it is crucial to understand how liquid penetrates
39
in the wood material. Liquid transfer in wood materials has been widely studied (Bao et al.
40
1986, Siau 1995, Elaieb 2014 and 2016, Johansson et al. 2011, Dupleix et al. 2013), it depends
41
on the permeability of wood, the viscosity of liquid as well as its wetting ability (Kučerová
42
2012, Schenk et al. 2018). But the physical mechanisms are not well understood yet. Thus, to
43
estimate lifetimes, to propose methods of maintenance through oil impregnation or to better
44
impregnate wood logs with aqueous liquid for peeling, it is necessary to continue the research
45
efforts for improving the understanding of the mechanisms of liquid transport in relation with
46
the structure of wood.
47
Wood is composed of tubular cells, with different void (i.e. lumen) sizes and arrangements
48
(essentially tracheids for softwoods and vessels and fibers for hardwoods), eventually
49
connected by pits on the side faces, and with characteristics depending on the localization
50
within the growth ring (latewood or earlywood) in the case of wood from temperate regions.
51
Moisture Content (MC) depends on the sorption mechanisms and water uptake (Almeida et al.
52
2007, Kekkonen et al. 2014) and is defined as the ratio of water mass to dry wood mass. Water
53
in cell walls is named bound water and when cell walls are saturated with bound water, MC is
54
called the Fiber Saturation Point (FSP). Water present in cell lumens is identified as free water.
55
Considering oil imbibition tests, only lumens are filled with oil.
56
For most porous materials, liquid transport is basically described by the Darcy’s law, which
57
indicates that the pressure gradient is equal to the flow rate times the fluid viscosity divided by
58
the medium permeability and the imbibition mechanism follows the Washburn law (Washburn
59
1921). This model predicts that the total liquid uptake is proportional to the square root of time
60
and that a uniform liquid front advances linearly with the square root of time. In wood, either
61
in softwoods or in hardwoods, these characteristics have been observed, for example for the
62
front of penetration (Kučerová 2012) or for the proportionality between the total liquid uptake
63
and the square root of time (Sedighi-Gilani 2014). However, even if some deviations from the
64
Washburn law are observed, capillary effects are usually considered.
65
In Zhou et al. 2018 and 2019, for oils of different viscosities, the Washburn model is
66
effectively in agreement with the dynamics of the process using the parameters (permeability,
67
contact angle, pore size) of the system as deduced from direct measurements for poplar
68
heartwood. However, this is not the case for water: spontaneous water imbibition is several
69
orders of magnitude slower than expected from the Washburn prediction using the effective
70
parameters of the system. In particular, observations with Magnetic Resonance Imaging (MRI)
71
showed that bound water progresses faster than free water and that the dynamics of imbibition
72
in poplar heartwood is partly governed by bound water progression, and then not by capillary
73
effects.
74
Actually, for the comprehension of the physical mechanisms of liquid imbibition into wood,
75
the critical point is to be able to measure its spatial distribution in time, taking into account its
76
state. For this purpose, 1H Nuclear Magnetic Resonance (NMR) is a helpful technique. In the
77
special case of water, it allows to discriminate free and bound waters through the spin-lattice
78
(T1) and spin-spin (T2) relaxation times (Zhou et al. 2018, van Meel et al. 2011, Gezici-Koç et
79
al. 2017 and 2018, Bonnet et al. 2017, Rostom et al. 2019). Although T1 can provide an insight
80
in the two types of bound water (Bonnet et al. 2017), T2 is best suited to discriminate bound
81
water –regarded as a whole- and free water. Bound water, through the hydroxyl groups of wood
3
components to form the hydrogen bonds, has a short T2-value. Free water behaves as bulk water
83
confined in a submillimeter pore and usually exhibits a longer T2-value (Gezici-Koç et al. 2017
84
and 2018), all the more long than the cell diameter is large. In some previous studies, NMR was
85
used to distinguish and quantify bound water and free water contents by T2 measurements
86
(Telkki et al. 2013, Menon et al. 1987, Labbé et al. 2002). As based on the T2-value, the dynamic
87
of bound and free water imbibition profiles, through MRI technique, along poplar wood sample
88
as a function of time were identified during water uptake (Zhou et al. 2018), and also the
89
moisture profiles of water states in yellow poplar under drying condition (Zhang et al. 2013).
90
In this paper, we focus on the imbibition mechanisms, i.e. how aqueous liquid tends to
91
spontaneously penetrate into softwoods in contact with it. Through an original approach
92
coupling quantitative information obtained from mass and deformation measurements, NMR
93
relaxation measurements and MRI observations, we are able to quantify bound and free water
94
dynamics. To discuss these results, standard imbibition tests by weighing are also performed
95
with water and oil and are analyzed through Washburn model.
96 97
Materials and Methods
98Wood materials
99
Wood samples are collected from Douglas-fir (Pseudotsuga menziesii) planks, which had been
100
left drying naturally under ambient conditions. Studied samples come either from the outer part
101
of the trunk (sapwood) or from the inner part (heartwood). The average density of all specimens
102
measured at 44% Relative Humidity (RH) is 590 (±40) kg.m-3 for heartwood and 620 (±030)
103
kg.m-3 for sapwood and the proportion of latewood related to the annual ring width is estimated
104
as 45±5% for all studied samples subjected to imbibition tests. These values are consistent with
105
literature (Lachenbruch et al. 2010, Osborne et al. 2016) for Douglas-fir with a high proportion
106
of latewood or for this RH. For instance, in Lachenbruch et al. 2010, the density at 12% MC is
107
783 kg.m-3 with a latewood proportion of 56%.
108
Density essentially finds its origin in different proportions of latewood and earlywood while
109
the general qualitative features of the material remain the same. The microstructural properties
110
explain the physical origin of liquid transfers. Heartwood and sapwood materials are mainly
111
composed of tracheids and a small percentage of rays is observed. The tracheids exhibit smaller
112
diameter in latewood compared to earlywood, with a ratio between them of about 2. The
113
average cell diameters are as follows: (heartwood) 39.4 ±4.2 µm in earlywood and 21.4 ±5.2
114
µm in latewood, and (sapwood) 44.7 ±4.7 µm in earlywood and 20.9 ±4.8 µm in latewood.
115
These measured lumen diameters are consistent with those given in (Ramage et al. 2017, Vahey
116
et al. 2007) for Douglas-fir. The cell length (along the L-axis) is approximately equal to a few
117
millimeters and the tubular tracheids are closed at their tips but connected to each other via
118
bordered pits on their lateral sides. The pits are located regularly along the tracheid cells. Most
119
of bordered pits of adjacent tracheid cells in heartwood are closed in the earlywood and opened
120
in the latewood, whereas in sapwood they are opened both in the early and latewood (Almeida
121
et al. 2008, Sedighi-Gilani et al. 2014). Through a quantitative analysis with Douglas-fir, it has
122
been shown in (Elaieb 2014) that about 65% of pits are open in sapwood but only 23% in
123
heartwood. Note that the rays contain a smaller number of pits in the crossing-field which are
124
connected to the tracheid cells. They may provide a path for internal flow, but since they are
125
perpendicular to the main flow direction of the present study, we assume that their role is here
126
negligible as considered in (Wardrop et al. 1961).
127 128
Wood samples and liquid
129
Two kinds of samples have been used: on the one hand, small cubes sawn along the anisotropic
130
directions, R, T and L (1x1x1 cm3 or 2x2x2 cm3), for NMR relaxation measurements and
4
characterization of the wood properties and, on the other hand, for the liquid imbibition tests,
132
large samples with about 10 cm in longitudinal (L) direction, parallel to the imbibition axis, and
133
about 4cm and 2cm in the tangential (T) and radial (R) direction respectively, with several
134
visible growth rings. Tests have been duplicated to check the reproducibility of the results.
135
Samples are all pre-conditioned in desiccators at 20oC and at 44% Relative Humidity (RH)
136
before testing. Note that for liquid imbibition tests, four of six sides of large samples are sealed
137
with a water impermeable coating along the vertical sides parallel to the imbibition direction in
138
order to avoid capillary effects between the external wood surface and the water bath, or
139
possible water uptake from the lateral sides (Zhou et al. 2018). In this work, imbibition tests are
140
performed with (deionized) water and three oils whose density, viscosity and surface tension at
141
25°C are respectively: Water (1000 kg.m-3, 0.001 Pa.s, 0.073 N m-1), Dodecane (740 kg.mm-3,
142
0.00134Pa.s, 0.025 N m-1), silicone oil 47V20 (950 kg.m-3, 0.02 Pa.s, 0.0206 N m-1) and silicone
143
oil 47V350 (970 kg.m-3, 0.35 Pa.s, 0.021 N m-1).
144
As water and dodecane have close viscosities, the differences in dynamics of imbibition, if
145
any, find their origin in differences in wood-liquid interactions or in penetration mechanisms.
146
To compare these two liquids, small cubes are prepared and conditioned at two RH levels with
147
saturated salt solutions (44%RH: Potassium carbonate, K2CO3 and 97%RH: potassium
148
sulphate, K2SO4) or immersed in water or docedane oil for 3 days. MC of wood is given in
149
Table 1. The values are obtained by drying all specimens at 103oC, in an oven, until reaching a
150
constant mass. For samples immersed in water or oil for 3 days, the accessible porosity Φ is the
151
volume of total water or oil to sample volume (at 44%RH) ratio. These results show that the
152
values seem to be quite similar for heartwood and sapwood. However, these results are related
153
to the scale of the used samples and the sample preparation by sawing may slightly increase the
154
accessibility of fluid inside wood by opening some tracheids (Choong et al. 1975). Moreover,
155
swelling coefficients are measured for samples subjected to RH (Table 2). These swelling
156
coefficients are in accordance with literature (MacLean 1958, Jamaaoui 2017). Concerning
157
dodecane oil, no swelling is observed.
158 159
NMR Relaxation measurements
160
For NMR measurement, small sample is inserted in a 18-mm diameter glass tube in which the
161
humidity level is imposed (same value as for sample preparation) during the NMR relaxation
162
experiment. This glass tube is then inserted into a Bruker Minispec MQ20 spectrometer at 0.5
163
T, corresponding to a resonance frequency of 20 MHz for 1H. The T
2 relaxation measurements
164
of the wood sample are performed using a Carr–Purcell–Meiboom–Gill (CPMG) NMR
165
sequence by carrying out 10000 echoes with an echo time of 0.5ms. A repetition time of 12
166
seconds was used (much higher than 5 times T1 in order to prevent sample heating), 8 averages
167
were used. The NMR data are post-treated by means of an Inverse Laplace Transform (ILT)
168
algorithm, which converts relaxation signal into a continuous distribution of T2 values. For
169
more details on the used homemade computer program and the artifacts of this technique, see
170
(Faure et al. 2008).
171 172
Free water and oil distribution from MRI
173
Large wood samples are immersed in liquid to a depth of about 5 mm. In case of oil, the wood
174
sample is placed in a glass Petri dish and MRI profiles are determined continuously. For water,
175
the imbibition test is performed outside the MRI apparatus and MRI measurements are carried
176
out at different times. The sample is put on a plastic sample support whose vertical position can
177
be adjusted in order to be placed inside the MRI system. Measurements are performed at a
178
vertical MRI spectrometer (DBX 24/80 Bruker) operating at 0.5 T and equipped with a 1H
179
birdcage radio frequency coil of 20 cm inner diameter, with the sample located at the magnetic
5
center of the gradient coil (a BGA26 Bruker, 26 cm inner diameter, 50mT/m gradient strength).
181
As NMR relaxation times depend on the magnetic field strength, they are in principle the same
182
in NMR relaxation and MRI experiments since both equipments have the same magnetic field.
183
The water or oil 1D profiles along the sample axis (Supplementary Material, Figure 1.1) are
184
measured by means of a spin-echo sequence, with an imaging gradient in the vertical direction,
185
and repeating the profiling process over 16 successive echoes created by a series of π pulses
186
separated by a fixed echo-time TE=3.47ms, and selected by means of 32-step duplex cogwheel
187
phase cycling scheme (Levitt et al. 2002). One measurement then provided a series of 16
188
profiles recorded at successive times TE, 2TE,…, 16TE during the spin-spin relaxation process,
189
with a field of view of 16 cm and a space resolution of 1.25 mm. A repetition time of 7 seconds
190
was used and 32 averages were measured. Signal intensity was calibrated using a glass tube of
191
known diameter filled with water or oil (using a repetition time of 12 seconds and 128
192
averages). In the case of water, due to the short relaxation time of bound water regarding TE,
193
only free water is detected. A monoexponential or biexponential fit was then used to quantify
194
the amount of liquid inside wood taking into account the relaxation times T2 (see below).
195
The 2D distribution (image) of free water or oil was observed by means of multi-slice 2D
196
MRI during the imbibition test. 2D MRI vertical slices of 2 mm thickness with 2-mm interval
197
between them (parallel to RL plane) passing through the wood sample with space resolution
198
equal to 0.47 (radial and tangential) × 2.19 (longitudinal) mm are taken at different times during
199
imbibition (Supplementary Material, Figure 1.1). A multi-slice multi-echo (MSME) pulse
200
sequence acquiring 8 echoes was used with an echo time of 10 ms and a recycle delay of 600
201
ms. On purpose of enhancing the signal to noise ratio without increasing the measurement time,
202
images intensities owing the each of the 8 echoes were added to produce the final picture. This
203
picture can only be used for the qualitative purpose of seeing where the fluid is. Note that in the
204
case of water, this weighing enhances the signal intensity of water in the large lumens of the
205
earlywood due to longer T2 time, which will be of key importance for data interpretation.
206 207
Bound water distribution from swelling measurements
208
To identify and quantify bound water distribution along the wood samples during water
209
imbibition tests with large samples, it is proposed to use swelling measurements after some
210
preliminary analysis providing the relation between the deformation to the bound water content
211
for small samples subjected to RH as done by (Zhou et al. 2018). The sample swelling is
212
measured along the radial (R) and tangential (T) directions every 5 mm along the longitudinal
213
direction (L) using a micrometer (Mitutoyo) with a precision of 0.01 mm for large samples
214
subjected to imbibition tests. For each distance, two different locations along the longitudinal
215
direction are considered to obtain an average value for both directions R and T.
216
Figure 1 shows the linearity of the relation observed between the bound water mass and the
217
corresponding sample volume increase on small samples. This result allows to determine a
218
“coefficient” of bound water mass per unit volume increase, which we will use later on to
219
translate the sample deformation during imbibition tests in bound water. Furthermore, the
220
calculated swelling coefficients (Table 2) show that the variation of the volume may be only
221
evaluated from the measurements of the dimensions along the radial and tangential directions,
222
as the swelling coefficient is negligible along the longitudinal direction. As no swelling is
223
observed during oil imbibition tests, this further supports the idea that strains are strictly related
224
to bound water during water imbibition, and this means that MRI profiles for oil imbibition will
225
in principle show the full amount of oil impregnating the sample. The total water mass entering
226
the samples measured by weighing is compared to the bound water mass evaluated from volume
227
variations plus the free water mass in wood determined from integration of the MRI 1D profiles
228
(Figure 2). It appears that the total water content entering the sample during imbibition test is
6
very close to the amount of bound water and free water inside wood. This confirms a very good
230
accuracy in quantifying the total free water in wood from 1D MRI method as well as in
231
computing bound water amount from deformation measurements.
232 233
Standard imbibition tests by weighing
234
A bottom open surface of the sample is placed (along a height of about 5 mm) in contact with
235
a bath of liquid (water or oil) covered by a film to avoid evaporation (Supplementary Material,
236
Figure 1.2). Liquid can then progress inside wood along its longitudinal direction. The other
237
open surface is connected to a precision balance via a hanging wire. The mass evolution of the
238
sample is recorded by a precision balance through an automatic recording system. The
239
imbibition test is carried out at room temperature (20oC). Note that the apparent mass has to be
240
corrected to get the effective mass due to a buoyancy force varying with the liquid level in the
241
bath (Supplementary Material, section 1).
242
A quantitative analysis of the imbibition tests may be done through the Washburn model as
243
explained below (for more details, see Zhou et al. 2018 and 2019). At the front of penetration
244
inside the sample (interface), the average capillary ascent of a liquid in a porous material (with
245
cylindrical conduit of radius R) is driven by the capillary pressure (neglecting ambient
246
pressure): ∆p=-2
σ
cosθ/α
R, whereσ
is the surface tension,α
a factor related to the pore shape247
and
θ
the contact angle. This driving force acts over a distance of penetration h, which induces248
a pressure gradient p/h. The Darcy’s law then expresses the balance between the pressure
249
gradient and the viscous resistance with
∆
p/h=µ
V/k whereµ
is the liquid viscosity, V the mean250
flow velocity through the sample, and k the permeability of the porous medium. Assuming that
251
the liquid advances as a front saturating the lumens below a distance h=
Ω
/ε
S increasing in time252
(where is the volume of water entered in the sample and S the section of the sample),
253
V=(d
Ω/
dt)/S=ε
(dh/dt), withε
the (accessible) medium porosity. Integrating the Darcy’s law we254
deduce that in a first regime controlled by capillary effects (negligible gravity effects) we have:
255
µ
λ
ε
h=Ω S = t (1)256
with λ= 2 εσcos / , which is independent of the liquid viscosity.
257
In a second regime controlled by gravity effects, h tends to a plateau hmax determined by:
258
ℎ → ℎmax= cos when → ∞ (2)
259
Then, since the main geometrical characteristics of the hydraulic system are known, the
260
fundamental unknown of the problem is the contact angle, which may be fitted to either the
261
dynamics or the maximum height of ascent. Note that if the porosity is not taken into account
262
in the previous relationships, this amounts to just consider an “apparent” height for the
263
progression of liquid.
264
For the flow through a cylindrical capillary, we have = 1 2⁄ (the meniscus is a spherical
265
cap) and the velocity profile can be computed exactly (Poiseuille law), which directly gives the
266
relation between the pressure gradient and the mean velocity, from which we deduce the
267
permeability for a set of parallel capillaries:
268
= /8 (3)
269 270
Results and discussion
271NMR Relaxation times for dodecane and water
272
Figure 3 presents the distribution of NMR intensity as a function of T2 for heartwood and
273
sapwood at 44%RH and 97%RH and after 3 days of immersion in water or dodecane.
274
In the case of immersion in water, three main peaks are observed for heartwood and
275
sapwood. The first peak with a T2 value surrounding 1 ms corresponds to the bound water at
7
44%RH and 97%RH and after 3 days of immersion in water (Gezici-Koç et al. 2017). This peak
277
is located at the very limit of T2 times that can be measured with the CPMG sequence, and is
278
just a -non quantitative - clue of a - true - fast relaxing peak of bound water existing for T2<1ms.
279
When the bound water content increases, the true peak increases in intensity and is shifted to
280
higher T2 due to the increased mobility of water molecules in cell walls (Bonnet et al. 2017),
281
thus leading to an increase and a small shift of the apparent peak which can be clearly observed.
282
Two other wide peaks are identified for both heartwood and sapwood. As admitted in literature
283
(Almeida et al 2007 and Gezici-Koç et al. 2017), these peaks are attributed to free water. They
284
are located at roughly 10 and 50 ms for heartwood and 17 and 70 ms for sapwood. These two
285
peaks depend on the lumen sizes, and the longer T2 is attributed to earlywood (Kekkonen et al.
286
2014, Menon et al. 1987). Note that, for heartwood, the two peaks are well-separated, but not
287
for sapwood. Variability in pore sizes maybe simply related to uncertainty in the ILT processing
288
but also to the seasonal variability of the wood structure. For sapwood, the T2 distribution may
289
reflect the polydispersity of the pore sizes (Gezici-Koç et al. 2017) and the presence of a
290
transition zone between earlywood and latewood.
291
In the case of dodecane immersion, essentially one peak is obtained, situated at relatively
292
large T2-values (about 955 ms and 992 ms for heartwood and sapwood respectively). Here the
293
surface relaxivity (i.e. the proportionality constant between T2 decay time and pore size) is very
294
small so that the influence of pore size on the T2 relaxation time of dodecane is weak (Zhou et
295
al. 2018). Also, a small peak at low relaxation time is visible in each case, which likely
296
corresponds to bound water as the sample is pre-conditioning at 44%RH.
297 298
Distribution of dodecane and free water from MRI and of bound water from swelling
299
measurements
300
Figure 4 shows MRI 2D images of dodecane and water entering in heartwood and sapwood
301
samples at different times. Furthermore, the 1D curve profiles (Figure 5) provide a
302
quantification of their penetration into samples as a function of time. In the case of water
303
imbibition, as explained previously, only free water is observed with MRI, and bound water
304
profiles are obtained from swelling measurements.
305
In the case of dodecane imbibition for heartwood (Figure 4a) its penetration in earlywood is
306
very limited (up to about 3-5 mm) and dodecane content seems to increase in this layer with
307
time. Above 5 mm, dodecane seems to preferentially penetrate in latewood along the vertical
308
axis of the sample up to the top of the sample. However, it remains that the MRI signal for the
309
2D images is very weak (same order of magnitude as the signal-to-noise ratio), and effectively
310
the 1D profiles show a very limited amount of dodecane entering into the sample (Figure 5a).
311
As the relaxation time is the same in early- and latewood, then a monoexponential fit is used to
312
quantify the total amount of oil and it is not possible to distinguish in both latewood and
313
earlywood. In the case of sapwood, the 2D images clearly show that some dodecane reaches
314
the top of the sample after only 3 hours of imbibition test, in agreement with the 1D profiles
315
with higher content of dodecane oil (Figure 4b and Figure 5b). Moreover, dodecane seems to
316
preferentially penetrate in the earlywood, but there may be some penetration in latewood, not
317
well visible on these images. The differences of dodedane penetration into heartwood or
318
sapwood may be explained by the fact that there are more open pits in sapwood, as explained
319
in the section “Wood materials”.
320
These results also show that for both types of wood, dodecane apparently does not progress
321
in the form of a uniform (straight) front saturating the sample at larger heights in time, as
322
expected from the standard Washburn imbibition process. However, dodecane imbibition
323
profiles showing a liquid profile extending widely throughout the material but of level
324
increasing in time, suggest that the material imbibition proceeds by a progressive increase of
8
the local saturation throughout the material. This aspect of the liquid profile results from the
326
heterogeneity of the material, while in each tracheid the liquid progresses as a straight front:
327
the dynamics of climbing varies from one tracheid to another, so that along some axis the liquid
328
may have already reached the sample top while in another place the liquid is much less
329
advanced. Such a heterogeneous distribution of front advances can predict this profile aspect.
330
According to the 2D images for free water (Figures 4c and 4d), the water front is climbing
331
in a jagged manner and clearly corresponds to the location of earlywood and latewood layers.
332
The heartwood provides an extremely slow water uptake which seems limited to a height of
333
about 5 mm after 6 days, with a progression front slightly higher in latewood. For sapwood, a
334
higher water uptake is observed with a water front reaching up to 35-40 mm over the same
335
duration. However, as explained previously, two T2 relaxation times for free water are observed
336
due to the presence of different lumen sizes. By this means we can now distinguish the
337
distribution of free water in each type of wood in time using a bi-exponential fit (Figures 5c
338
and 5d ). It appears that in sapwood the free water advances over significant distance in both
339
wood types (earlywood and latewood); in contrast, in heartwood, the free water seems to hardly
340
be able to reach a height larger than a few millimeters. These observations are consistent with
341
the qualitative observations from 2D MRI images.
342
Furthermore, according to the profiles of bound water, the most important result is that the
343
bound water distribution extends farther than the profile of free water, an effect particularly
344
clear for heartwood. So it can be considered that bound water at least partly propagates by itself
345
longitudinally through the cell walls. In particular, bound water uptake seems to be quite
346
constant up to the front of penetration of free water, with a moisture content close to the FSP
347
(taking into account the moisture content at 44%HR, Table 1). This suggests that basic
348
characteristics of water transport in softwood qualitatively similar to that in hardwoods (Zhou
349
et al. 2018), i.e. a dynamics of imbibition mainly governed by the longitudinal progression of
350
bound water in the sample: free water can advance through the vessels (considered as opened
351
capillary tubes with unlimited length) only when cell walls are saturated with bound water.
352
However, in the case of softwood, the mechanisms for liquid water transport may be quite
353
different as the structure is different with tracheids, with limited length, closed at their ends and
354
connected to each other by pits.
355
To conclude, in coherence with Sedighi-Gilani et al. 2012 and 2014, the water uptake is
356
significantly larger for sapwood than for heartwood. This result is similar for oil penetration.
357
The liquid transport penetration in heartwood and sapwood may depend on open or closed pits.
358
Furthermore, for both materials, larger oil and water contents are localized in the first 5 mm,
359
due to possible effect of preparation of sample. Indeed, sawing may slightly increase the
360
accessibility of fluid inside wood by opening tracheids (Choong et al. 1975).The aim of the
361
next section is to precise the involved mechanisms for both materials, through Washburn model
362
and from the standard imbibition tests.
363 364
Discussion through standard imbibition tests by weighing
365
Imbibition results for water and oil are expressed in terms of the liquid volume entering into
366
wood, per sample area (expressed as “apparent height”) as a function of the time rescaled by
367
the liquid viscosity (Figure 6). This representation is useful to discuss the imbibition dynamics
368
of different liquids with regards to the Washburn model (Equation (1)). The data deduced from
369
MRI experiments are also shown in the same graph and an excellent agreement is found
370
between these data and those obtained from mass measurements. In Supplementary Material
371
(section 2), the volume of water or oil per sample area as a function of time and 2D MR images
372
for the three oils at the end of the imbibition tests are also shown for further discussions. Note
373
that for a cylindrical capillary containing, from place to place perturbations (e.g. pits) of its
9
shape over very short distance, the maximum height of ascent is that of the main cylinder, since
375
the liquid must be able to climb between two successive perturbations, and thus Equation (2) is
376
still valid with R the main cylinder radius. Furthermore, the permeability may be affected
377
(decreased) by these perturbations as they induce further viscous dissipation during the liquid
378
flow through the whole system. It follows that the dynamics may be damped with regards to
379
that expected for the flow through a simple straight conduit but the Washburn law remains
380
valid.
381
Concerning sapwood (Figure 6a), the curves for oils of different viscosities (with only slight
382
differences in surface tension and likely close contact angles) superimpose along a master curve
383
when the time is rescaled by the viscosity. This demonstrates the validity of the assumption of
384
a viscous flow through a given hydraulic network at the origin of liquid uptake (for example in
385
consistency with the form of Equation (1)). In contrast, the imbibition curve for water, with a
386
surface tension different from that of oil by a factor about 3, is situated at rescaled times about
387
100 larger than the master curve for oils. The point may be more directly appreciated from the
388
representation of water uptake as a function of time (Supplementary Material, section 2):
389
dodecane and water have a similar viscosity but a surface tension different by a factor 3, but
390
the water uptake is slower by several orders of magnitude than that of oil. This means that in
391
that case the flow is not dependent on the same physical effects underlying the Washburn
392
approach for imbibition. This result is discussed in the following trough Washburn model. A
393
plateau in the imbibition curve is clearly observed for Dodecane around Ω/S=1.3 cm (Figure
394
6a, Equation (2)). Considering the accessible porosity of sapwood determined on small samples
395
(Table 1) for oil (i.e. 29.7%), this corresponds to an effective average maximum height of ascent
396
around hmax = (Ω/ɛS) = 4.4 cm. This may be in agreement with the 2D MRI images of Dodecane
397
oil, which show liquid signal at larger height, if we assume that the tracheid diameters are
398
somewhat dispersed around a mean value, allowing different final heights of ascent around this
399
one, up to the sample height (i.e. 10 cm). It is also possible that the accessible porosity,
400
determined from oil impregnation in small samples, was somewhat overestimated due to
401
tracheid opening when sawing, as explained previously. Finally, note that the results for oils of
402
different viscosities are consistent with the 2D MRI images providing the qualitative aspect of
403
liquid ascent (Supplementary Material, section 2). From Equation (2), using R = 15μm for the
404
average radius of tracheids (without distinguishing latewood and earlywood), a contact angle
405
of ϴ≈84° is calculated. Then, from the slope
λ
of the imbibition curve (Equation 1), the406
permeability value of the Washburn model may be deduced, i.e. k = 0.35 x 10⁻¹² m2. It is worth
407
noting that this value is of the same order as the permeability of a set of simple capillaries with
408
the same mean radius (Equation (3)), i.e. k = ɛR2/8 = 8.4 x 10⁻¹² m2, which confirms assumption
409
of oil flow through tracheids. The smaller permeability value obtained here would then likely
410
be explained by the existence of pits and direction changes all along the hydraulic network
411
leading to additional pressure drops. Finally, this tends to confirm that in sapwood the hydraulic
412
network is made of tracheids connected by open pits. As explained above, the oil imbibition
413
process maybe due to the heterogeneity of the tracheid sizes, which leads to a distribution of
414
Washburn imbibition with different characteristic times. It might alternatively be due to an
415
imbibition process involving the fast ascent of some fluid towards large heights coupled with a
416
more progressive imbibition in smaller pores at the different heights. To sum up: Washburn
417
model is valid along each series of connected tracheids, which explain that the observed
418
dynamics is consistent with the theoretical prediction, associated with a front step propagation
419
in this series, but the different dynamics in each of them may give the impression of a partial
420
saturation at different levels.
421
For water imbibition in sapwood, we observe a maximum apparent height (Ω/S) of ascent
422
similar to that found for oils, which leads to a similar value for the contact angle. Since from
10
such tests, as water (bound or free) cannot be distinguished, the total accessible porosity of the
424
system for water is considered (about 41.9%, Table 1), to compute the maximum height of
425
ascent, which resumes to considering that both phases approximately fill their own porosity at
426
the same rate. The predicted front of penetration (Equation 2) is then: hmax= (Ω/ɛS)=3.0 cm.
427
This value is in agreement with the (average) front of propagation determined with MRI 1D
428
profiles for both free and bound water, for about 3 days of imbibition tests (Figure 5d). A contact
429
angle of ϴ≈88° is then obtained, which is the hallmark of a poor wetting. Then, from the slope
430
λ
of the imbibition curve, we deduce the permeability value of the Washburn model, i.e.431
k= 3 x 10-15 m2. This permeability is several orders of magnitude lower than that expected for
432
a set of simple capillaries with the same mean radius (Equation 3), i.e. k = ɛR2/8 = 11.8 x 10⁻¹²
433
m2. It is also several orders of magnitude smaller than the permeability observed with oil, which
434
cannot solely be explained by the difference of accessible porosity to water. It is worth noting
435
that, although there is some significant uncertainty on the effective maximum height of ascent
436
in the tracheids, this does not affect this conclusion, i.e. using a different value for the accessible
437
porosity during the process would still lead to this very large discrepancy between the apparent
438
permeability and that associated with a standard Washburn ascent along the tracheids.
439
Imbibition results for heartwood strongly differ from those in sapwood (Figure 6b). First of
440
all, the maximum height reached is significantly lower (about three times) than that in sapwood
441
over similar duration, both for oil and water. Another remarkable point is that the curves for the
442
different oils or water do not superimpose when the time is rescaled by the viscosity. These
443
results may not be explained by the variability of samples (for instance the density due to
444
different proportions of latewood as mentioned above). In fact, the shift between them
445
approximately correspond to the viscosity factor, which means that the curves would roughly
446
superimpose if represented as a function of time (without rescaling by the viscosity). And
447
effectively, when the volume of oil per sample area entering into sample is represented as a
448
function of the (non-rescaled) time the curves superimpose (Supplementary Material, Figure
449
2.1). This implies that in that case the uptake of oil is independent of viscous effects, and thus
450
cannot be described by the standard Washburn approach which relies on a balance between
451
capillary and viscous effects. The estimation of the permeability gives value of the same order
452
as that observed for water in sapwood. Altogether these different observations confirm that here
453
the pits are preferentially closed, so that there is only negligible flow through the hydraulic
454
system up to the top of the sample. Concerning water, as for sapwood, from MRI measurements,
455
the bound water profile progresses in advance of free water, but in this case, the dynamics of
456
free water imbibition seems not to be mainly governed by the longitudinal progression of bound
457
water in the sample. Then only a small amount of water can penetrate in the structure,
458
essentially by diffusion through cell walls. However, it is not clear how it can occur for oil,
459
considering that oil essentially penetrates in the first 5mm, the amount above 5mm being
460
significantly lower due to closed pits. The preferentially penetration in the first 5mm layer may
461
be explained by the existence of open tracheids following cutting during the sample preparation.
462
Above a few millimeters, liquid hardly progress in the tracheids because of preferentially closed
463
pits and with their limited length.
464 465
Discussion on the mechanisms of free water imbibition
466
All these results obviously mean that the propagation of water does not rely on the basic
467
physical assumptions underlying the Washburn model. Instead we have to consider that the
468
capillary transport may be damped by some effect. Since the pits are moist sensitive it may be
469
suggested that pits could tend to close when in contact with water while letting oil move
470
through. However, in that case we would expect some similar dynamics between heartwood
471
(for which pits are preferentially closed) and sapwood. This is not what we observe (Figure 6b):
11
the dynamics of water imbibition is apparently about six times faster in sapwood than in
473
heartwood. Moreover, in the case of heartwood, there is almost no free water penetrating the
474
sample within the duration of the test (Figure 5c), as a result of closed pits, whereas a significant
475
amount of free water apparently penetrates the sapwood region, meaning that in contrast pits
476
effectively remain open in sapwood (Figure 5d).
477
Actually, it is worth noting that bound water progresses through the sample more rapidly
478
than free water in heartwood and sapwood (Figures 5c and 5d) and water uptake seems to be
479
governed by bound water diffusion and not by capillary flow as expected by the Washburn law.
480
This is similar to an effect suggested for aspen heartwood by (Johansson et al. 2011) but not for
481
aspen sapwood. This result is still not fully understood. However, as explained above, the
482
climbing of free water is allowed only when the free water is in contact with cell-walls which
483
MC is close to the FSP, otherwise there is a negligible displacement of free water; under such
484
conditions the dynamics is governed by the coupling between the longitudinal diffusion of
485
bound water and the progressive advance of free water.
486
According to Zhou et al. 2019, this is associated with a strong change of the wetting
487
properties with the concentration of bound water: X-Ray synchrotron images indeed showed
488
that the apparent contact angle during imbibition was close to 90° while it was seen to be much
489
lower when the cell walls are saturated with bound water, which explains the need of sufficient
490
longitudinal diffusion of bound water before the water can further progress through the lumens.
491
Finally, note that these results seem to be supported by the MRI observations of Dvinskikh et
492
al (Eng. Structures, 2011) and Eiltelberg et al (2011) for a spruce sample simply put in contact
493
with air at a large RH. In that case, even in the absence of free water in contact with the sample,
494
bound water was observed to rapidly propagate in the longitudinal direction, showing its ability
495
to diffuse relatively rapidly thus keeping the possibility to control the liquid transport in an
496 imbibition process. 497 498
Conclusion
499The aim of this study was to analyze the mechanisms of liquid transport in Douglas-fir,
500
especially in heartwood and in sapwood. To answer to this question, two kinds of tests have
501
been performed to identify the mechanisms of water and oil penetration: NMR methods and
502
standard imbibition tests by weighing.
503
Concerning the oil penetration, our results show that the Washburn law is only verified for
504
sapwood. In the case of heartwood, our results show that the uptake of oil is independent of
505
viscous effects, and thus cannot be described by the standard Washburn approach which relies
506
on a balance between capillary and viscous effects.
507
For the case of water, the phenomena are more complex, as it is necessary to take into
508
account free water and bound water, and the Washburn law is not available for sapwood and
509
heartwood. Indeed, our results show that the front penetration of liquid water is mainly
510
governed by the longitudinal progression of bound water in the sample.
511 512
Acknowledgements
513This work has benefited from a French government grant managed by ANR within the frame
514
of the national program Investments for the Future ANR-11-LABX-022-01 (Labex MMCD,
515 http://mmcd.univ-paris-est.fr/). 516 517
References
518Almeida, G., Gagne, S., Hernandez, R.E. (2007) A NMR study of water distribution in
519
hardwoods at several equilibrium moisture contents, Wood Science and Technology,
520
41:293–307.
12
Almeida, G., Leclerc, S., Perre, P. (2008) NMR imaging of fluid pathways during drainage of
522
softwood in a pressure membrane chamber, International Journal of Multiphase Flow,
523
34:312–321.
524
Bao, F., Siau, J.F., Avramidis, S. (1986) Permeability and capillary structure of Chinese woods.
525
Wood and Fiber Science, 18(2): 220–227.
526
Bonnet, M., Courtier-Murias, D., Faure, P., Rodts, S., Care, S. (2017) NMR determination of
527
sorption isotherms in earlywood and latewood of Douglas fir. Identification of bound water
528
components related to their local environment, Holzforschung, 71(6):481–490.
529
Choong, E.T., McMillin, C.W., Tesoro, F.O. (1975) Effect of surface preparation on gas
530
permeability of wood, Wood Science, 7(4):319-322.
531
Dupleix, A., Denaud, L., Bleron, L., Marchal R., Hugues M. (2013) The effect of log heating
532
temperature on the peeling process and veneer quality: beech, birch, and spruce case studies.
533
Eur. J. Wood Prod. 71:163–171.
534
Dvinskikha S.V, Henrikssonb M., Mendicino A.L., Fortino, S., Toratti, T. (2011) NMR
535
imaging study and multi-Fickian numerical simulation of moisture transfer in Norway
536
spruce samples, Engineering Structures 33(11):3079-3086.
537
Elaieb, M.T. (2014) Amélioration de l'imprégnabilité aux solutions aqueuses des duramens des
538
résineux : Le cas du Douglas (Pseudotsuga Menziesii Franco), Thèse de l’Université de
539
Lorraine. In French.
540
Elaieb, M.T., Petrissans, A., Elkhorchani, A., Marchal, R., Pétrissans, M. (2016) Influence of
541
drying on douglas-fir heartwood impregnability to water, Innovation in woodworking
542
industry and Enginerring design, 1(9): 54–62.
543
Eitelberger J., Hofstetter K., Dvinskikh S.V. (2011) A multi-scale approach for simulation of
544
transient moisture transport processes in wood below the fiber saturation point, Composites
545
Science and Technology, 71(15):1727-1738.
546
Faure P., Rodts S. (2008) Proton NMR relaxation as a probe for setting cement pastes. Magn
547
Resonance Imaging 26:1183–1196.
548
Gezici-Koç, O., Erich, S.J.F., Huinink, H.P., van der Ven, L.G.J., Adan, O.C.G. (2017) Bound
549
and free water distribution in wood during water uptake and drying as measured by 1D
550
magnetic resonance imaging, Cellulose, 24:535–553.
551
Gezici-Koç, O., Erich, S.J.F., Huinink, H.P., van der Ven, L.G.J., Adan, O.C.G. (2018)
552
Understanding the influence of wood as a substrate on the permeability of coatings by NMR
553
imaging and wet-cup, Progress in Organic Coatings, 114:135–144.
554
Jamaaoui A., (2017) Durabilité et comportement hygroscopique du Douglas en relation avec
555
son patrimoine génétique, Thèse de doctorat de génie civil de l’Université de Limoges. In
556
French
557
Johansson, J., Salin, J.G. (2011) Application of percolation modelling on end-grain water
558
absorption in aspen (Populus tremula L.), Wood Material Science and Engineering,
559
6(3):112–118.
560
Kekkonen, P.M., Ylisassi, A., Telkki, V.V. (2014) Absorption of water in thermally modified
561
pine wood as studied by nuclear magnetic resonance, Journal of Physical Chemistry C,
562
118(4): 2146–2153.
13
Kučerová I., (2012) Methods to measure the penetration of consolidant solutions into ‘dry’
564
wood, Journal of Cultural Heritage, 13(3): S191-S195.
565
Labbé, N., De Jéso, B., Lartigue, J.-C., Daudé, G., Pétraud, M., Ratier, M. (2002) Moisture
566
content and extractive materials in maritime pine wood by low field 1H NMR,
567
Holzforschung 56:25–31.
568
Lachenbruch, B., Johnson, G.R., Downes, G.M., Evans, R. (2010) Relationships of density,
569
microfibril angle, and sound velocity with stiffness and strength in mature wood of
Douglas-570
fir, Canadian Journal of Forest Research, 40(1):55–64.
571
Levitt, M., Maduh, P., Hughes, C. (2002) Cogwheel phase cycling, Journal of Magnetic
572
Resonance, 155:300–306.
573
MacLean, J.D. (1958) Effect of moisture changes on the shrinking, swelling, specific gravity,
574
air or void space, weight and similar properties of wood, Madison, Wis. : U.S. Dept. of
575
Agriculture, Forest Service, Forest Products Laboratory.
576
van Meel, P.A., Erich, S.J.F., Huinink, H.P., Kopinga, K., Jong, J.D., Adan, O.C.G. (2011)
577
Moisture transport in coated wood, Progress in Organic Coatings 72:686– 694.
578
Menon, R.S., MacKay, A.L., Hailey, J.R.T., Bloom, M., Burgess, A.E., Swanson, J.S. (1987)
579
An NMR determination of the physiological water distribution in wood during drying,
580
Journal of Applied Polymer Science, 33:1141–1155.
581
Osborne, N.L., Høibø, Ø.A., Maguire, D.A. (2016) Estimating the density of coast Douglas-fir
582
wood samples at different moisture contents using medical X-ray computed tomography
583
Computers and Electronics in Agriculture, 127:50–55.
584
Ramage, H.M., Burridge, H., Busse-Wicher, M., Fereday, G., Reynolds, T., Shah, D.U., Wu,
585
G., Yu, L., Fleming, P., Densley-Tingley, D., Allwood, J., Dupree, P., Linden, P.F.,
586
Scherman, O. (2017) The wood from the trees: The use of timber in construction, Renewable
587
and Sustainable Energy Reviews, 68:333–359.
588
Rostom, L., Courtier-Murias, D., Rodts, S., Caré, S. (2019) Investigation of the effect of aging
589
on wood hygroscopicity by 2D 1H NMR relaxometry, Horlzforshung, online.
590
Sedighi-Gilani, M., Griffa, M., Mannes, D., Lehmann, E., Carmeliet J., Derome, D. (2012)
591
Visualization and quantification of liquid water transport in softwood by means of neutron
592
radiography, International Journal of Heat and Mass Transfer, 55:6211–6221.
593
Sedighi-Gilani, M., Vontobel, P., Lehmann, E., Carmeliet, J., Derome, D. (2014) Liquid uptake
594
in Scots pine sapwood and hardwood visualized and quantified by neutron radiography,
595
Materials and Structures, 47:1083–1096.
596
Schenk, H.J, Espino, S., Rich-Cavazos, S.M., Jansen S. (2018) From the sap’s perspective: The
597
nature of vessel surfaces in angiosperm xylem, American Journal of Botany 105(2): 1–14.
598
Siau, J.F. (1995) Wood: Influence of moisture on physical properties. Dept. of Wood Sci.
599
and Forest Prod., Virginia Tech, Blacksburg, VA. 227 pp
600
Telkki, V.V., Yliniemi, M., Jokisaari, J. (2013) Moisture in Softwoods: Fiber Saturation Point,
601
Hydroxyl Site Content, and the Amount of Micropores as Determined from NMR Relaxation
602
Time Distributions, Holzforschung, 67: 291–300.
603
Vahey, D.W., Zhu, J. Y., Scott, C.T. (2007) Wood density and anatomical properties in
604
suppressed-growth trees : comparison of two methods, Wood and fiber science.
39(3):462-605
471.
14
Zhang, M, Wang, X., Gazo, R. (2013) Water states in yellow poplar during drying studied by
607
time domain nuclear magnetic resonance, Wood and Fiber Science, 45(4):423–428.
608
Zhou, M., Caré, S., Courtier-Murias, D., Faure, P., Rodts, S., Coussot, P. (2018) Magnetic
609
resonance imaging evidences of the impact of water sorption on hardwood capillary
610
imbibition dynamics, Wood Science and Technology, 52(4):929–955.
611
Zhou, M., Caré, S., King, A., Courtier-Murias, D., Rodts, S., Gerber, G., Aimedieu, P., Bonnet,
612
M., Bornert, M., Coussot, P. (2019) Liquid uptake governed by water adsorption in
613
hygroscopic plant-like materials, Physical Review Research, 1:033190
614
Wardrop, A.B., Davies, G.W. (1961) Morphological factors relating to the penetration of
615
liquids into woods, Holzforschung, 15(5):129-141.
616
Washburn, E.W. (1921) The dynamics of capillary flow, Physical Review, 17:273–283
617 618 619
15
TABLES
620 621
Table 1: Moisture Content MC (%) and accessible porosity Φ (%). Mean and Standard
622
Deviation (SD) values are given (three samples).
623 MC at 44% RH MC at 97% RH MC (3 days in water) Φ (3 days in water) Φ (3 days in oil) Sapwood 10.2 (±0.1) 25.3 (±0.35) 79.4 (±3.7) 41.9 (±1.2) 29.7 (±0.1) Heartwood 10.5 (±0.1) 20.5 (±0.25) 75 (±0.15) 39.1 (±3.2) 23.9 (±2.0) 624
Table 2: Swelling coefficients α (%/%) along the anisotropic directions R, T, L. Mean and
625
Standard Deviation (SD) values are given (three samples).
626 α (R) α (T) α (L) Sapwood 0.17 (±0.02) 0.40 (±0.01) 0.007 (±0.004) Heartwood 0.14 (±0.02) 0.20 (±0.003) 0.02 (±0.01) 627 628
16 FIGURES 629 630 631 632
Figure 1: Additional mass ∆m of bound water recorded by weighing as a function of volume
633
increase ∆V (determined on small samples) for heartwood and sapwood between 44% RH to
634 97% RH. 635 636 637 638
Figure 2: Free water mass (from MRI) plus bound water (from swelling measurements ∆V)
639
compared to the total water uptake determined by weighing, at different times during imbibition
640
tests with large samples for heartwood (black or blue circle symbols for two tests) or for
641
sapwood (black square symbols).
642 643 644
17 645
646
647
Figure 3: NMR T2 relaxation times for heartwood (a) and sapwood (b) under 44% or 97% RH
648
and after 3 days of immersion in water or dodecane.
649 650 651
18 652
653
654
Figure 4: 2D MRI images (longitudinal-radial plane) of dodecane oil and free water distribution
655
in wood samples at different times during imbibition tests for heartwood (a, c) and (b, d) for
656
sapwood. The front of liquid penetration is indicated by a white arrow according to the 1D
657
profiles given in Figure 5. A view of the sample cross section is inserted showing the
658
correspondence between the main liquid paths and the sample structure (latewood and
659
earlywood).
660 661 662
19 663
664
665
Figure 5: 1D MRI profiles of oil (dodecane) and water uptake at different times for heartwood
666
(a, c) and sapwood (b, d).
667 668 669
20 670
671
672
Figure 6: Absorbed liquid volume per unit cross-section Ω/S area against the time per 673
viscosity t/µ of water, dodecane oil and two silicone oils for sapwood (a) and heartwood 674
(b) samples. The dashed line of slope 2 in Fig. a is a guide for the eye. 675
21
S
UPPLEMENTARY
M
ATERIAL
677
Mechanisms of liquid imbibition in Douglas-fir inferred from
1H Nuclear Magnetic
678
Resonance methods
679
Dang Mao NGUYEN 1, Sabine CARE 1, *, Denis COURTIER-MURIAS 1, Meng ZHOU 1, 680
Philippe COUSSOT 1 681
1 Lab. Navier, Ecole des Ponts, Univ Gustave Eiffel, CNRS, Marne-la-Vallée, France
682
* sabine.care@univ-eiffel.fr
683
SECTION 1: IMBIBITION TESTS
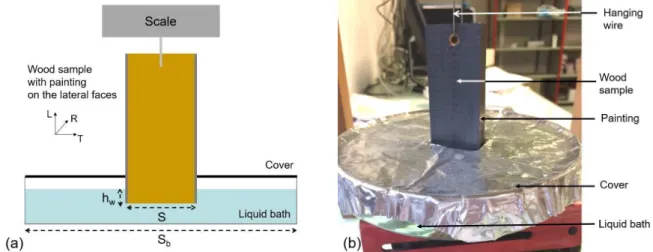
684Principles of MRI measurements and of standard imbibition tests by weighing
685
Figure 1.1: Principle of the imbibition experiments, showing the orientation of the wood 686
sample, whose vertical faces have been sealed with paint and of the different MRI 687
measurements (for more details, see Zhou et al. 2018, 2019): a) Projection of transverse signal 688
for 1D profiles along sample axis. Every point corresponds to the integrated signal in the 689
horizontal slice with 1.25 mm of thickness. b) Slice selection for 2D NMR imaging. Examples 690
are given for dodecane oil imbibition. 691
692
Figure 1.2: Scheme of the standard imbibition test by weighing. a) Principle of the 693
measurements. b) View of the experiments. See below for the definitions of Sb, S and hw. 694
22 695
Correction of buoyancy force
696
The variation of buoyancy force referred to the initial state can been written as − #$%ℎ&, with
697
# the liquid density, $ the cross-section area of the wood sample and %ℎ&the variation of
698
wetted height. 699
The apparent mass of liquid entered in the sample thus writes 700
'( = ' − #$%ℎ& (S.1)
where ' is the effective entered mass. 701
Futhermore, the variation of liquid level in the bath results from this mass entrance: 702
' = #($*− $)%ℎ& (S.2)
where $* is the cross-section area of the liquid bath.
703
Using the value for %ℎ& deduced from equation (S.1), in the expression (S.2) we find the
704
expression for the effective entered mass of liquid: 705
' = '((1 − $/$*) (S.3)
SECTION 2: RESULTS
706Liquid volume per sample area against time
707
Figure 2.1: Liquid (oils and water) volume per sample area (cm) against time (hours) for 708
sapwood (a) and heartwood (b). Initial state for all samples: 44% RH. Tests have been 709
duplicated for heartwood to confirm these “unexpected results”. 710
23
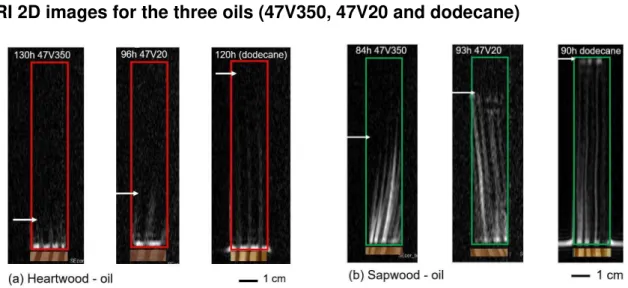
MRI 2D images for the three oils (47V350, 47V20 and dodecane)
712
713
Figure 2.2: 2D MRI images of the oil imbibition test along the longitudinal direction at the end 714
of the test for three oils (47V350, 47V20 and dodecane). Longitudinal-radial plane images: (a) 715
for heartwood and (b) for sapwood. A view of the sample cross section is inserted showing the 716
correspondence between the main oil paths and the sample structure (presence of latewood 717
or earlywood). The front of oil penetration is indicated by a white arrow. 718
REFERENCES
719Zhou, M., Caré, S., Courtier-Murias, D., Faure, P., Rodts, S., Coussot, P. (2018) Magnetic 720
resonance imaging evidences of the impact of water sorption on hardwood capillary imbibition 721
dynamics, Wood Science and Technology, 52(4):929–955. 722
Zhou, M., Caré, S., King, A., Courtier-Murias, D., Rodts, S., Gerber, G., Aimedieu, P., Bonnet, 723
M., Bornert, M., Coussot, P. (2019) Liquid uptake governed by water adsorption in hygroscopic 724
plant-like materials, Physical Review Research, 1:033190 725