HAL Id: hal-01701554
https://hal.archives-ouvertes.fr/hal-01701554
Submitted on 20 Apr 2018
HAL is a multi-disciplinary open access
archive for the deposit and dissemination of
sci-entific research documents, whether they are
pub-lished or not. The documents may come from
teaching and research institutions in France or
abroad, or from public or private research centers.
L’archive ouverte pluridisciplinaire HAL, est
destinée au dépôt et à la diffusion de documents
scientifiques de niveau recherche, publiés ou non,
émanant des établissements d’enseignement et de
recherche français ou étrangers, des laboratoires
publics ou privés.
initial segment before the establishment of the diffusion
barrier
Anna Brachet, Christophe Leterrier, Marie Irondelle, Marie-Pierre Fache,
Victor Racine, Jean-Baptiste Sibarita, Daniel Choquet, Bénédicte Dargent
To cite this version:
Anna Brachet, Christophe Leterrier, Marie Irondelle, Marie-Pierre Fache, Victor Racine, et al..
Ankyrin G restricts ion channel diffusion at the axonal initial segment before the establishment of
the diffusion barrier. Journal of Cell Biology, Rockefeller University Press, 2010, 191 (2), pp.383-395.
�10.1083/jcb.201003042�. �hal-01701554�
The Rockefeller University Press $30.00
Correspondence to Bénédicte Dargent: benedicte.dargent@univmed.fr Abbreviations used in this paper: AIS, axonal initial segment; ankG, ankyrin G; bp, band pass; CCD, charge-coupled device; CK2, protein kinase CK2; DIDC, distribution of the instantaneous diffusion coefficients; DIV, day in vitro; DMAT, 2-dimethylamino-4,5,6,7-tetrabromo1 H-benzimidazole; IQR, interquartile range; KS, Kolmogorov-Smirnov test; MAP2, microtubule-associated protein 2; MDC, median instantaneous diffusion coefficient; MSD, mean square displacement; MW, Mann and Whitney test; NF-186, neurofascin-186; NrCAM, neuronal cell adhesion molecule; QD, quantum dot; SPT, single-particle tracking; WSR, Wilcoxon signed ranked test.
Introduction
In mammalian neurons, the axonal initial segment (AIS) is a
unique domain that plays a crucial role in the physiology of the
nerve cell, as it orchestrates the interplay between electrogenesis
and neuronal polarity. At the AIS, the concentration of
voltage-gated ion channels ensures the generation of action potentials
(Clark et al., 2009), whereas the peculiar nature of the AIS
scaf-fold maintains the segregation between the axonal and
somato-dendritic compartment for membrane constituents and for
intracellular trafficking (Grubb and Burrone, 2010b).
At the molecular level, AIS functions require the
segrega-tion of the cytoskeletal adaptor ankyrin G (ankG; Salzer, 2003;
Ogawa and Rasband, 2008). The ankG–IV-spectrin scaffolding
complex not only concentrates Nav1 sodium channels (Srinivasan
et al., 1988; Zhou et al., 1998; Garrido et al., 2003; Lemaillet
et al., 2003; Hedstrom et al., 2007) but also Kv7 potassium
channels (Chung et al., 2006; Pan et al., 2006; Rasmussen et al.,
2007) and cell adhesion molecules neurofascin-186 (NF-186)
and neuronal cell adhesion molecule (NrCAM; Davis et al.,
1996; Dzhashiashvili et al., 2007; Hedstrom et al., 2007).
Im-portantly, the interaction between ankG and Nav1 channels is
modulated by protein kinse CK2 (CK2) phosphorylation. CK2
concentrates at the AIS, phosphorylates the ankyrin-binding motif
of Nav1 channels, and consequently regulates Nav1 interaction
I
n mammalian neurons, the precise accumulation of
sodium channels at the axonal initial segment (AIS)
ensures action potential initiation. This accumulation
precedes the immobilization of membrane proteins and
lipids by a diffusion barrier at the AIS. Using single-
particle tracking, we measured the mobility of a
chi-meric ion channel bearing the ankyrin-binding motif of
the Nav1.2 sodium channel. We found that ankyrin G
(ankG) limits membrane diffusion of ion channels when
coexpressed in neuroblastoma cells. Site-directed mutants
with decreased affinity for ankG exhibit increased
dif-fusion speeds. In immature hippocampal neurons, we
demonstrated that ion channel immobilization by ankG is
regulated by protein kinase CK2 and occurs as soon as
ankG accumulates at the AIS of elongating axons. Once
the diffusion barrier is formed, ankG is still required to
stabilize ion channels. In conclusion, our findings indicate
that specific binding to ankG constitutes the initial step for
Nav channel immobilization at the AIS membrane and
precedes the establishment of the diffusion barrier.
Ankyrin G restricts ion channel diffusion at the
axonal initial segment before the establishment of
the diffusion barrier
Anna Brachet,
1,2Christophe Leterrier,
1,2Marie Irondelle,
1,2Marie-Pierre Fache,
1,2Victor Racine,
3,4Jean-Baptiste Sibarita,
3,5,6Daniel Choquet,
5,6and Bénédicte Dargent
1,21Institut National de la Santé et de la Recherche Médicale, Unité Mixte de Rercherche 641, Marseille F-13916, France 2Université de la Méditerranée, Faculté de Médecine Secteur-Nord, Institut Fédératif de Recherche 11, Marseille F-13916, France
3Compartimentation et Dynamique Cellulaires, Institut Curie, Unité Mixte de Rercherche 144, Centre National de la Recherche Scientifique, 75248 Paris Cedex 05, France 4Institute of Molecular and Cell Biology, Proteos, Singapore 138673
5Centre National de la Recherche Scientifique, Unité Mixte de Rercherche 5091, Bordeaux F-33077, France 6Université de Bordeaux 2, Bordeaux F-33077, France
© 2010 Brachet et al. This article is distributed under the terms of an Attribution– Noncommercial–Share Alike–No Mirror Sites license for the first six months after the pub-lication date (see http://www.rupress.org/terms). After six months it is available under a Creative Commons License (Attribution–Noncommercial–Share Alike 3.0 Unported license, as described at http://creativecommons.org/licenses/by-nc-sa/3.0/).
THE
JOURNAL
OF
CELL
BIOLOGY
on November 2, 2010
jcb.rupress.org
Downloaded from
Original image data can be found at:
http://jcb.rupress.org/content/suppl/2010/10/15/jcb.201003042.DC1.html Supplemental Material can be found at:
Results
ankG directly restrains ion channel diffusion when expressed in a neuronal cell line
To determine the effect of ankG on the surface diffusion of Nav1
channels, we first chose to heterologously express ankG and an
ion channel chimera in neuroblastoma N2A cells. The C
termi-nus of Kv2.1, which dictates its somatodendritic clustering (Lim
et al., 2000), was deleted and replaced with the 1,080–1,203
with ankG (Bréchet et al., 2008). In addition, Kv1
voltage-gated potassium channels are concentrated at the distal AIS
in certain types of neurons (Inda et al., 2006; Lorincz and
Nusser, 2008).
A handful of studies have revealed that the functional
or-ganization of the AIS contributes to the establishment and the
maintenance of neuronal polarity. Hedstrom et al. (2008) recently
demonstrated that axons acquire the molecular characteristics of
dendrites upon AIS disassembly, a result that was also confirmed
in vivo (Sobotzik et al., 2009). This contribution occurs through
intracellular and cell surface mechanisms, which are still poorly
understood. Two studies have shown that the AIS acts as a
cyto-plasmic filter controlling the entry of vesicles in axons (Burack
et al., 2000; Song et al., 2009). At the plasma membrane, the
AIS forms a diffusion barrier that maintains the differences in
protein and lipid composition between the somatodendritic and
the axonal domain of neurons (Kobayashi et al., 1992; Nakada
et al., 2003). Importantly, this fence restrains diffusion of axonal
proteins independently of their ability to bind to ankG (Winckler
et al., 1999; Boiko et al., 2007; Song et al., 2009). However, the
mechanisms of the diffusion barrier and its assembly have yet to
be determined.
The formation and the maintenance of the AIS depend
on ankG expression (Zhou et al., 1998; Hedstrom et al., 2007),
and in developing hippocampal neurons, its assembly occurs as
soon as the axon starts elongating (stage 2–3 neurons; Boiko
et al., 2007; Yang et al., 2007; Bréchet et al., 2008; Martin
et al., 2008). Because the segregation of the AIS components
appears before the general diffusion barrier (Nakada et al.,
2003), this opens the possibility that ankG-dependent
tether-ing is sufficient to restrain the surface diffusion of interacttether-ing
proteins like Nav1 and adhesion protein. Therefore, the present
study aims to analyze the precise role of ankG in the
restric-tion of ion channel diffusion and the potential role of CK2
phosphorylation in this process in an attempt to unravel the
mecha-nisms of the formation of a diffusion barrier at the AIS. We
used a construct bearing the ankyrin-binding motif of Nav1.2,
whose interaction with ankG is regulated by protein kinase
CK2 phosphorylation (Bréchet et al., 2008). We were able to
measure the surface diffusion of various Kv-Nav tetrameric ion
channel constructs with different ankyrin binding properties.
To do so, we used single-particle tracking (SPT; Borgdorff
and Choquet, 2002; Tardin et al., 2003) with semiconductor
quantum dot (QD) labeling (Dahan et al., 2003). Experiments
in N2A cells demonstrated that ankG binding restricts the
dif-fusion of chimeric ion channels and that phosphorylation of the
ankyrin-binding motif by CK2 modulates this immobilization.
In immature hippocampal neurons, ankG highly restricts the
diffusion of ion channels in a CK2-dependent manner, as soon
as it concentrates at the AIS. In mature neurons, ankG binding
is still necessary for full immobilization, although the
appear-ance of the diffusion barrier also slows the diffusion of proteins
that do not bind ankG. Altogether, our findings strongly suggest
that the immobilization of Nav1 is controlled by ankG from
early stages. Such an immobilization occurs independently
of the AIS diffusion barrier and may constitute the initial step
toward its establishment.
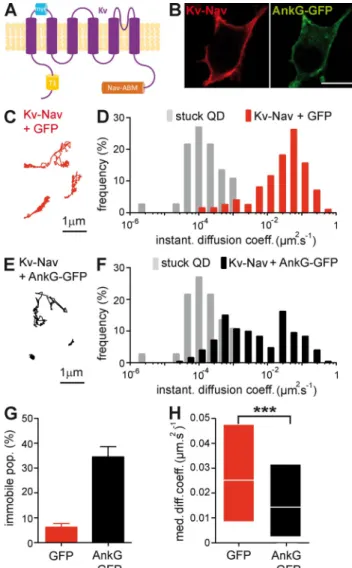
Figure 1. ankG restricts Kv-Nav diffusion at the surface of N2A cells. (A) Schematic representation of Kv-Nav chimera in which the C terminus of Kv2.1 was substituted by a segment encompassing the ankyrin-binding motif of Nav1.2. Note the presence of the tetramerization domain T1 in the N terminus of Kv2.1 and of an extracellular myc tag. (B) Surface expression of Kv-Nav in ankG-GFP–positive cells. Surface Kv-Nav was immunodetected with an antibody to myc (red), and ankG signal cor-responds to the GFP fluorescent signal on fixed cells (green). Bar, 10 µm. (C and E) Representative examples of QD trajectories corresponding to Kv-Nav in GFP (red, C)- and ankG-GFP–expressing N2A cells (black, E). (D and F) DIDC of Kv-Nav in GFP (red, D)- and ankG-GFP–expressing N2A cells (black, F). The immobile population (D ≤ 0.00075 µm2.s-1) was defined from the DIDC of QDs stuck on the glass coverslips (gray). Trajectories for GFP (n = 198) and ankG-GFP (n = 253) conditions were analyzed from three and four independent experiments, respectively. (G) Histogram of the mean values ± SEM for the immobile population (per-centage) of Kv-Nav in GFP and ankG-GFP conditions. (H) MDC (25–75% IQR) for the mobile population of Kv-Nav in GFP and ankG-GFP conditions. MW: ***, P < 0.001.
on November 2, 2010
jcb.rupress.org
extracted for the mobile particles (see Trajectory analysis in
Materials and methods).
In cells expressing GFP, surface Kv-Nav was highly
mo-bile, and the DIDC exhibited a broadly spread mobile population
(Fig. 1, C and D). In ankG-GFP–expressing cells, the Kv-Nav
trajectories were visually more restricted than the trajectories
recorded in GFP-expressing cells (Fig. 1 E), and Kv-Nav DIDC
was characterized by the appearance of a markedly less mobile
population (Fig. 1 F). Compared with GFP, ankG-GFP expression
strongly increased the population of immobile Kv-Nav, which rose
from 6 ± 1 to 34 ± 4% (Fig. 1 G). The MDC of mobile particles
significantly decreased between GFP and ankG-GFP conditions
(0.025 µm
2.s
1, interquartile range [IQR] of 0.0085/0.048 µm
2.s
1,
and 0.014 µm
2.s
1, IQR of 0.0024/0.032 µm
2.s
1, respectively;
Mann and Whitney test [MW], P < 0.0001; Fig. 1 H). These data
indicate that ankG restricts Kv-Nav diffusion in N2A cells.
Modulation of ankG binding affects the surface diffusion of ion channels
Neuronal sodium channels bind to ankG through their
ankyrin-binding motif, which spans from amino acids 1,102 to 1,128
in the II–III intracellular loop for Nav1.2 (Garrido et al., 2003;
Lemaillet et al., 2003). We recently showed that this interaction
is regulated by CK2 phosphorylation (Bréchet et al., 2008).
Nav1.2 and ankG associate with an apparent affinity constant
(K
d) of 1.2 ± 0.4 × 10
6and 0.9 ± 0.7 × 10
9M before and after
segment of Nav1.2 that encompasses the ankyrin-binding motif
(Kv2.1-Nav1.2, further called Kv-Nav; Fig. 1 A; Garrido et al.,
2003; Bréchet et al., 2008). The resulting construct can
tetra-merize (Li et al., 1992), leading to a complex that has a membrane
topology similar to Nav channels and bears four ankyrin-binding
motifs. In N2A cells, expression of endogenous ankG was not
detected by immunostaining (unpublished data). Kv-Nav was
uniformly expressed at the plasma membrane in N2A cells
(Fig. 1 B) in contrast to what is observed in human embryonic
kidney cells in which Kv-Nav and ankG formed aggregates
(Garrido et al., 2003), and transfected ankG-GFP displayed a
homogenous submembrane localization (Fig. 1 B). This allowed
us to analyze the effect of ankG on Kv-Nav mobility using an SPT
method to measure surface diffusion (Borgdorff and Choquet,
2002; Tardin et al., 2003). Kv-Nav was coexpressed in N2A
cells with either GFP or ankG-GFP, and surface channels were
labeled on living cells with QDs using their myc extracellular
tag. Rapid time-lapse imaging of individual QDs allowed us to
analyze a large number of individual trajectories from which the
distribution of the instantaneous diffusion coefficients (DIDC)
could be determined. From the DIDC, we chose the maximum
diffusion coefficient (D) of immobile QDs lying on the glass
coverslip (D ≤ 0.00075 µm
2.s
1) as the threshold, allowing us to
define the immobile population (Fig. 1, D and F). Key mobility
parameters such as median instantaneous diffusion coefficients
(MDCs) and mean square displacement (MSD) could then be
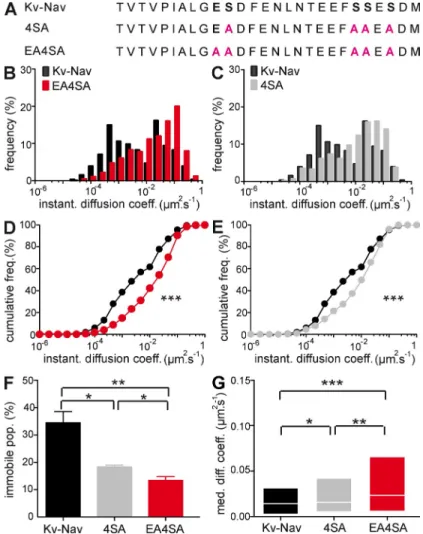
Figure 2. Relationship between the binding capacities of site-directed Kv-Nav mutants with their restriction of diffusion in N2A cells. (A) Sequence alignment of the ankyrin-binding domain for Kv-Nav, Kv-Nav 4SA (4SA), and Kv-Nav E4SA (E4SA) con-structs. Critical residues for the interaction with ankG are repre-sented in bold, and the mutated residues are highlighted in pink. (B–F) SPT of QD-labeled Kv-Nav with various ankyrin-binding affinities. (B and C) DIDC for EA4SA (red, B) and 4SA (gray, C). DIDC for Kv-Nav is represented in black for comparison. Trajecto-ries for E4SA (n = 623) and 4SA (n = 419) conditions were ana-lyzed from six and four independent experiments, respectively. (D and E) Cumulative frequencies of the instantaneous diffusion coefficients for Kv-Nav and 4SA (D) and Kv-Nav and E4SA (E). KS: ***, P < 0.001. (F) Histogram of the mean values ± SEM for the immobile population percentage of Kv-Nav, 4SA, and E4SA. MW: *, P < 0.05 and **, P < 0.01. (G) MDC (25–75% IQR) for the mobile population of Kv-Nav, 4SA, and E4SA. MW: *, P < 0.05; **, P < 0.01; and ***, P < 0.001.
on November 2, 2010
jcb.rupress.org
CK2 phosphorylation, respectively (Bréchet et al., 2008). The
mutation of the four serine residues (S1112, S1123, S1124, and
S1126) to alanine (4SA mutant) in the Nav1.2 ankyrin binding
site not only abolished the CK2-mediated affinity enhancement
but also prevented the negative dominant effect of Kv-Nav on
Nav accumulation at the AIS. Furthermore, these four serine
mutations combined with the mutation of the glutamate residue
E1111 (EA4SA mutant) fully abrogated the interaction of the
Kv-Nav construct with ankG (Bréchet et al., 2008). Thus, these
three structurally identical Kv-Nav constructs differing in their
ankyrin-binding motif offer the unique opportunity to study the
relationship between the strength of ankyrin binding and the
surface mobility of ion channels (Fig. 2 A). It must be noted that
these constructs are tetramers that bear four ankyrin-binding
motifs, exacerbating their binding to ankG and its modulation
in the different mutants. We measured the diffusion of site-
directed Kv-Nav mutants in N2A cells expressing either GFP
or ankG-GFP. In GFP cells, the immobile population of
Kv-Nav, Kv-Nav 4SA, and Kv-Nav EA4SA were 6 ± 1, 7 ± 2, and
4 ± 1%, respectively, with no significant difference between the
three constructs (unpublished data). In ankG-GFP–expressing
cells, the complete loss of ankG interaction (Kv-Nav EA4SA;
Bréchet et al., 2008) induced a large shift of the DIDC toward
higher values of diffusion coefficients and a significant
dif-ference in cumulative frequencies (Kolmogorov-Smirnov test
[KS], P < 0.0001) when compared with Kv-Nav (Fig. 2, B and D).
The immobile population decreased from 34 ± 4 to 13 ± 1%
(MW, P = 0.0095; Fig. 2 F), and the MDC of the mobile
popula-tion rose from 0.014 µm
2.s
1, IQR of 0.0024/0.032 µm
2.s
1, to
0.023 µm
2.s
1, IQR of 0.0059/0.066 µm
2.s
1, respectively (MW,
P < 0.0001; Fig. 2 G). The diffusion behavior of the
phospho-deficient Kv-Nav 4SA mutant (Bréchet et al., 2008) was also
affected when compared with Kv-Nav (Fig. 2, C and E). The
cumulative frequency of diffusion coefficients of Kv-Nav 4SA
(Fig. 2 E) was significantly different from that of Kv-Nav and
Kv-Nav EA4SA (KS, P < 0.0001 and P = 0.001, respectively)
as well as the immobile population (18 ± 1%; MW, P = 0.0286
and P = 0.0190, respectively; Fig. 2 F) and the MDC of the
mobile population (0.016 µm
2.s
1, IQR of 0.0052/0.042 µm
2.s
1;
MW, P = 0.0242 and P = 0.0053, respectively; Fig. 2 G). These
findings indicate that site-directed mutants with decreasing
affinities for ankG exhibited increasing diffusion speeds,
high-lighting the importance of ankG binding for chimeric ion
chan-nel immobilization at the plasma membrane.
ankG immobilizes ion channels at the nascent AIS of neurons
In the nervous system, the subcellular localization of ankG is
highly specific, being segregated at the AIS and in the nodes of
Ranvier (Kordeli et al., 1995). ankG accumulation also occurs at
the AIS of developing hippocampal neurons maintained in vitro
(Garrido et al., 2003; Boiko et al., 2007). In these cells, the AIS
molecular assembly has already begun after day in vitro (DIV) 4
(Boiko et al., 2007; Yang et al., 2007; Bréchet et al., 2008;
Martin et al., 2008), as visualized by the consistent
immuno-staining for ankG, Nav1, and NF-186 (Fig. 3 A). The AIS of
cul-tured hippocampal neurons then develops a diffusion barrier that
Figure 3. Interaction with ankG restricts Kv-Nav diffusion at the AIS in young neurons. (A) Accumulation of endogenous AIS components. DIV 4 hippocampal neurons were stained for ankG, Nav, and NF-186 (black). Bar, 10 µm. (B and C) Mutation of the ankyrin-binding motif perturbs polar-ized expression of surface Kv-Nav. Cell surface distribution of Kv-Nav (B) and Kv-Nav EA4SA (E4SA; C). DIV 4 cultured hippocampal neurons were transfected with the different constructs. Kv-Nav constructs were detected with an antibody against myc (green). The somatodendritic domain and the AIS were identified by MAP2 (blue) and ankG staining (red), respec-tively. Bars, 10 µm. (right) Histograms of the cell surface distribution for Kv-Nav (B) and EA4SA (C). The expression profiles of transfected (myc positive) neurons were classified into three categories: myc staining segre-gated at the AIS (segresegre-gated, S); distributed at the cell surface of the soma and proximal dendrites with a concentration at the AIS (concentrated, C); and uniformly distributed at the cell surface (nonpolarized, NP). 100% represents the total population of transfected neurons. Data are means ± SEM with n = 165 and 52 from four and two independent experiments for Kv-Nav and EA4SA, respectively. (D and E) Distribution (D) and cumula-tive frequency (E) of the instantaneous diffusion coefficients of Kv-Nav and EA4SA (n = 53 and 32 trajectories from four independent experiments for Kv-Nav and EA4SA, respectively). KS: ***, P < 0.001. (F) Histogram of the mean values ± SEM for the immobile population of Kv-Nav and EA4SA. MW: *, P < 0.05. (G) MDC (25–75% IQR) of the mobile popula-tion of Kv-Nav and EA4SA. MW: **, P < 0.01.
restricts the mobility of membrane proteins and phospholipids,
but this general diffusion barrier is not yet formed in DIV 4
hippocampal neurons (Nakada et al., 2003; Boiko et al., 2007).
on November 2, 2010
jcb.rupress.org
CK2 phosphorylation modulates ion channel diffusion at the nascent AIS in young neurons
We next examined how modulation of ankG binding properties
impacts the surface mobility of ion channels in young neurons.
Kv-Nav 4SA, which binds ankG with a reduced affinity, still
con-centrates at the AIS of DIV 4 neurons (Fig. 4 A), similar to what
was observed in DIV 10 neurons (Bréchet et al., 2008). However,
the diffusion properties of Kv-Nav 4SA were significantly
differ-ent from those of Kv-Nav, as a shift toward higher diffusion
co-efficients was seen in the DIDC and in the cumulative frequency
(KS, P = 0.002; Fig. 4, B and C). It should be noted that the
significant enhancement of mobility observed in the cumulative
frequency of diffusion coefficients was not associated with a
sig-nificant change of the immobile population (77 ± 6% for Kv-Nav
and 57 ± 6% for Kv-Nav 4SA; Fig. 4 D) nor in the MDC of the
mobile population (0.0015 µm
2.s
1, IQR of 0.0010/0.011 µm
2.s
1,
for Kv-Nav and 0.0043 µm
2.s
1, IQR of 0.0018/0.016 µm
2.s
1,
for Kv-Nav 4SA; Fig. 4 E). These results indicate that the
mu-tation of CK2-targeted serines alters Kv-Nav immobilization
in young neurons. To further assess the role of CK2
phosphoryla-tion on Kv-Nav immobilizaphosphoryla-tion, we analyzed Kv-Nav diffusion
upon acute inhibition of CK2 activity using DMAT
(2-dimethyl-amino-4,5,6,7-tetrabromo1 H-benzimidazole), a potent CK2
inhibitor (Pagano et al., 2004). Kv-Nav diffusion was first
mea-sured in control medium (vehicle condition; t = 0 min; Fig. 5 A).
After replacement of the medium with an equivalent solution
supplemented with DMAT, the movements of the same QD-
labeled ion channels were then repeatedly recorded for a further
10–25 min. The mean diffusion coefficients were calculated for
this period (t = 10–25 min; Fig. 5 A) and compared with the
ini-tial coefficients. After 10–25 min of DMAT application, the MDC
We took advantage of these observations to assess the specific
role of ankG in ion channel diffusion. We first examined the
sur-face distribution of Kv-Nav and Kv-Nav EA4SA when they were
expressed in DIV 4 neurons (Fig. 3, B and C). Kv-Nav was highly
concentrated at the AIS of 81.5% of the expressing cells, whereas
Kv-Nav EA4SA was not polarized in any of the counted neurons.
These observations are in line with our previous studies in more
mature cells (i.e., DIV 10 neurons; Garrido et al., 2003; Bréchet
et al., 2008). We next compared Kv-Nav and Kv-Nav EA4SA
mobility using ankG-GFP for AIS identification (Fig. 3, D–G).
A large fraction (77 ± 6%) of the Kv-Nav population was immobile
at the AIS (Fig. 3 F). This restriction relies on the ability of Kv-Nav
to bind to ankG, as DIDC and the cumulative frequency of Kv-Nav
EA4S4A shifted to higher diffusion coefficients (KS, P < 0.0001;
Fig. 3, D and E). As a result, only 16 ± 10% of the Kv-Nav EA4SA
population was immobile at the AIS (MW, P = 0.0294; Fig. 3 F), and
the mobile population diffused more than the Kv-Nav population
(0.0015 µm
2.s
1, IQR of 0.0010/0.011 µm
2.s
1, for Kv-Nav and
0.0413 µm
2.s
1, IQR of 0.0082/0.13 µm
2.s
1, for Kv-Nav EA4SA;
MW, P = 0.0019; Fig. 3 G). We verified that the accumulation of
endogenous ankG was sufficient to account for the drastic reduction
of Kv-Nav mobility by substituting NrCAM-GFP for ankG-GFP
to visualize the AIS (
Fig. S1
). In this condition, the immobile
population was 78 ± 8% for Kv-Nav compared with 27 ± 2%
for Kv-Nav EA4SA, and the MDC of the mobile population
was 0.0019 µm
2.s
1for Kv-Nav versus 0.071 µm
2.s
1for Kv-Nav
EA4SA (IQR of 0.0011/0.0070 and 0.021/0.12 µm
2.s
1,
respec-tively; MW, P = 0.0009; Fig. S1). These results show that the
specific interaction with ankG dampens the diffusion of Kv-Nav
in young hippocampal neurons. Thus, the nascent accumulation
of ankG is sufficient to markedly and specifically immobilize
ankyrin-binding ion channels in developing neurons.
Figure 4. Involvement of the ankyrin-binding motif serine residues in Kv-Nav immobilization at the AIS in young neurons. (A) Cell surface distribution of Kv-Nav 4SA (4SA), a phospho-deficient mutant, in DIV 4 hippocampal neurons. Quantification of the cell surface distribution of 4SA is represented on the right and was performed as described in Fig. 3. Data are means ± SEM with
n = 144 from four different experiments. Bar, 10 µm. (B and C)
Dis-tributions (B) and cumulative frequencies (C) of the instantaneous diffusion coefficients of 4SA (n = 69 trajectories from five indepen-dent experiments for 4SA. KS: **, P < 0.01). (D) Histogram of the mean values ± SEM for the immobile population of Kv-Nav and Kv-Nav 4SA. (E) MDC (25–75% IQR) of the mobile population of Kv-Nav and Kv-Nav 4SA.
on November 2, 2010
jcb.rupress.org
(78 ± 4% for Kv-Nav and 72 ± 8% for Kv-Nav 4SA), and
the MDC of the mobile population (0.0028 µm
2.s
1for Kv-Nav
and 0.0074 µm
2.s
1for Kv-Nav 4SA; IQR of 0.0019/0.012 and
0.0017/0.021 µm
2.s
1, respectively; Fig. 6, B and C). These
ob-servations suggested that CK2 modulation of Kv-Nav mobility
might be occluded in DIV 10 neurons in contrast to what was
observed in DIV 4 neurons (Figs. 4 and 5). Therefore, we
ana-lyzed Kv-Nav diffusion upon acute inhibition of CK2 activity
in a similar manner as described for young neurons (Fig. 5).
From 10 to 20 min after drug application, the MDC of initially
immobilized channels varied significantly in DMAT but not in
vehi-cle conditions (from 0.00013 µm
2.s
1, IQR of 0.000080/0.00022
µm
2.s
1, to 0.00020 µm
2.s
1, IQR of 0.00012/0.00085 µm
2.s
1,
for DMAT; WSR, P = 0.0186; and from 0.00016 µm
2.s
1, IQR
of 0.000072/0.00039 µm
2.s
1, to 0.00026 µm
2.s
1, IQR of
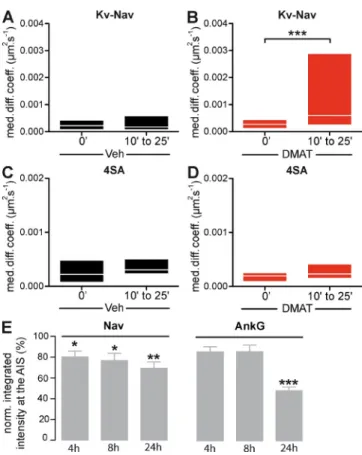
of initially immobile QDs increased significantly (from 0.00027
µm
2.s
1, IQR of 0.00013/0.00043 µm
2.s
1, to 0.00060 µm
2.s
1,
IQR of 0.00027/0.0029 µm
2.s
1; Wilcoxon signed rank test
[WSR], P = 0.0004; Fig. 5 A). This was not observed in control
cells treated with vehicle instead of DMAT (from 0.00023 µm
2.s
1,
IQR of 0.000098/0.00040 µm
2.s
1, to 0.00018 µm
2.s
1, IQR of
0.000091/0.00056 µm
2.s
1; Fig. 5 B). We next examined the effect
of DMAT on the diffusion of the phosphodeficient mutant Kv-Nav
4SA. No significant difference was measured in the MDC before
and after 10–25 min of either DMAT or vehicle applications (from
0.00020 µm
2.s
1, IQR of 0.00010/0.00025 µm
2.s
1, to 0.00023
µm
2.s
1, IQR of 0.00017/0.00041 µm
2.s
1, for DMAT and from
0.00022 µm
2.s
1, IQR of 0.000086/0.00047 µm
2.s
1, to 0.00031
µm
2.s
1, IQR of 0.00024/0.00050 µm
2.s
1, for vehicle; Fig. 5,
C and D). Comparison across conditions between DMAT and
vehicle treatments indicated different MDCs for Kv-Nav, but not
for Kv-Nav 4SA (MW for Kv-Nav, P = 0.0078; Fig. 5, C and D).
Altogether, these data strongly suggest that inhibition of CK2
phosphorylation is able to alter Kv-Nav mobility at the AIS.
We next examined whether the increase in mobility induced
by CK2 inhibition could later destabilize the concentration of
ankyrin-binding ion channels at the AIS. We quantified the
immunostaining of ankG and endogenous Nav1 channels in
neurons treated for 4, 8, or 24 h with either DMAT or vehicle. The
inhibition of CK2 activity induced a progressive decrease in Nav1
labeling at the AIS (80 ± 5% of control value after 4 h, 77 ± 7%
after 8 h, and 69 ± 6% after 24 h), a process that seems to occur
before perturbation of ankG concentration (decreasing to 86 ± 55%
after 4 h, 86 ± 6% after 8 h, and 48 ± 4% after 24 h; Fig. 5 E).
Collectively, these results show that binding affinity, restriction of
diffusion, and AIS concentration are correlated in young neurons.
They also demonstrate that CK2 can modulate Kv-Nav binding to
ankyrin and Kv-Nav immobilization in the nascent AIS.
ankG restricts ion channel diffusion at the AIS of mature neurons
We then studied the relationship between ankG binding and the
restriction of ion channel diffusion in mature neurons, which
de-velop a general diffusion barrier at the AIS (Winckler et al., 1999;
Nakada et al., 2003). To discriminate between an effect driven by
direct ankG binding from the effect of the general diffusion barrier,
we compared the diffusion behaviors of Kv-Nav, Kv-Nav 4SA,
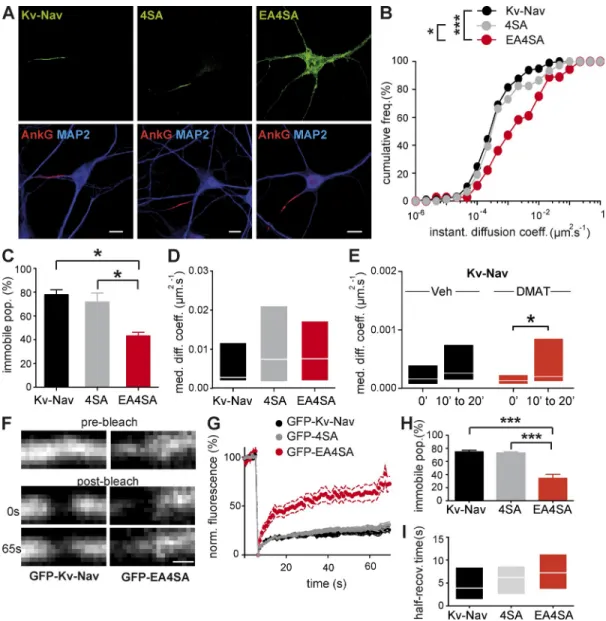
and Kv-Nav EA4SA in DIV 10 neurons. A loss of
compartmen-talization was observed for Kv-Nav EA4SA, but not for Kv-Nav
4SA (Fig. 6 A), in agreement with our previous study (Bréchet
et al., 2008). In DIV 10 neurons, the diffusion properties of Kv-Nav
EA4SA were different when compared with Kv-Nav (Fig. 6 B):
the DIDC and the cumulative frequency of diffusion coefficients
shifted toward higher values for Kv-Nav EA4SA (KS, P < 0.0001),
and the percentage of the immobile population dropped to 43 ±
3% (MW, P = 0.012; Fig. 6 C). Note that the MDC of the Kv-Nav
EA4SA mobile population was not significantly different from
that of Kv-Nav (0.0075 µm
2.s
1, IQR of 0.0018/0.017 µm
2.s
1;
Fig. 6 D). In comparison, Kv-Nav and Kv-Nav 4SA displayed
similar diffusion properties (Fig. 6, B and C): we did not find any
significant differences in the DIDC, the cumulative frequency of
diffusion coefficients (Fig. 6, B and C), the immobile population
Figure 5. Pharmacological inhibition of CK2 releases ion channels from immobility and destabilizes ion channel concentration at the AIS in young neurons. (A–D) SPT on Kv-Nav (A and B) and Kv-Nav 4SA (C and D) in DIV 4 neurons in the presence of the CK2 inhibitor DMAT. QD trajectories were recorded at the AIS of DIV 4 neurons acutely treated with 50 µM DMAT or a vehicle only during the indicated time intervals. For Kv-Nav, trajectories for vehicle (n = 14) and DMAT (n = 19) were analyzed from three and four independent experiments, respectively. For Kv-Nav 4SA, tra-jectories for vehicle (n = 11) and DMAT (n = 12) were analyzed from three indepent experiments. MDC (25–75% IQR) before and after drug addition for Kv-Nav (A and B) and Kv-Nav 4SA (C and D). WSR: ***, P < 0.001. (E) Effect of DMAT on the accumulation of AIS components in young neu-rons. DIV 3 cells were treated with either 50 µM DMAT or with DMSO (control cells) for 4, 8, and 24 h and were subsequently immunostained for Nav1 channels and ankG. Quantification of the respective fluorescence intensity was achieved and was normalized to 100%, representing the staining intensity measured in control cells. Histogram represents the nor-malized mean values ± SEM. The number of quantified AISs range from 69 to 118 per condition (two independent experiments). t test: *, P < 0.05; **, P < 0.01; and ***, P < 0.001.
on November 2, 2010
jcb.rupress.org
neurons (Fig. 6, F–I). NrCAM-mCherry coexpression was used
to visualize the AIS. The percentage of the immobile
popula-tion of GFP–Kv-Nav 4SA and of GFP–Kv-Nav was higher than
that of GFP–Kv-Nav EA4SA (71 ± 2, 75 ± 2, and 32 ± 6%,
respectively; MW, P < 0.0001 for both pairs; Fig. 6 H). The half-
recovery time of the three constructs was in the same range of
magnitude and did not differ significantly (Fig. 6 I). This
inde-pendent measurement of Kv-Nav mobility confirms that, in mature
neurons, a direct interaction with ankG restricts diffusion of
ion channels.
0.00015/0.00074 µm
2.s
1, for vehicle; Fig. 6 E). However,
com-parison across DMAT and vehicle conditions, implying the use
of unpaired statistical tests, showed no significant difference
(Fig. 6 E). Altogether, these data show that Kv-Nav
immobil-ization still depends on ankG binding in mature neurons but that
the CK2 modulation of Kv-Nav mobility is largely attenuated
at this stage.
We next conducted experiments using FRAP (Bats et al.,
2007) to compare the fluorescence recovery of GFP–Kv-Nav,
GFP–Kv-Nav 4SA, and GFP–Kv-Nav EA4SA in DIV 10
Figure 6. Interaction with ankG restricts Kv-Nav diffusion at the AIS of mature neurons. (A) Surface distribution of Kv-Nav, Kv-Nav 4SA (4SA), and Kv-Nav EA4SA (EA4SA) in DIV 10 hippocampal neurons. Cultured hippocampal neurons were transfected with the indicated constructs. Kv-Nav and mutants were detected, and neurons were stained as explained in Fig. 3. Bars, 10 µm. (B–E) SPT of QD-labeled Kv-Nav and mutants in DIV 10 neurons. (B) Cumulative frequencies of the instantaneous diffusion coefficients of Kv-Nav, 4SA, and EA4SA. Trajectories for Kv-Nav (n = 97), 4SA (n = 75), and EA4SA (n = 36) were analyzed from six, five, and five independent experiments, respectively. KS: *, P < 0.05 and ***, P < 0.001. (C) Histogram of the mean values ± SEM for the immobile population percentage of Kv-Nav, 4SA, and EA4SA. MW: *, P < 0.05. (D) MDC (25–75% IQR) of the mobile population of Kv-Nav, 4SA, and EA4SA. (E) SPT on Kv-Nav at the AIS of DIV 10 neurons acutely treated with 50 µM DMAT or vehicle. MDC (25–75% IQR) before and after drug addition. Analysis was performed as explained in Fig. 5. For DMAT condition, n = 11 trajectories from four independent experiments. For vehicle condition, n = 10 trajectories from three independent experiments. WSR: *, P < 0.05. (F–I) Analysis of the diffusion properties of GFP–Kv-Nav and mutants in DIV 10 neurons by FRAP. n = 22, 27, and 17 bleached regions that were analyzed from three independent experiments for Kv-Nav, EA4SA, and 4SA, respectively. (F) Representative examples of GFP–Kv-Nav (left) and GFP-EA4S4A (right) fluorescence at the AIS before photobleaching, immediately after photobleaching, and 65 s later. Bar, 1 µm. (G) Plot of the normalized mean fluorescence intensity ± SEM for GFP–Kv-Nav and mutants versus time before and after photobleaching. (H) Histogram of the mean values ± SEM for the immobile population percentage of indicated constructs. MW: ***, P < 0.001. (I) Histogram of the median values ± IQR (25–75%) for the half-recovery time constant of indicated constructs.
on November 2, 2010
jcb.rupress.org
as an AIS marker (
Fig. S2
). In this condition, Kv-Nav EA4SA
diffusion properties were similar for proximal dendrites and for
the AIS, similar to what was observed in the presence of
NrCAM-GFP (Fig. 7, A–C). These data show that an ion channel deficient
for ankG binding exhibited a restricted mobility at the AIS of
mature neurons, but not of immature neurons. This is likely to
result from the appearance of a general diffusion barrier, in line
with previous studies (Winckler et al., 1999; Nakada et al.,
2003). Altogether, these findings revealed that a two-step
mech-anism of diffusion restriction takes place at the AIS.
As soon as the scaffold protein concentrates at the AIS, before
the assembly of the diffusion barrier (DIV 4), a tight and
CK2-regulated binding to ankG is required to immobilize Nav channels.
Once the barrier is formed (DIV 10), ion channel immobilization
still requires ankG binding, but the presence of the barrier also
immobilizes proteins that bind weakly or do not bind ankG.
Discussion
In the present study, we show that ankG restricts diffusion of
Kv-Nav chimeric ion channels through interaction with the
Nav1.2 ankyrin-binding motif in N2A cells and hippocampal
neurons. In young neurons, CK2 is able to modulate the
immobil-ization of Kv-Nav. In mature neurons, ankG is still necessary
for Kv-Nav immobilization, and CK2 modulation is attenuated.
Our findings demonstrate that a CK2-regulated binding to
an-kyrin is initially required to immobilize Nav channels at the AIS
before the assembly of the diffusion barrier. Once formed, the
diffusion barrier can partially supplement the role of ankG in
immobilizing ion channels, as demonstrated with Kv-Nav mutants
A diffusion barrier restrains the diffusion of an ion channel deficient for ankyrin binding in mature neurons
The differential effect of CK2 on Kv-Nav immobilization at the
AIS between young and mature neurons may be linked to the
appearance of the diffusion barrier between these stages (Winckler
et al., 1999; Nakada et al., 2003). If this additional mechanism is
functional in DIV 10 neurons, the diffusion behavior of Kv-Nav
EA4SA should be different in proximal dendrites and in the AIS.
To test this hypothesis, we compared the diffusion properties of
Kv-Nav EA4SA in DIV 4 and DIV 10 neurons using
NrCAM-GFP for the assignment of AIS and proximal dendrite. In DIV 4
neurons, Kv-Nav EA4SA diffusion properties were identical in
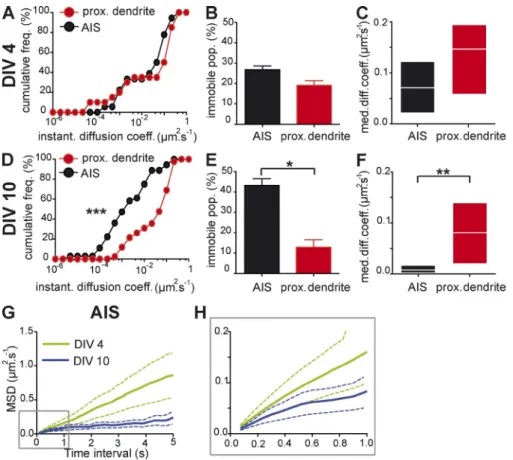
the AIS and the proximal dendrites (Fig. 7, A–C). In DIV 10
neurons, the cumulative frequencies of the diffusion coefficients
were significantly different (KS, P < 0.0001; Fig. 7 D). The
percent-ages of the immobile populations were 13 ± 4% for proximal
dendrites and 43 ± 3% for the AIS (MW, P = 0.0358; Fig. 7 E),
and the mobile fraction diffused faster in proximal dendrites
(0.080 µm
2.s
1, IQR of 0.020/0.14 µm
2.s
1) than at the AIS
(0.0075 µm
2.s
1, IQR of 0.0018/0.017 µm
2.s
1; MW, P = 0.0014;
Fig. 7 F). We further analyzed the confinement properties of the
mobile population at the AIS by evaluating its MSD. In DIV 4
neu-rons, the MSD of Kv-Nav EA4SA increased linearly as a
func-tion of time, indicating a free diffusing pattern of surface diffusion.
In DIV 10 neurons, MSD plotted as a function of time was
neg-atively curved, demonstrating that the protein moved in a
con-fined space (Fig. 7, G and H). To exclude the possibility that the
differences observed were caused by a low level of ankG
expres-sion in DIV 4 cells, we replaced NrCAM-GFP by ankG-GFP
Figure 7. The diffusion barrier is formed in DIV 10 but not in DIV 4 neurons. Comparison of the diffusion behavior of a mutant deficient for ankyrin binding (Kv-Nav EA4SA) at two devel-opment stages, DIV 4 (A–C) and DIV 10 (D–F), and in two distinct compartments of the plasma membrane, the AIS and proximal dendrites. For DIV 4, n = 18 and 20 trajectories from three and two independent experiments at the AIS and at proximal dendrites, respectively. For DIV 10, n = 36 and 41 trajectories from three and two independent experiments at the AIS and at proximal dendrites, respectively. (A and D) Cumulative frequencies of the in-stantaneous diffusion coefficients at the AIS and in proximal dendrites in DIV 4 (A) and DIV 10 (D) neurons. KS: ***, P < 0.001. (B and E) Histogram of the mean values ± SEM of the immobile population percentage in DIV 4 (B) and DIV 10 (E) neurons at the AIS and in proximal dendrites. MW: *, P < 0.05. (C and F) MDC (25–75% IQR) of the mobile population at the AIS and in proximal den-drites. MW: **, P < 0.01. (G) Mean plot of the MSD of the mobile population versus time (solid line) ± SEM (dotted line) for the indicated period for the mobile population at the AIS of DIV 4 and DIV 10 neurons. (H) Magnification of the boxed area in G.
on November 2, 2010
jcb.rupress.org
phosphorylation by an unknown kinase (Garver et al., 1997).
Here, perturbing ankG–Nav1 interactions by inhibiting CK2
with the DMAT inhibitor affects ion channel diffusion and
ac-cumulation at the AIS. CK2 inhibition leads to an enhanced
dif-fusion of Kv-Nav after 10 min and to a decrease in endogenous
Nav1 concentration at the AIS after 4–8 h. The difference
be-tween the short-term effect on diffusion and the long-term
effect on localization could seem paradoxical. However,
differ-ences in diffusion can be very slow to affect steady-state
localiza-tion of membrane proteins, as shown by mathematical modeling of
neurotransmitter receptors at the postsynaptic density (Holcman
and Triller, 2006; Sekimoto and Triller, 2009).
Primary role of ankG in restricting diffusion at the AIS
The primary role of ankG in AIS assembly and maintenance is
now established (Zhou et al., 1998; Hedstrom et al., 2007,
2008), but its role in the diffusion barrier has not been clearly
addressed yet (Lasiecka et al., 2008). Previous studies have
shown that there is a correlation between ankyrin concentration
at the AIS and the restriction of the diffusion of neurofascin
(Boiko et al., 2007) and lipids in older neurons (Nakada et al.,
2003). In a recent study, knocking down ankG expression
al-lowed VAMP2 to diffuse more freely at the AIS of young
neu-rons (Song et al., 2009). First, ankG is able to specifically
restrict the diffusion of ankG-binding constructs before the
dif-fusion barrier appears. Second, after the difdif-fusion barrier has
established at DIV 10, all constructs are slowed at the AIS
com-pared with proximal dendrites, but constructs that bind to ankG
are more immobile than constructs that do not. We could
sepa-rate the immobilization of ankyrin-binding proteins from the
general immobilization of membrane proteins caused by the
diffusion barrier because, in our system, we observed a
concen-tration of ankG at the AIS by DIV 4, similar to other studies
(Hedstrom et al., 2007; Song et al., 2009), before seeing an
effect of the diffusion barrier that is present at DIV 10. An
inter-esting question, given the large spread of DIDC for Kv-Nav, is
the relative contribution of ankG mobility, as scaffolding
com-plexes have been shown to be dynamic (Specht and Triller,
2008). However, the mobility of such scaffolds is usually very
low compared with the diffusion of membrane proteins. The
DIDC spread is more likely caused by rapid association–
dissociation events with ankG along the trajectories, resulting in
a diminished diffusion coefficient.
Subsequent steps in the diffusion barrier assembly
Our results show that ankyrin-binding proteins are immobilized
at the AIS as soon as DIV 4, whereas the mobility of ankyrin-
noninteracting proteins was restricted at a later stage of
develop-ment. This suggests that immobilization of ankyrin-binding proteins
is a preliminary step in the assembly of the diffusion barrier.
In the “fence and pickets” model of the AIS diffusion barrier
(Nakada et al., 2003), ankG acts as a fence post to recruit
binding membrane proteins as pickets. If
ankyrin-binding pickets are sufficient to slow down all AIS membrane
proteins, overexpressing NrCAM-GFP pickets at the AIS of
with reduced ankyrin binding. Thus, early immobilization of
ankyrin-binding proteins may constitute a preliminary step in
the formation of the diffusion barrier (Winckler et al., 1999;
Nakada et al., 2003).
Diffusion of ankyrin-binding proteins at the AIS
SPT with QDs was first used to study diffusion of the glycine
receptor in spinal cord neurons (Dahan et al., 2003). The main
benefit of this technique is that it allows the investigator to
ob-tain a detailed DIDC rather than a mean coefficient of
diffusion-like ensemble methods such as FRAP (Triller and Choquet,
2008). The diffusion coefficient values obtained for Kv-Nav
constructs are in the order of D = 0.001 µm
2.s
1in both young
and mature neurons. Compared with other membrane proteins,
this places AIS channels at the slowest part of the diffusion
spectrum (for review see Groc and Choquet, 2008). Early
re-sults suggested a slow diffusion of Nav1 channels at the axon
hillock (D = 0.015 µm
2.s
1; Angelides et al., 1988), later
con-firmed by SPT of toxin-tagged channels (D = 0.01 µm
2.s
1;
Nakada et al., 2003). For adhesion proteins, a diminished
diffu-sion of neurofascin at the AIS was observed using bound latex
beads (D = 0.01 µm
2.s
1; Winckler et al., 1999; Boiko et al.,
2007). The slower diffusion observed in the present study could
be caused by the higher sensitivity of the SPT/QD method.
Alternatively, immobilization could be enhanced by the
tetra-meric nature of Kv-Nav constructs that bear four ankyrin-
binding motifs. The tetravalence of Kv-Nav complexes is likely
to exacerbate the differences in the ankyrin binding properties
of Kv-Nav and its mutants and could have helped to
discrimi-nate their differences in diffusive properties. Nevertheless, one
of the main goals of future studies will be to measure the
diffu-sive properties of endogenous Nav channels that bear a single
ankyrin-binding motif.
Diffusion-trapping model for accumulation of ankyrin-binding proteins at the AIS
Studies of chimeras containing different portions of the Nav1.2
sodium channel have shown that these constructs are sent to
both somatodendritic and axonal compartments before being
selectively endocytosed (Fache et al., 2004) and retained at the
AIS because of their interaction with ankG via the
ankyrin-binding motif (Garrido et al., 2003; Lemaillet et al., 2003). By
using N2A cells and neurons at different stages of development,
we now show that the slow diffusion of Kv-Nav depends on its
binding to ankyrin. Downstream of targeting mechanisms, this
supports a diffusion-trapping mechanism for ankyrin-binding
channels at the AIS. Trapping of ion channels and adhesion
pro-teins by ankG could explain how they progressively concentrate
at the AIS in developing neurons (Xu and Shrager, 2005; Boiko
et al., 2007; Hedstrom et al., 2007). Interestingly, the ankG–
Nav1 interaction is regulated by CK2 phosphorylation, and the
restriction of CK2 to the AIS can explain why Nav1 channels
are preferentially trapped by ankG at the AIS rather than by
ankB further down the axon (Bréchet et al., 2008).
Ankyrin-based trapping of L1CAM by ankB has been demonstrated in
axonal growth cones (Gil et al., 2003) and is also dependent on
on November 2, 2010
jcb.rupress.org
Materials and methods
DNA constructs
The myc–Kv2.1-Nav1.2 1,080–1,203 (Kv-Nav) chimera and point mutant constructs have been described previously (Bréchet et al., 2008). HA– Kv2.1-Nav1.2 1,080–1,203-GFP (GFP–Kv-Nav) was generated from myc–Kv2.1-Nav1.2 1,080–1,203. The ApaI–ApaI fragment of this con-struct was introduced into the ApaI sites of plasmid containing EGFP–Kv2.1 (HA; gift of M.M. Tamkun, Colorado State University, Ft. Collins, CO). GFP–Kv-Nav mutants were obtained by sequential PCR amplification using a site-directed mutagenesis kit (QuickChange XL; Agilent Technologies).
NrCAM-GFP plasmid, in which the FNIII domains were replaced by the GFP, was provided by C. Faivre-Sarrailh (Centre National de la Recherche Scientifique, Marseille, France; Falk et al., 2004). To obtain NrCAM-mCherry, GFP was substituted for mCherry into AgeI–XhoI sites. 270 kD ankG-GFP plas-mid was a donation from V. Bennett (Duke University Medical Center, Durham, NC). All of the generated constructs were verified by DNA sequencing. Cell culture and transfection
Neuroblastoma cell line N2As were cultured in DME–GlutaMAX medium (Invitrogen) supplemented with 10% fetal calf serum (ABCyS), nonessential amino acids, and sodium pyruvate (Invitrogen). Transfection was per-formed using jetPEI (Polyplus Transfection). Transfected N2A cells were then cultured in serum-free medium (Opti-MEM–GlutaMAX; Invitrogen) to induce differentiation overnight.
Primary hippocampal neurons were prepared as previously de-scribed (Goslin and Banker, 1989; Garrido et al., 2003). Neurons were transfected at DIV 3 or DIV 8–9 using Lipofectamine 2000 (Invitrogen) ac-cording to the manufacturer’s instructions. Experiments were performed 18–25 h after transfection.
Kv-Nav QD-based tracking
Hippocampal neurons were cotransfected with NrCAM-GFP or ankG-GFP and Kv-Nav or Kv-Nav mutants. When transfected in neurons, NrCAM-GFP and ankG-NrCAM-GFP were concentrated at the AIS, and thus NrCAM-GFP fluores-cence concentration was used to localize the AIS in living cells. Conversely, proximal neurites not exhibiting GFP concentration were considered as proximal dendrites.
Neurons were incubated for 10 min at room temperature with 1 µg/ml rabbit polyclonal anti-myc (Abcam). Cells were then washed in neurobasal medium (Invitrogen) and incubated for 2 min at room tempera-ture with 605 nm QDs conjugated to 0.1–1 nm F(ab’)2 anti–rabbit (Invitro-gen). QDs were previously incubated with 1% casein to block nonspecific binding. After three fast rinses, coverslips were mounted in a sealed custom chamber filled with imaging buffer (120 mM NaCl, 3 mM KCl, 2 mM CaCl2, 2 mM MgCl2, 10 mM glucose, 10 mM Hepes, pH 7.35, and 250 mOsm). Neurons were imaged at 37°C on an inverted microscope (Axiovert 200; Carl Zeiss, Inc.) equipped with a 63× oil immersion objec-tive (NA = 1.4) and illuminated by a halogen lamp (HBO 100; OSRAM GmbH). GFP and QDs were detected using appropriate excitation and emission filters (band pass (bp) 475/40–bp 530/50 for GFP signal and bp 546/12–long pass 590 for QD signal). 512 consecutive frames were acquired at 13.3 Hz with a charge-coupled device (CCD) camera (Cool-Snap HQ; Photometrics). All recordings were done within 30 min after mounting the chamber.
N2A cells were cotransfected with GFP or ankG-GFP and Kv-Nav or Kv-Nav mutants. Cells were treated and imaged in the same conditions as neurons with the exception that N2A cells were washed in PBS and imaged in MEM medium (Invitrogen) supplemented with 20 mM Hepes. Trajectory analysis
QDs were detected and tracked using multidimensional image analysis software (Racine et al., 2006) run by MetaMorph (MDS Analytical Tech-nologies) with subsequent reconnection performed with routines written in Matlab (MathWorks). QDs exhibit a discontinuous fluorescence emission with “off” periods (blinking), allowing us to unambiguously detect single QDs. Trajectories were reconnected during off periods using the Matlab rou-tines, adapting for each video the maximum duration of the fluorescence disappearance and the maximum distance covered by the QDs during off periods. For N2A experiments, parameters for the reconnection of the tra-jectories during off periods were kept constant among videos. The MSD was calculated using MSD (ndt) = (N n)1∑
i=1Nn((xi+n xi)2 + ((yi+n yi)2)dt, where xi and yi are the coordinates of the tracked object on frame i, N is the total number of steps in the trajectory, and dt is the time interval between two successive frames. Instantaneous diffusion coefficients were calculated from linear fits of the n = 1–8 values of the MSD using MSD(t) = 4 Dt.
DIV 4 neurons should have a significant effect on the diffusion
of Kv-Nav E4SA, which does not interact with ankG. However,
we observed that NrCAM-GFP only slightly decreased Kv-Nav
E4SA diffusion (Fig. 6). This could be because
overexpres-sion of NrCAM-GFP is not sufficient to reach a critical
concen-tration of pickets (Nakada et al., 2003) or NrCAM-GFP is not
as functional as endogenous NrCAM, as it lacks the
extracellu-lar FnIII domain that was swapped for GFP (Falk et al., 2004).
More likely, the presence of more membrane ankyrin-binding
proteins is not sufficient to create a diffusion barrier. The AIS
still develops and matures between DIV 4 and DIV 10, with the
assembly of additional components. IV-Spectrin (Berghs et al.,
2000) is likely to be another constituent of the fence, although
its depletion affects the diffusion of only L1CAM along the
AIS (Nishimura et al., 2007). Specific lipids that are organized
and stabilized by membrane proteins, such as cholesterol, which
interacts with NrCAM through its palmitoylated residues (Ren
and Bennett, 1998), could also contribute to the restriction of
diffusion. Another probable factor is the appearance of a
spe-cific brevican-containing extracellular matrix that ensheathes
the AIS in mature neurons (Hedstrom et al., 2007) and is
likely to affect diffusion of membrane proteins (Frischknecht
et al., 2009).
Physiological role of the modulation of protein mobility at the AIS
This major role of a scaffolding protein in restricting membrane
protein diffusion and ultimately localization is reminiscent of
what has been consistently found at the postsynaptic
compart-ment. Direct or indirect interactions of neurotransmitter
recep-tors with scaffolds drive receptor concentration and play a role in
modulating their presence at the synapse. At excitatory synapses,
AMPA receptors associate with stargazin, resulting in the
im-mobilization of AMPA–stargazin complexes (Bats et al., 2007).
At inhibitory synapses, -aminobutyric acid and glycine
recep-tors bind to gephyrin, which leads to their concentration at the
postsynaptic density (Renner et al., 2008). Furthermore,
modu-lation of receptor concentration at synapses by neuronal activity
could occur through regulation of the scaffold–receptor
bind-ing strength, suggestbind-ing a mechanism for synaptic plasticity
(Ehrensperger et al., 2007; Newpher and Ehlers, 2008). Here, we
clearly show that Kv-Nav diffusion at the AIS is linked to its
capability to bind ankG, demonstrating that a regulation of
scaffold–membrane protein interaction can drive differences in
diffusional behavior. It must be noted that such a regulation
implies that the scaffold is in excess relative to the membrane
protein, which seems to be the case for ankG at the AIS (Davis
and Bennett, 1984). In addition, the modulation of ankG binding
to Kv-Nav is caused by phosphorylation by a specific kinase
(CK2; Bréchet et al., 2008), and we were able to detect the
regu-latory role of CK2 on Kv-Nav diffusion in young neurons. As the
AIS has recently been shown to be modulated by neuronal
activ-ity (Grubb and Burrone, 2010a; Kuba et al., 2010), it would be
very interesting to test whether variation in Nav1 diffusive
properties, as well as its dynamic regulation by CK2
phos-phorylation, play a role in this new mechanism of neuronal
intrinsic plasticity.
on November 2, 2010
jcb.rupress.org
Fluorescence was collected as Z stacks with sequential wavelength acquisi-tion. Quantification was performed using ImageJ software (National Insti-tutes of Health). Regions of interest corresponding to AIS were manually selected on ankG and/or Nav1 images and reported on other channels for intensity measurements. All intensities were corrected for background labeling. For illustration, image editing was performed using ImageJ or Photoshop CS4 (Adobe) and was limited to rolling-ball background sub-traction, linear-contrast enhancement, and adjustment.
Statistical analysis
Statistical analyses were performed with Prism software (GraphPad Soft-ware, Inc.). The parametric two-tailed t test was used for steady-state local-ization experiments, and the nonparametric tests (MW, WSR, and KS) were applied for diffusion experiments given to the anomalous nature of data distributions. Comparison of DIDC was performed using a KS. Online supplemental material
Fig. S1 demonstrates that accumulation of endogenous ankG is sufficient to account for the reduction of Kv-Nav mobility in young neurons. Fig. S2 shows that overexpression of ankG is not sufficient to induce a diffusion barrier in young neurons. Online supplemental material is available at http://www.jcb.org/cgi/content/full/jcb.201003042/DC1.
We thank F. Castets, J.-M. Goaillard, H. Vacher, and A. Woodhouse for com-ments on the manuscript; M.P. Blanchard, C. Poujol, and P. Legros for their help on imaging; and M. Savary and F. Rueda for preparing neuronal cultures. We thank G. Alcaraz, C. Faivre-Sarrailh, M.M. Tamkun, and V. Bennett for providing plasmids and reagents.
This work was supported by grants from the Institut National de la Santé et de la Recherche Médicale, the Ministère de la Recherche, the Agence Nationale pour la Recherche (grant A05161), the Fondation pour la Recher-che Médicale (grant R06048AA), and the National Multiple Sclerosis Society. A. Brachet was supported by fellowships from the Ministère de la Recherche, the Fondation pour la Recherche Médicale that also supported M. Irondelle, and the National Multiple Sclerosis Society. C. Leterrier was a recipient of post-doctoral fellowships from the Agence Nationale pour la Recherche, the Fondation pour l’Aide à la Recherche sur la Sclérose En Plaques, and the National Multiple Sclerosis Society. We thank the Centre National de la Recherche Scientifique for additional financial support to D. Choquet, B. Dargent, and J.B. Sibarita.
Submitted: 09 March 2010 Accepted: 15 September 2010
References
Angelides, K.J., L.W. Elmer, D. Loftus, and E. Elson. 1988. Distribution and lateral mobility of voltage-dependent sodium channels in neurons. J. Cell
Biol. 106:1911–1925. doi:10.1083/jcb.106.6.1911
Bats, C., L. Groc, and D. Choquet. 2007. The interaction between Stargazin and PSD-95 regulates AMPA receptor surface trafficking. Neuron. 53:719– 734. doi:10.1016/j.neuron.2007.01.030
Berghs, S., D. Aggujaro, R. Dirkx Jr., E. Maksimova, P. Stabach, J.M. Hermel, J.P. Zhang, W. Philbrick, V. Slepnev, T. Ort, and M. Solimena. 2000. IV spectrin, a new spectrin localized at axon initial segments and nodes of ranvier in the central and peripheral nervous system. J. Cell Biol. 151:985–1002. doi:10.1083/jcb.151.5.985
Boiko, T., M. Vakulenko, H. Ewers, C.C. Yap, C. Norden, and B. Winckler. 2007. Ankyrin-dependent and -independent mechanisms orchestrate axonal compartmentalization of L1 family members neurofascin and L1/neuron-glia cell adhesion molecule. J. Neurosci. 27:590–603. doi:10 .1523/JNEUROSCI.4302-06.2007
Borgdorff, A.J., and D. Choquet. 2002. Regulation of AMPA receptor lateral movements. Nature. 417:649–653. doi:10.1038/nature00780
Bréchet, A., M.P. Fache, A. Brachet, G. Ferracci, A. Baude, M. Irondelle, S. Pereira, C. Leterrier, and B. Dargent. 2008. Protein kinase CK2 contributes to the organization of sodium channels in axonal membranes by regulating their interactions with ankyrin G. J. Cell Biol. 183:1101– 1114. doi:10.1083/jcb.200805169
Burack, M.A., M.A. Silverman, and G. Banker. 2000. The role of selec-tive transport in neuronal protein sorting. Neuron. 26:465–472. doi:10.1016/S0896-6273(00)81178-2
Chung, H.J., Y.N. Jan, and L.Y. Jan. 2006. Polarized axonal surface expression of neuronal KCNQ channels is mediated by multiple signals in the KCNQ2 and KCNQ3 C-terminal domains. Proc. Natl. Acad. Sci. USA. 103:8870– 8875. doi:10.1073/pnas.0603376103
Inhibition of CK2 activity
Inhibition of CK2 activity was performed using the CK2 inhibitor DMAT (Pagano et al., 2004). DMAT (EMD) was dissolved in DMSO at 10 mM. For long-term treatment experiments, DMAT was added to the culture me-dium at a final concentration of 50 µM. Corresponding amounts of DMSO (vehicle) were added to the medium of control cells.
For DMAT acute application experiments, coverslips were first mounted in an open chamber (Life Imaging Services) with imaging buffer, transfected neurons were chosen, and control QD trajectories were re-corded. Then, the imaging buffer was replaced by the same medium sup-plemented with 50 µM DMAT or DMSO as a vehicle, and the same QDs were then imaged every 5 min for 20–25 min. Imaging was performed as described in the previous section with the exception that GFP and QDs were detected using different excitation and emission filters (bp 470/40–bp 525/50 for GFP signal and bp 525/45–bp 605/20 for QD signal). 1,024 consecutive frames were acquired at 27 Hz with a CCD camera (QuantEM:512SC; Photometrics). Only QDs that were initially immobile (D ≤ 0.00075 µm2.s1 before application of DMAT) were considered for the analysis of immobilization inhibition by DMAT.
FRAP experiments
Experiments were conducted on a wide-field FRAP imaging system (L5D; Institut Curie/Roper Industries) run by MetaMorph software using routines developed at the imaging platform of the Curie Institute. The microscope (DM6000; Leica) was equipped with a 63× objective, a monochromator for wide-field fluorescence excitation (Cairn Research), and an emission filter wheel (Sutter Instrument Co.).
Hippocampal neurons were cotransfected with NrCAM-mCherry and GFP–Kv-Nav or mutated GFP–Kv-Nav. The AIS of transfected neurons was visualized by NrCAM-mCherry fluorescence concentration. Conversely, proximal neurites not exhibiting NrCAM-mCherry concentration were con-sidered as proximal dendrites. For FRAP experiments, only the GFP channel was recorded. Cells were mounted in a custom sealed recording chamber in imaging medium (145 mM NaCl, 5 mM KCl, 2 mM CaCl2, 1 mM MgCl2, 10 mM glucose, 10 mM Hepes, 0.2% BSA, pH 7.39, and 280 mOsm) and maintained at 37°C. One to three circular regions (Gaussian profile beam of 1-µm width) on each AIS were bleached by high-intensity illumination using a 200-mW solid state 488-nm Sapphire laser (Coherent, Inc.) for 15 ms at 15 mW, reducing local fluorescence by 50–80%. Recovery was moni-tored by time-lapse acquisitions (one frame every second for 180 s) with a back-illuminated CCD (Cascade II; Photometrics). Illumination intensity was set to prevent observational photobleaching (<10% in 200 frames). Fluor-escence intensities were preliminarily corrected for background signal. Fluorescence signal was then normalized and corrected for ongoing photo-bleaching with the following equation: Fcorrt = (Ft/F0)/(Fnbt/Fnb0), where Ft is the fluorescence at time t, F0 is the fluorescence before bleaching, Fnbt is the mean fluorescence intensity of whole nonbleached image at time t, and Fnb0 is the mean fluorescence intensity of the whole nonbleached image before bleaching (Phair et al., 2003). Best fits of FRAP recovery curves were made according to the following equation: F(t) = Fmax(1 exp(Kt)), where Fmax is the normalized maximal fluorescence limit for an infinite recovery time, and K is the inverse recovery time constant. Half-time recovery is defined as 0.6932/K.
Immunocytochemistry
For immunohistochemistry, cells were fixed with 4% paraformaldehyde for 20 min at room temperature. Nonspecific binding was blocked with 0.22% gelatin in 0.1 M phosphate buffer for 30 min. For labeling of trans-fected Kv-Nav and mutants, cells were incubated for 1 h with mouse mono-clonal antibody to myc (1:200; Roche). Endogenous proteins (ankG, Nav1, NF-186, and microtubule-associated protein 2 [MAP2]) were then immuno-detected after a permeabilization step (1-min incubation in 10% Triton X-100 for Nav1 labeling or 0.066% saponin and 0.22% gelatin in phos-phate buffer) with rabbit polyclonal antibody to ankG (1:400–1,000; a gift from G. Alcaraz, Institut National de la Santé et de la Recherche Médicale, Marseille, France), mouse antibody to sodium channel (panNav; 1:100; Sigma-Aldrich), rabbit polyclonal antibody to NF-186 (1:200; a gift from V. Bennett), and chicken polyclonal antibody to MAP2 (1:10,000; Abcam). Corresponding secondary antibodies conjugated to Alexa Fluor 488, 546, and 633 were incubated for 45 min (dilution from 1:400 to 1:800; Invitrogen). Coverslips were mounted in Fluor Save reagent (EMD). Confocal microscopy and quantification
Cells were imaged using a confocal microscope (TCS-SPE or TSC-SP2; LCS or LAS-AF software; Leica). Confocal images were acquired with 40×/ 1.25 NA and 63×/1.40 NA oil objectives (Leica) at ambient temperature.