HAL Id: hal-01888670
https://hal-univ-rennes1.archives-ouvertes.fr/hal-01888670
Submitted on 13 Dec 2018
HAL is a multi-disciplinary open access
archive for the deposit and dissemination of
sci-entific research documents, whether they are
pub-lished or not. The documents may come from
teaching and research institutions in France or
abroad, or from public or private research centers.
L’archive ouverte pluridisciplinaire HAL, est
destinée au dépôt et à la diffusion de documents
scientifiques de niveau recherche, publiés ou non,
émanant des établissements d’enseignement et de
recherche français ou étrangers, des laboratoires
publics ou privés.
Distributed under a Creative Commons Attribution| 4.0 International License
long non-coding RNAs
Celine Le Beguec, Valentin Wucher, Laetitia Lagoutte, Edouard Cadieul,
Nadine Botherel, Benoit Hedan, Clotilde de Brito, Anne-Sophie Guillory,
Catherine André, Thomas Derrien, et al.
To cite this version:
Celine Le Beguec, Valentin Wucher, Laetitia Lagoutte, Edouard Cadieul, Nadine Botherel, et al..
Characterisation and functional predictions of canine long non-coding RNAs. Scientific Reports,
Nature Publishing Group, 2018, 8 (1), pp.13444. �10.1038/s41598-018-31770-2�. �hal-01888670�
Characterisation and functional
predictions of canine long
non-coding RNAs
Céline Le Béguec
1, Valentin Wucher
1,2,3, Lætitia Lagoutte
1,4, Edouard Cadieu
1,
Nadine Botherel
1, Benoît Hédan
1, Clotilde De Brito
1, Anne-Sophie Guillory
1,
Catherine André
1, Thomas Derrien
1& Christophe Hitte
1Long non-coding RNAs (lncRNAs) are a family of heterogeneous RNAs that play major roles in multiple biological processes. We recently identified an extended repertoire of more than 10,000 lncRNAs of the domestic dog however, predicting their biological functionality remains challenging. In this study, we have characterised the expression profiles of 10,444 canine lncRNAs in 26 distinct tissue types, representing various anatomical systems. We showed that lncRNA expressions are mainly clustered by tissue type and we highlighted that 44% of canine lncRNAs are expressed in a tissue-specific manner. We further demonstrated that tissue-specificity correlates with specific families of canine transposable elements. In addition, we identified more than 900 conserved dog-human lncRNAs for which we show their overall reproducible expression patterns between dog and human through comparative transcriptomics. Finally, co-expression analyses of lncRNA and neighbouring protein-coding genes identified more than 3,400 canine lncRNAs, suggesting that functional roles of these lncRNAs act as regulatory elements. Altogether, this genomic and transcriptomic integrative study of lncRNAs constitutes a major resource to investigate genotype to phenotype relationships and biomedical research in the dog species.
With the advancement of high-throughput sequencing technologies, transcriptome analyses (RNA-seq) have made it possible to identify major RNA classes, including the long non-coding RNA class (lncRNA)1,2. The tran-scriptome thus corresponds to sets of transcribed RNA molecules, with or without the ability to code for proteins, for a given time, condition or tissue3. Arbitrarily defined according to a size criterion (generally greater than 200 nucleotides), lncRNAs possess similar characteristics than RNAs encoding proteins (mRNAs), i.e. they can be spliced and have (or not) a polyadenylation tail, but they are differentiated by a lack of a functional open reading frame. Following the sequencing of all the RNA transcripts, the annotation and classification of the different RNAs consist of reconstructed transcript models, from which it is crucial to define their functional roles. LncRNAs can be located either in intergenic regions (lincRNAs), often close to protein-coding genes, or overlapping the oppo-site strand of mRNAs (antisense). Antisense transcription has been showed to ease a more fine-tuned regulation of gene expression, usually of the mRNA located in sense to the antisense element4,5. Both, lincRNAs and anti-senses, represent strong candidate sequences that modulate transcription of nearby protein-coding genes.
The domestic dog has emerged as a relevant model for studying the genetic basis of numerous traits, including Mendelian and complex diseases, morphology, physiology and behaviour6. Genomic resources have expanded our understanding of the canine genome but exhaustive annotation of functional elements, including long non-coding RNAs, remains necessary to facilitate the identification of genotype-phenotype relationships7. Most recently, the number and types of canine lncRNAs have increased considerably8,9, however, little is known about their function and biological roles. To our knowledge, a few canine lncRNAs have been characterised experimentally, as illustrated by the lincRNA close to the BAIAP2 gene linked to podocyte migration8 and the lncRNA GDNF-AS involved in a Hereditary Sensory Autonomic Neuropathy (HSAN) in hunting dogs10. As in other species, it is expected that lncRNAs in the dog genome are expressed at a lower level and display higher
1Univ Rennes, CNRS, IGDR (Institut de génétique et développement de Rennes) - UMR 6290, F-35000, Rennes,
France. 2Present address: Centre for Genomic Regulation (CRG), The Barcelona Institute of Science and Technology,
Dr. Aiguader 88, Barcelona, 08003, Spain. 3Present address: Universitat Pompeu Fabra (UPF), Barcelona, Spain. 4Present address: UMR PEGASE, Agrocampus Ouest, INRA, 35042, Rennes, France. Correspondence and requests
for materials should be addressed to T.D. (email: [email protected]) or C.H. (email: [email protected]) Received: 27 April 2018
Accepted: 24 August 2018 Published: xx xx xxxx
tissue-specificity than protein-coding genes. Also, because lncRNAs are subjected to rapid sequence turnover during evolutionary processes, they are seldom conserved in vertebrates11. In addition, lncRNAs are also known to regulate the expression of protein-coding genes through cis-acting or trans-acting regulation mechanisms. LncRNAs located near to and overlapping protein-coding genes have attracted particular attention from research-ers and several studies in humans and mice have uncovered several mechanisms, including cis-regulation of the expression of their protein-coding neighbour and overlapping partners12.
Knowledge of the biological functions of lncRNAs is continuously increasing, but their origin and evolution are still poorly understood. One recent hypothesis that has emerged concerns the theory that transposable ele-ment (TE) sequences are a possible source of non-coding exons13,14. In humans and mice, TEs are frequently found in lncRNAs15 and numerous studies emphasise the importance of TEs in the regulation of gene expression (for a recent review see Chuong et al.16). In dogs, TEs also occupy a substantial fraction (40%) of the genome and might be important actors in the origin of functional novelties. More particularly, a well-studied family of TE is the specific TEs (SINEC_Cf)17,18, that have been implicated in many dog genetic diseases19,20 or phenotypic differences between dog breeds21,22.
In this study, we performed an exhaustive analysis of 10,444 canine lncRNA genes for which we describe the overall transcriptional profiles across 26 distinct tissue types, representing various anatomical systems. Analysis of their expression patterns retrieved relevant relationship between tissue types and showed evidence of tissue-specificity for a large fraction of lncRNAs. Co-expression analysis of lncRNAs and nearby protein-coding genes was performed to infer putative functionality of uncharacterised lncRNAs using the principle of ‘guilt by association’23 from their co-expression with genes of known functions. Together, we provide a large and unique resource that characterises the transcriptional patterns of lncRNAs, improves the knowledge of the origins of canine lncRNAs and contributes to infer their potential functionality.
Results
Landscape of canine lncRNA transcription.
We produced 16 RNA-seq in a previous study9 consolidated by 10 RNA-seq published data8, corresponding to a total of 26 stranded RNA-seq data to represent a panel of diverse canine anatomical systems (Supplementary Table S1). We applied a state-of-the-art RNA-seq bioinfor-matics pipeline24 to assess gene expression levels for both canine lncRNAs and mRNAs (see the Methods sec-tion). For lncRNAs, we used the FEELnc-based classification9 based on the international gold-standard lncRNA classification given by the GENCODE consortium25 to differentiate long intergenic non-coding RNAs (lincR-NAs, n = 5,651) from antisense lncRNAs that have overlapping protein-coding genes in antisense (n = 4,793). We determined that a total of 7,763 (74.3%) lncRNAs are expressed in at least one tissue with a normalised count26 TPM > 1 where TPM = Transcripts Per Million and 9,542 (91.4%) with a TPM > 0.1. By comparing their respective expression levels with protein-coding genes mRNAs, canine lncRNAs have, on average, 20 times lower expression levels (Wilcoxon test, p-value < 2.2e-16) for all tissues, with the notable exception of the testis tissue forwhich the difference is 6 times less pronounced, a trend also showed in other species2,27 (Fig. 1a). We then com-pared the expression of lncRNAs in various tissue types and found that, as expected, the mean expression level in testis tissue is much higher (TPM = 7.02) than in any other tissue (ranging from 0.11 for the pancreas tissue to 1.60 for the hair follicle tissue and with an average TPM = 1.05) (Fig. 1a). By comparing lincRNA versus antisense expression patterns (Supplementary Fig. S1), we observed that lincRNAs have a lower expression than antisense, except for testis tissue (Wilcoxon test, p-value < 2.2e-16).
Taking advantage of the variety of samples, we analysed whether canine lncRNAs displayed patterns of tissue-specific expressions by calculating a tissue-specific score ‘tau’28. This score, ranging from 0 to 1 (with tau = 0 being broadly expressed and tau = 1 being a highly tissue-specific expression), has been shown to be highly robust when evaluating tissue-specific genes29. Using a stringent threshold ≥0.95, a total of 44% of lncR-NAs (n = 4,599, Supplementary Table S2) displayed a clear pattern of tissue-specificity, highlighting the potential specialised functionality and distinct spatial pattern of expression in the corresponding tissue. In comparison, only 17% of mRNAs (n = 3,635) showed a pattern of tissue-specificity reflecting that, as in other species, canine lncRNAs are more tissue-specific than mRNAs30. Among all classes of lncRNAs, we observed that lincRNAs are more tissue-specific (68.6%) when compared to antisense (31.4%) (Chi-square test, p-value < 2.2e-16). As
shown in humans, the canine testis tissue is particularly enriched in tissue-specific lncRNAs1,2 (n = 3,001). This highlights the singularity of this tissue, probably due to the presence of many cell types, the state of its chro-matin and the binding of specific transcription factors31. Excluding testis tissue, we identified an average of 63 lncRNAs expressed specifically by tissue. In order to assess the relative enrichment of tissue-specific lncRNAs versus tissue-specific mRNAs, we measured the proportion of tissue-specific genes amongst the total number of expressed genes (Fig. 1b). As an example, this highlighted that 20% of lncRNAs expressed in liver tissue are liver-specific, compared to only 2% of mRNAs.
Given that tissue-specificity can be influenced by cells with common origins, we then investigated the tissue-specificity within tissues related to the nervous system including brain, cerebellum, cortex, olfactory bulb and spinal cord. We found specific expression patterns for 260 lncRNAs in the different samples of the nerv-ous system32. Among the nervous system samples, we identified 156 lncRNAs specifically expressed in the cer-ebellum, 60 in the cortex and 44 in the olfactory-bulb (Supplementary Table S2); (tau threshold ≥0.95). These lncRNAs were characterised by a higher expression level (mean TPM = 3.30) in comparison to other tissues (mean TPM = 0.12). For example, we found a cerebellum-specific lincRNA (tau = 0.96), annotated in humans as
CASC18, with a role in neural cell differentiation33.
Although we identified a large number of tissue-specific lncRNAs, we then clustered the 26 tissue samples based on their lncRNA expression profiles in order to detect groups of lncRNAs that exhibit common expression patterns. The heatmap in Fig. 1c highlights that clustering the lncRNAs’ expression data recovers biologically meaningful relationships between tissue types. This analysis defined two main clusters with more than 3 samples,
which grouped nervous system tissues (n = 5) and integumental system tissues (n = 6) and supported the fact that some lncRNAs shared expression patterns in multiple tissues. This analysis was repeated using only mRNA expressions and showed similar clusters (Supplementary Fig. S2). Complementary to the previous tissue-specific analysis, this clustering approach allowed us to identify an lncRNA (RLOC_00033166) expressed in all nervous system tissues with a mean TPM = 7.89 but not detected in any other tissues. Interestingly, this lncRNA is tran-scribed in antisense orientation to the Neuregulin 3 gene (NRG3), which is involved in neuroblast cell differenti-ation34 and thus represents a potential candidate for its regulation. Another lncRNA (RLOC_00020746) is almost only expressed in the musculoskeletal system cluster (heart and muscle) and is expressed in antisense to the Popeye Domain Containing 3 gene (POPDC3), which may play an important role in the development of skeletal muscle and heart tissues35. Apart from the clustered groups of tissues identified in the analysis, most samples, and particularly the testis sample, remained strongly unrelated to any other tissues.
Tissue-specific expression of lncRNAs correlates with their transposable element content.
TEs are thought to constitute part of the active lncRNA regions13 and may drive the specific expression patterns observed for lncRNAs16. Interestingly, in dogs, a canine-specific SINE repeat family (SINEC_Cf) has been shown to provide many polymorphic site insertions17 and is also associated with multiple disease phenotypes16,18. To gain insights into the relationships between canine lncRNAs and transposable elements, we analysed the TE content of the 10,444 lncRNAs in the 4 major TE classes (DNA transposons, LTRs, LINEs and SINEs) as annotated by the RepeatMasker database36. We first showed that almost 70% of canine lncRNA transcripts contain at least one TE overlapping an lncRNA exon, a result in between human (83%) and mouse (66%) lncRNAs15. We then determined that ~20% of the cumulative exon sequences of lncRNAs are composed exclusively of TEs (Fig. 2a).
This proportion of lncRNA exonic TEs is less than that observed in the entire dog genome (37.7%) but is 2.5 times higher than for mRNAs exonic sequences (7.9%), highlighting the high prevalence of TEs in dog lncRNA exons as also observed in other species15. Compared to the genome-wide distribution of TEs, most TE families are under-represented in lncRNAs with the exception of LTR-ERVL retroviruses (Long Terminal Repeat-Endogenous RetroVirus-Like elements) (Supplementary Fig. S3), which are also significantly enriched in human lncRNAs15. In addition, we computed canonical correlations between TE content in both lncRNAs exons and promoters and lncRNA tissue expressions using the mixOmics program37 (see Methods). This analysis highlighted that lncRNA expression in the different tissues tends to be associated with high contents of SINEC_Cf specifically in lncRNA promoters (Fig. 2b), a pattern not seen for mRNAs (Supplementary Fig. S4). These results suggest that changes in the promoter sequences of lncRNAs by TE insertions and more particularly SINEC_Cf, might contribute to
Figure 1. (a) Comparative analysis of log10 transcription (TPM + 1) levels between mRNAs (red) and lncRNAs
(blue) genes in 26 canine tissues. (b) Proportions of tissue-specific lncRNAs (blue) and mRNAs (red) amongst expressed genes in each tissue with testis tissue represented in the separated panel (top right). (c) Hierarchical clustering of 26 tissues based on Spearman correlations measured from lncRNA expression data.
the specific spatial expression of canine lncRNAs. The analysis also pinpoints that exons of lncRNAs expressed in testis are particularly depleted in SINEC_Cf, suggesting that testis-specific expression of canine lncRNAs is more likely associated with other family of TEs such as LTR (Fig. 2b) and probably LTR-ERVL (Supplementary Fig. S3) as recently highlighted in mouse germline38.
Identification of dog-human conserved lncRNAs by comparative genomics.
DNA conservationamong divergent species is a widely used indicator to infer functionality and to suggest conserved functions. Identifying orthologous lncRNA relationships is challenging since lncRNAs are more likely to be gained or lost during evolution11 than constrained sequences as protein-coding genes. Therefore, we used a positional compar-ative genomics approach, parameterised at the synteny level, to predict putcompar-ative lncRNA orthologues between dog and human using the EnsEMBL Compara database39 (see Methods). Using this strategy, we mapped the positions of canine lncRNAs onto the human genome and identified 939 lncRNAs (9.0%) with 1:1 human non-coding orthologues from the GENCODE database25 which can be separated into 560 lincRNAs (9.9% of the total num-ber of lincRNAs in dogs) and 379 antisense (7.9% of the total numnum-ber of antisense in dogs) (Figs 3 and S5). We found that lncRNA orthologues that were part of a synteny block shared similar gene structures, with a mean number of exons per gene of 3.6 and 3.1 for humans and dogs, respectively (Supplementary Table S3). Based on the GENCODE annotation of the conserved dog-human lncRNAs, we were able to confirm the annotation of the well-studied HOTAIRM40, MALAT41, NEAT_142 and PCA343 in dogs and to infer novel canine orthologous rela-tionships such as the CASC family of lncRNAs (CASC15, CASC17, CASC18 and CASC20) and INHBA-AS144 or
MEG945. Complementary to this synteny-based strategy, we evaluated the selective constraints acting on canine lncRNAs and mRNAs by using the Genomic Evolutionary Rate Profiling (GERP) scores46 (see Methods). In com-parison to mRNAs, we showed that the 939 syntenically conserved lncRNAs are significantly less constrained than syntenic mRNAs (Wilcoxon test, p-value = 9.54e-171). In addition, this allowed us to pinpoint that syntenically
conserved lncRNAs tend to be more constrained (mean GERP = 0.221) than non-syntenic lncRNAs (median GERP = 0.195), although not statistically significant (Wilcoxon test, one-tailed p-value = 0.19). Altogether, this is in agreement with other studies that have reported a lower purifying selection acting on lncRNAs47.
Analysis of transcriptional profiles of conserved lncRNAs through comparative
transcriptom-ics.
As sequence conservation is not an infallible indicator of functionality, we integrated the expression pat-terns of orthologous genes in our analysis. It has now been reported that orthologous genes may have conserved or variable expression profiles between species such as in human and mouse48. To investigate the expression pat-terns of orthologous lncRNAs between dogs and humans, we determined the correlation of the level of expression between 11 human tissues from the ENCODE project49 that matched the dog tissues. We produced bar charts (Fig. 4) to represent the expression levels of each conserved lncRNA in the 11 different samples of both species and these allowed us to visualise and compare expression patterns of orthologous lncRNAs between dogs and humans (Supplementary Fig. S6). Overall, of the 727 conserved lncRNAs with expression in at least one tissue on both species, mean lncRNA expression patterns correlate well between dog and human meaning that whenFigure 2. (a) Proportion of transposable elements (LINEs, SINEs, LTRs and DNA transposon in green, purple,
orange and yellow respectively) with respect to the entire dog genome, lncRNA exons and mRNA exons (from left to right). (b) Canonical correlations between lncRNAs’ expression in the 26 tissues (column) and TE families in exons and promoters (row).
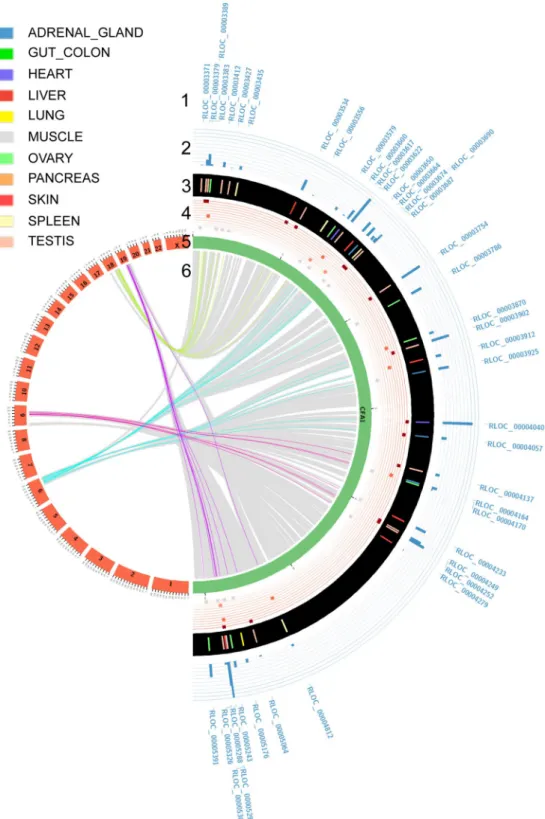
Figure 3. The Circos plot provides the visualisation of dog-human orthologous relationships of lncRNAs and
their comparative transcriptomic-based expression patterns. Here, we provide plot for canine chromosome 1 the largest chromosome which allows to summarize the most amount of information. Tracks are described from the outside to the inside. Track1: Labels of canine lncRNAs identified with human orthologues are described at the most outside track of the figure. Track2: Level of expression of canine lncRNAs is shown by the blue histogram. Track3: The tissue in which lncRNA is expressed in dogs. The 11 tissues are adrenal gland, gut-colon, heart, liver, lung, muscle, ovary, pancreas, skin, spleen and testis and are represented with the colour code as shown in the legend. Track4: Expression of the human orthologous lncRNA is represented. 11 lines are reported. When the human orthologue lncRNA is expressed in the same tissue and with the highest of expression, it is represented by a dark red square on the upper line. When an orthologous human lncRNA is expressed in the same tissue, with the second maximum of abundance, it is represented on the second line in lighter red. When an orthologous human lncRNA is not expressed in the same tissue, it is represented by a grey square. Track5:
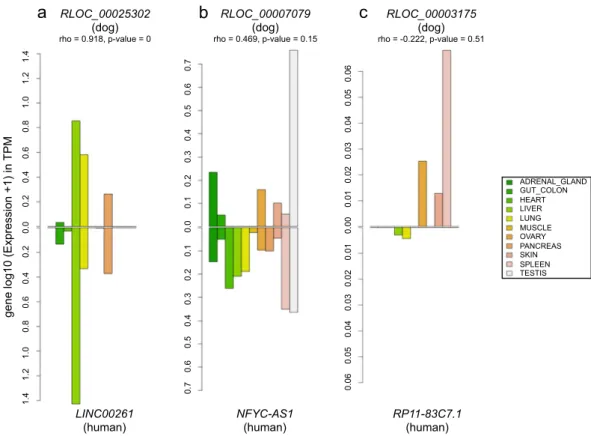
a canine lncRNA is expressed, its human orthologue is also transcribed in the same human tissues with the same orders of magnitude (mean correlation rho = 0.39). Among these general tendencies, we could identify a subset of 26% of dog-human orthologous lncRNAs (n = 192) with expression patterns significantly correlated (p-value < 0.05; mean rho = 0.87), suggesting that these lncRNAs might be involved in evolutionary conserved functions. In addition, these lncRNAs are highly tissue-specific (average tau = 0.94 and 0.93 for dogs and humans, respectively), a finding already reported between human and mouse where tissue-specific lncRNAs in one spe-cies are also tissue-specific in other48. These evolutionary and transcriptionally conserved lncRNAs are mostly expressed in testis (n = 154) then spleen (13), lung (9), liver (8), skin (5), and heart (4) (Fig. 4a). Anatomical systems such as the brain, testis, heart, liver and kidney were previously found to have clearly distinct signa-tures of tissue-specific genes in humans and mice48 and showed strong conservation between the two species. Here, as an example, the lncRNA TRDN-AS1, transcribed in the opposite strand of the Triadin gene (TRDN), is found specifically expressed in the heart tissue in both human and dog species. Another example is given by the
LINC01698 gene which exhibits a shared expression pattern between dog and human in the skin, as described
using GTEx data portal50. We also defined lncRNAs (n = 77) with intermediate correlation pattern (p-value < 0.2; mean rho = 0.50), which display a more tissue-variable expression between species (Fig. 4b). This subset shows that sequence constraints do not imply an exact conserved expression and that different factors in the two spe-cies may act on the expression of the same gene, modulating its expression level. A third subset of lncRNAs (n = 458) was defined with divergent transcriptional pattern (p-value > 0.2; mean rho = 0.17) between the two species (Fig. 4c). This subset may indicates expressed lncRNAs in anatomical systems with complex structures composed of many primary cell types, for which tissue functionality may differ between samples and/or between species because of their substructure.
LncRNA:mRNA co-expression and correlation analysis.
In many species, lncRNAs have beeninvolved in regulating gene expression by coordinating epigenetic, transcriptional or post-transcriptional pro-cesses51. Co-expression pattern analyses provide a means to investigate sequences that modulate the transcription of nearby genes. In addition, regulatory sequences are often located near to their target gene, modulating their transcription. Hence, identifying correlated expressed sets of protein-coding and non-coding loci provides a way to (i) identify relationships between lncRNAs and mRNAs and (ii) infer potential regulatory functionality of lncRNAs.
Here, we searched for significant co-expression, computed through statistical correlations between lncRNAs and their neighbouring protein-coding genes. We used the ‘guilt-by-association’23 strategy to functionally anno-tate the lncRNA co-expressed with its mRNA neighbour, especially in the case of divergent transcripts sharing bidirectional promoters52. We retained neighbouring protein-coding genes transcribed in divergent and con-vergent orientations (excluding same strand) with respect to the lncRNA in order not to bias the correlation analysis with lncRNA being actually unannotated UTRs of the neighbour protein-coding genes. On average, these canine lncRNAs are located at 25 kb of the closest protein-coding genes. We identified more than 126,000 lncRNA:mRNA pairs within a 1 Mb window using the FEELnc classifier module9. We then divided pairs into two classes consisting of antisense:mRNA pairs, defined by lncRNAs overlapping mRNAs transcribed in antisense (n = 3,401) and lincRNA:mRNA pairs defined by intergenic lncRNAs located at less than 1 Mb of an mRNA (n = 123,456). Using the expression data from the 26 tissues, we computed expression correlations and mined the resulting pairs. We found 8,139 significant correlations (| rho | > 0.5 and p.adjust BH53 < 0.05) consisting of 7,615 lincRNA:mRNA and 524 antisense:mRNA pairs for a total of 3,410 distinct lncRNAs. These results revealed co-expressed pairs that may predict regulatory relationships. Among significant correlations, only 58 pairs were found with a significant negative correlation coefficient (rho <−0.5). The lncRNA co-expressed in these pairs are significantly more distant to their mRNAs (mean distance = 471 kb) compared to the ones in the positive correlations (mean distance = 394 kb) (Wilcoxon test, one-tailed p-value = 0.02), indicating that they may be located in different genomic regions. An interesting example of positive correlation is given by the lincRNA
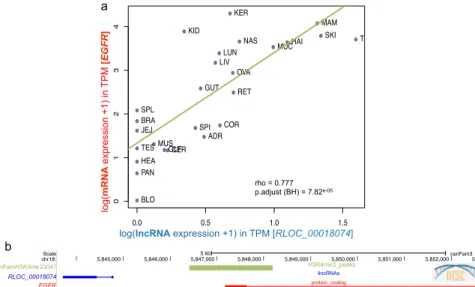
RLOC_00018074 co-expressed with the mRNA EGFR (Epidermal Growth Factor Reception) in the 26 tissues
(Fig. 5a). RLOC_00018074 and EGFR genes are transcribed in a divergent orientation and, by using published data which mapped dog promoters from H3K4me3 marks54 (Fig. 5b), we could hypothesise that this pair share a bi-directional promoter thus reinforcing the validity of our functional inference.
Of the 3,410 distinct lncRNAs, we observed multiples type of co-expression patterns. A subset of 1,691 (49.6%) lncRNAs have two or more mRNAs significantly co-expressed for which more than 800 (55%) displayed a higher correlation with the second nearest protein-coding gene or greater (Supplementary Fig. S7). It shows the importance of identifying co-expression patterns for establishing accurate lncRNA:mRNA pairs that may interact. In addition, the strength of the correlation decreases with the distance between the two elements of the pair, as we computed with a Spearman correlation analysis (Supplementary Fig. S8). Indeed, highly co-expressed gene pairs (0.9 < | rho | ≤ 1) are closer (average = 89 kb) than less correlated co-expressed gene pairs (0.5 < | rho | < 0.7; average = 411 kb).
Finally, we performed a gene ontology (GO) term enrichment analysis in order to predict potential lncRNA functions. Based on the human orthologous mRNAs (n = 3,977) with which the lncRNAs are co-expressed, we focused our GO analysis on the Biological Process (see Method). A total of 22 GO terms were signifi-cantly enriched (adjusted p-value < 0.05) and correspond to developmental processes such as ‘sensory organ The green layout depicts the canine chromosome, the red layout represents the human chromosomes. Track6: For the innermost part, coloured lines link the dog-human orthologous relationships of lncRNAs. Grey lines represent the orthologous relationships of protein-coding genes.
development’ (GO: 0007423, 147 genes), ‘axon development’ (GO: 0061564, 129 genes) or ‘hindbrain develop-ment’ (GO: 0030902, 49 genes) (Supplementary Table S4). These 22 GO terms included 913 unique mRNAs co-expressed with their corresponding canine lncRNA (26.8%). These results predict a functional assignment for these 913 canine lncRNAs which represent interesting candidates for studies related to the enriched biological processes.
Discussion
Transcriptomic studies have emphasised the analysis of long non-coding transcripts using expression profiles to characterise the patterns and their potential functional roles. LncRNAs tend to be expressed at lower levels than protein-coding genes, being under less stringent evolutionary constraints, and are preferentially enriched in reg-ulatory functions. Here, we realised a global analysis of long non-coding RNA expression across multiple tissues to aid genome annotation and improve functional annotation of the dog genome. By using strand-specific RNA sequencing of 26 tissues, we profiled the expression patterns of lncRNAs and achieved a detectable expression for 91% of lncRNA in at least one tissue, which constitutes the largest resource of long non-coding RNA expression data sets in dogs. We showed the higher tissue-specificity pattern of lncRNAs relative to mRNAs, and this suggests specialised functions in the development, differentiation and physiological processes of tissues. As also observed in other species, the largest number of tissue-specific lncRNAs was shown to be in the testis, a result that can be related to the pervasive transcription during spermatogenesis process and due to chromatin remodelling55.
There is growing evidence showing a close association of transposable elements (TEs) with non-coding RNAs. Thousands of long intergenic non-coding RNAs are associated with endogenous retrovirus LTR TEs in human cells13. Exhaustive characterisations of the links between lncRNAs and TEs are becoming fundamental as diseases and phenotypic traits are increasingly found to have a TE and/or lncRNA etiology13,16. Because of the absence of open reading frame and thus amino acids constraints, lncRNAs sequences are more tolerant to TE insertions, and some authors hypothesized that repeat sequences into lncRNAs are the functional domains of these elements13. In addition, numerous examples of TE insertions having constructive effects because of their inherent ability to bind to RNAPII and provide cis-regulatory activities16.
Here, we have shown a strong association of the SINEC_Cf TE family with lncRNAs in dogs. The SINEC_Cf family have the capacity to spread in the genome17 by the mean to insert additional copies of themselves and, therefore, may be able to introduce sequences with regulatory roles into lncRNAs or their promoter sequences upon insertion, and might contribute to the spatial expression of canine lncRNAs. These results provide the first evidence for discovering how and which TE families represent a major force in shaping the canine lncRNA expression and their tissue-specificity expression patterns in a lineage-specific fashion.
Despite the number of tissues investigated in this study (n = 26), tissue-specificity is a limiting factor in annotating the whole repertoire of lncRNAs of a species, since their annotation depends on the availability of
b
c
1.4 1.2 1.0 0.8 0.6 0.4 0.2 0.0 0.2 0.4 0.6 0.8 1.0 1.2 1.4 0.7 0.6 0.5 0.4 0.3 0.2 0.1 0.0 0.1 0.2 0.3 0.4 0.5 0.6 0.7 0.06 0.05 0.04 0.03 0.02 0.01 0.00 0.01 0.02 0.03 0.04 0.05 0.06a
RLOC_00025302 (dog) rho = 0.918, p-value = 0 RLOC_00007079 (dog) rho = 0.469, p-value = 0.15 RLOC_00003175 (dog) rho = -0.222, p-value = 0.51 LINC00261(human) NFYC-AS1 (human) RP11-83C7.1 (human)
ADRENAL_GLAND GUT_COLON HEART LIVER LUNG MUSCLE OVARY PANCREAS SKIN SPLEEN TESTIS
gene log10 (Expression +1) in
TPM
Figure 4. Bar charts representing the expression of the 3 lncRNAs in 11 matched dog-human tissues. (a) High
numerous tissue and cell types as well as tissue subtypes and multiple spatio-temporal conditions. Additional tis-sues and subtypes and development stages must be continuously collected through large databases as we do with the Cani-DNA French database (https://dog-genetics.genouest.org/en/brc-cani-dna/) in order to provide addi-tional anatomical subtype data for identifying an extended catalogue of lncRNAs and their isoforms. Until now, most expression studies have been performed on a population level usually averaging the transcriptomes of mil-lions of cells56. Pioneering RNA-seq of single cells has provided the characterisation of transcriptional differences of both coding and non-coding RNAs on a genome-wide scale57. The single-cell RNA-seq approach (scRNA-seq), a relatively recent experimental approach, in contrast to bulk RNA-seq sequencing, is a new technology, for which the main strength is the ability to measure the distribution of expression levels for each gene across a population of cells. These data make it possible to study questions for which transcriptome-specific modifications are impor-tant, such as the identification of the cell type, the heterogeneity of cellular responses, the stochasticity of gene expression, or the definition of gene regulatory networks through the cells. In particular, the use of scRNA-seq would make it possible to individually sequence all the cells making up the cycle of spermatogenesis and to iden-tify more precisely certain phenomena that bind to one or the other of the steps. Or in the case of tissues with high heterogeneity and complexity, scRNA-seq will be able to detect and characterise the expression patterns of com-plex tissues, in order to provide high-resolution identification of cell types and markers and to identify splicing patterns and allelic random expressions that are variable between cells. ScRNA-seq will help in-depth, functional characterisation and gene expression variation derived from different genetic backgrounds at the cell resolution.
Co-expression analyses rely on similarities in gene expression and are widely used for the functional annota-tion of unknown genes using the principle of ‘guilt-by-associaannota-tion’23. Focusing on neighbouring genes, we tested the expression correlation of lncRNA:protein-coding pairs and observed that thousands of lncRNA-coding pairs showed an overall positive correlation, suggesting coordinated transcription and, by implication, a shared func-tion or pathway. Whilst constructing co-expression networks is rather straightforward, the resulting network of connected lncRNA:mRNA do not provide information on the nature of the regulatory relationship of the con-nected genes, which limits its biological interpretation.
Next-generation sequencing technologies have considerably advanced the field of comparative genomics and comparative transcriptomics. These approaches are particularly important for studying the evolution of gene regulation in model organisms, investigating the level of the lncRNA sequence and expression conservation with humans and investigating the way that this conservation determines conditions in which the dog constitutes an appropriate model for diseases and phenotypic traits. Here, we identified more than 900 lncRNAs with a human orthologue and the analysis of the level and distribution of expression between dog and human, despite a low number of samples, allowed us to define conserved or diverged expression patterns that then served to predict putative, conserved functions or to pinpoint more subtle changes of functionality. A previous comparative tran-scriptomic analysis between human and others species, was also able to define conserved or diverged expression patterns using only 6 common tissues58. Much comparative data still needs to be produced and analysed concern-ing transcriptional changes associated with differentiation and development or with cellular responses to external stimuli.
In this study, we functionally annotate more than 900 canine lncRNAs with the enriched functions among the protein-coding gene sets of distinct GO functional categories that are co-expressed with each lncRNA. While this GO analysis revealed numerous lncRNAs associated with diverse biological processes, a part of the enriched functions have been validated by published studies59,60.
Figure 5. (a) Correlation plot of the lncRNA:mRNA pair (RLOC_000018074:EGFR) in the 26 tissues. (b)
UCSC screenshot representing the genomic localisation of the RLOC_000018074:EGFR pair transcribed in a divergent orientation with the promoter mark (H3K4me3) from published data.
In addition, future functional studies will be important to investigate roles of lncRNAs by current approaches of loss- and gain-of-function biological experiments61,62. Consequently, there is a need for large-scale, system-atic approaches to analyse the functional contribution of lncRNAs using genome-scale CRISPR interference (CRISPRi). In a recent study, Liu et al.63 developed genome-scale CRISPRi approach which targets 16,401 lncRNA genes each with 10 sgRNAs per transcription start site for identifying functional human lncRNA.
The dog is a promising model for complex phenotypes, genetic diseases and clinical studies. Altogether, this genomic and transcriptomic integrative study of lncRNAs constitutes a major resource for the dog species.
Materials and Methods
Datasets.
The 26 RNA-seq sample dataset (Supplementary Table S1) represents a wide variety of canine cell-types and tissue-cell-types. The 26 tissues can be classified by Anatomical System as inspired by the Expression Atlas database (https://www.ebi.ac.uk/gxa/home/), as shown in the Supplementary Table S1. Two tissues correspond to ‘Digestive system’, 6 tissues to ‘Integumental system’, 2 tissues to ‘Musculoskeletal system’ and 5 tissues to ‘Nervous system’. The others tissues correspond to ‘Unmapped’ and ‘Testis’.RNA extraction and directional sequencing were performed as described in Wucher et al.9 and Hoeppner
et al.8 and are available through accession numbers SRP077559, SRX111061 - SRX111071, and SRX146606 - SRX146608.
The canine ‘canFam3.1-plus’ annotation9 (containing 10,444 lncRNA and 21,810 protein-coding genes (mRNAs)) was used as the reference annotation for this study and the canFam3 assembly version was the refer-ence genome.
Quantification of mRNAs and lncRNAs expressions.
Based on the bio-informatic protocol described in Djebali et al.24, FASTQ reads were aligned on the canine reference genome and transcriptome using the STAR64 program (version 2.5.0a) and we determined the gene and isoform expression levels for both lncRNAs and mRNAs for each of the 26 RNA-seq with RSEM26 (version1.2.25). Finally, the RSEM output files were parsed in order to extract gene expression level, normalised in Transcripts Per Million (TPM) and merged to obtain one matrix expression file with gene names in rows and tissue expression levels (TPMs) in columns.Characterisation of lncRNA expression.
Tissue-specificity. To calculate the tissue-specificity score‘tau’28, ranging from 0 to 1 (with tau = 1 for highly tissue-specific genes and tau = 0 for broadly expressed genes), we used the matrix file described above and calculated the following equation28:
^ ^ τ = ∑ − − = = ≤ ≤ i x (1 X ) n 1 ; X X max ( ) i 1 n i i 1 i n i
where n corresponds to the number of tissues analysed and xi is the gene expression in the tissue i. The specificity
score was calculated using a threshold of 1 TPM (to be stringent).
To extract a stringent set of tissue-specific genes, we used a tau threshold greater than 0.95 corresponding to a ratio of 4 between the first and the second tissue (e.g. max(xi)/max2nd(xi) > 4) or, in others words, corresponding
to cases where gene i is four times more expressed in the first tissue compared to the second most highly expressed tissue. Note that we provide a perl script dedicated to computing the ‘tau’ score on GitHub available here:
https://github.com/tderrien/IGDR/blob/master/script/specificity_score.pl.
Finally, the ‘tau score’ together with eight others metrics dedicated to computing tissue-specificity were recently benchmarked in Kryuchkova-Mostacci et al.29, and the authors concluded that “the best overall method to measure expression specificity appears to be Tau” because it consistently appears to be the most robust method for retrieving tissue-specific genes.
Heatmap and clustering analysis. For each biotype (lncRNAs and mRNAs), we computed all pair-wise Spearman
correlations between the 26 tissues in order to obtain a matrix of distance. Using this file, together with a meta-data file containing anatomical system classification (e.g. nervous system, integumental system, musculoskeletal sys-tem, digestive syssys-tem, testis, and unmapped), the heatmap and the associated hierarchical ascendant cluster-ing (with default parameters: euclidean distance and method = ‘complete’) were created as in Breschi et al.48, using R software (version 3.2).
TE content. Canine TE annotations were based on the RepeatMasker36 database, downloaded from the UCSC table browser65 (September 2017). Four major classes were analysed: DNA transposons and retrotransposons, LTRs, LINEs and SINEs; each of them being divided into families (e.g. SINEC_Cf). To compute the proportion of TEs per gene, exons of each gene were projected onto the genome and the number of exon-projected nucleotides overlapping TE families was computed using the bedtools program (version 2.19.0) on bed12 input files with the -wao and -split options. For gene promoters, the same process was repeated using 5 kb upstream of each gene starts.
TE content and gene expression. The mixOmics tool37 (version 6.3.1) was used to compute canonical correlations to highlight potential correlations between two matrices X and Y, where X is the matrix of lncRNA (or mRNA) expressions in the 26 tissues and Y is the matrix of TE content in lncRNAs (or mRNAs) exons and promoters. The rcc function of the mixOmics package (with method = ‘ridge’ and ncomp = 3) was used to seek for linear
combinations of the variables (canonical variables) to reduce the dimension of the datasets. The heatmap was constructed with the mixOmics function cim (Clustered Image Maps) with default values, except ncomp = 3.
Comparative genomics and transcriptomics.
Comparative genomics. To identify conserved caninelncRNAs and mRNAs in humans, we used the Ensembl Compara database39. Briefly, the program annotates ort-hologous regions between two or more species based on Whole Genome Alignments (WGA) computed using the EPO (Enredo-Pecan-Ortheus) pipeline39. All canine gene coordinates were then mapped onto the human genome (version: GRCh37 using version 75, GENCODE version 19), having the same biotype (coding or non-coding) and considering only the one-to-one (1:1) relationships.
GERP score. We used the EnsEMBL Compara API to retrieve GERP scores46 of the dog genome assembly (can-Fam3) (one wig file per each dog chromosome) computed on the 53 eutheria mammals. To get a single value per lncRNA and mRNA gene, we projected all exons of each gene onto the dog genome and calculated the median GERP score for each gene.
Comparative transcriptomics with human ENCODE data. We extracted the human gene expression using data
produced by the ENCODE project49 (https://www.encodeproject.org/matrix/?type=Experiment&replicates. library.biosample.donor.organism.scientific_name=Homo+sapiens&biosample_type=tissue&assay_title=− total+RNA-seq&assembly=hg19&award.project=ENCODE). We only selected data where tissues between humans and dogs could be matched. We found 11 dog:human matching tissues: adrenal gland, gut-colon, heart, liver, lung, muscle, ovary, pancreas, skin, spleen and testis. From the available RSEM files, we extracted the expres-sion levels at the gene transcript levels in TPM for the dog data. When multiple RSEM files for a tissue replicates, we averaged the expression level per gene. We then determined the statistical correlation, with the Spearman correlation test, of the level and the distribution of the expression between these 11 human and dog tissues. Bar charts were created with R software to help visualise the comparison.
Comparative genomics and transcriptomic visualisation. We used the Circos tool (circus-0.69-6) to visualise
relationships of orthologous genes between dog and human. Circular layouts were constructed to allow global but meaningful figures with a Circos ideogram per dog chromosome.
Co-expression analysis.
Co-expression. To study the correlations of expression between lncRNAs andmRNAs, we used the FEELnc classifier module9 to annotate lncRNA classes and sub-classes (e.g. genic versus intergenic and divergent versus convergent, Supplementary Fig. S9) and to automatically identify all lncRNA:m-RNA pairs in a sliding window of 1 Mb around each lnclncRNA:m-RNA. For the sake of interpretability, we filtered subclasses so that they only retained exonic antisense, intergenic divergent and intergenic convergent. For all lncRNA:m-RNA pairs, we computed Spearman correlations between expression vectors (26 points) and corrected, associ-ated p-values for multiple testing using the Benjamini-Hochberg (BH) method53. To identify significant pairs in co-expression, we used a correlation coefficient of | rho | > 0.5 and p.adjust < 0.05.
GO term analysis. From the 5,711 canine mRNAs that were significantly co-expressed with their lncRNAs
(n = 3,410), we extracted human, orthologous EnsEMBL gene IDs of mRNAs (n = 3,977). To identify gene ontology (GO) terms significantly enriched in this list of gene IDs, we used the web-based GEne SeT AnaLysis Toolkit (WebGestalt66) software with the following settings: Method of Interest = ‘Overrepresentation Enrichment Analysis’ (ORA) and Functional Database class = geneontology (GO) named ‘Biological_Process_noRedundant’. Finally, we selected the Gene ID type ‘ensemble_gene_id’, to upload our orthologous data using ENSG IDs and selected genome for Reference Set for Enrichment Analysis. We can add ‘Advanced parameters’, so we keep default parameters (Minimum Number of Genes for a Category: 5; Maximum Number of Genes for a Category: 2000 and
Multiple Test Adjustment: BH) and use the Significant Level: FDR 0.05.
All data are available through the dedicated website:
http://dogs.genouest.org/lncRNA.html.
References
1. Cabili, M. N. et al. Integrative annotation of human large intergenic noncoding RNAs reveals global properties and specific subclasses. Genes Dev. 25, 1915–27 (2011).
2. Derrien, T. et al. The GENCODE v7 catalog of human long noncoding RNAs: analysis of their gene structure, evolution, and expression. Genome Res. 22, 1775–89 (2012).
3. Wang, Z., Gerstein, M. & Snyder, M. RNA-Seq: a revolutionary tool for transcriptomics. Nat. Rev. Genet. 10, 57–63 (2009). 4. Katayama, S. et al. Antisense transcription in the mammalian transcriptome. Science 309, 1564–6 (2005).
5. Schein, A., Zucchelli, S., Kauppinen, S., Gustincich, S. & Carninci, P. Identification of antisense long noncoding RNAs that function as SINEUPs in human cells. Sci. Rep. 6, 33605 (2016).
6. Karlsson, E. K. & Lindblad-Toh, K. Leader of the pack: gene mapping in dogs and other model organisms. Nat. Rev. Genet. 9, 713–25 (2008).
7. Andersson, L. et al. Coordinated international action to accelerate genome-to-phenome with FAANG, the Functional Annotation of Animal Genomes project. Genome Biol. 16, 57 (2015).
8. Hoeppner, M. P. et al. An improved canine genome and a comprehensive catalogue of coding genes and non-coding transcripts. PLoS One 9, e91172 (2014).
9. Wucher, V. et al. FEELnc: a tool for long non-coding RNA annotation and its application to the dog transcriptome. Nucleic Acids Res. 45, e57 (2017).
10. Plassais, J. et al. A Point Mutation in a lincRNA Upstream of GDNF Is Associated to a Canine Insensitivity to Pain: A Spontaneous Model for Human Sensory Neuropathies. PLoS Genet. 12, e1006482 (2016).
11. Ulitsky, I. Evolution to the rescue: using comparative genomics to understand long non-coding RNAs. Nat. Rev. Genet. 17, 601–14 (2016).
12. Signal, B., Gloss, B. S. & Dinger, M. E. Computational Approaches for Functional Prediction and Characterisation of Long Noncoding RNAs. Trends Genet. 32, 620–637 (2016).
13. Johnson, R. & Guigó, R. The RIDL hypothesis: transposable elements as functional domains of long noncoding RNAs. RNA 20, 959–76 (2014).
14. Kapusta, A. et al. Transposable elements are major contributors to the origin, diversification, and regulation of vertebrate long noncoding RNAs. PLoS Genet. 9, e1003470 (2013).
15. Kelley, D. & Rinn, J. Transposable elements reveal a stem cell-specific class of long noncoding RNAs. Genome Biol. 13, R107 (2012). 16. Chuong, E. B., Elde, N. C. & Feschotte, C. Regulatory activities of transposable elements: from conflicts to benefits. Nat. Rev. Genet.
18, 71–86 (2017).
17. Wang, W. & Kirkness, E. F. Short interspersed elements (SINEs) are a major source of canine genomic diversity. Genome Res. 15, 1798–808 (2005).
18. Minnick, M. F., Stillwell, L. C., Heineman, J. M. & Stiegler, G. L. A highly repetitive DNA sequence possibly unique to canids. Gene 110, 235–8 (1992).
19. Lin, L. et al. The sleep disorder canine narcolepsy is caused by a mutation in the hypocretin (orexin) receptor 2 gene. Cell 98, 365–76 (1999).
20. Pelé, M., Tiret, L., Kessler, J.-L., Blot, S. & Panthier, J.-J. SINE exonic insertion in the PTPLA gene leads to multiple splicing defects and segregates with the autosomal recessive centronuclear myopathy in dogs. Hum. Mol. Genet. 14, 1417–27 (2005).
21. Hédan, B. et al. Coat colour in dogs: Identification of the Merle locus in the Australian shepherd breed. BMC Vet. Res. 2, 1–10 (2006). 22. Parker, H. G. et al. An expressed fgf4 retrogene is associated with breed-defining chondrodysplasia in domestic dogs. Science 325,
995–8 (2009).
23. Guttman, M. et al. Chromatin signature reveals over a thousand highly conserved large non-coding RNAs in mammals. Nature 458, 223–7 (2009).
24. Djebali, S. et al. Bioinformatics Pipeline for Transcriptome Sequencing Analysis. Methods Mol. Biol. 1468, 201–19 (2017). 25. Harrow, J. et al. GENCODE: the reference human genome annotation for The ENCODE Project. Genome Res. 22, 1760–74 (2012). 26. Li, B. & Dewey, C. N. RSEM: accurate transcript quantification from RNA-Seq data with or without a reference genome. BMC
Bioinformatics 12, 323 (2011).
27. Soumillon, M. et al. Cellular source and mechanisms of high transcriptome complexity in the mammalian testis. Cell Rep. 3, 2179–90 (2013).
28. Yanai, I. et al. Genome-wide midrange transcription profiles reveal expression level relationships in human tissue specification. Bioinformatics 21, 650–9 (2005).
29. Kryuchkova-Mostacci, N. & Robinson-Rechavi, M. A benchmark of gene expression tissue-specificity metrics. Brief. Bioinform. 18, 205–214 (2017).
30. Kornienko, A. E. et al. Long non-coding RNAs display higher natural expression variation than protein-coding genes in healthy humans. Genome Biol. 17, 14 (2016).
31. Chalmel, F. & Rolland, A. D. Linking transcriptomics and proteomics in spermatogenesis. Reproduction 150, R149–57 (2015). 32. Liu, S. et al. Annotation and cluster analysis of spatiotemporal- and sex-related lncRNA expression in rhesus macaque brain.
Genome Res. 27, 1608–1620 (2017).
33. Mehravar, M. et al. Introduction of novel splice variants for CASC18 gene and its relation to the neural differentiation. Gene 603, 27–33 (2017).
34. Paterson, C. et al. Temporal, Diagnostic, and Tissue-Specific Regulation of NRG3 Isoform Expression in Human Brain Development and Affective Disorders. Am. J. Psychiatry 174, 256–265 (2017).
35. Andrée, B. et al. Isolation and characterization of the novel popeye gene family expressed in skeletal muscle and heart. Dev. Biol. 223, 371–82 (2000).
36. Tarailo-Graovac, M. & Chen, N. Using RepeatMasker to identify repetitive elements in genomic sequences. Curr. Protoc. Bioinforma. Chapter 4, Unit4.10 (2009).
37. Rohart, F., Gautier, B., Singh, A. & Lê Cao, K.-A. mixOmics: An R package for’omics feature selection and multiple data integration. PLoS Comput. Biol. 13, e1005752 (2017).
38. Franke, V. et al. Long terminal repeats power evolution of genes and gene expression programs in mammalian oocytes and zygotes. Genome Res. 27, 1384–1394 (2017).
39. Herrero, J. et al. Ensembl comparative genomics resources. Database (Oxford). 2016, bav096 (2016).
40. Chen, Z.-H. et al. The lncRNA HOTAIRM1 regulates the degradation of PML-RARA oncoprotein and myeloid cell differentiation by enhancing the autophagy pathway. Cell Death Differ. 24, 212–224 (2017).
41. Tripathi, V. et al. The nuclear-retained noncoding RNA MALAT1 regulates alternative splicing by modulating SR splicing factor phosphorylation. Mol. Cell 39, 925–38 (2010).
42. Nakagawa, S., Naganuma, T., Shioi, G. & Hirose, T. Paraspeckles are subpopulation-specific nuclear bodies that are not essential in mice. J. Cell Biol. 193, 31–9 (2011).
43. Kretschmer, A. & Tilki, D. Biomarkers in prostate cancer - Current clinical utility and future perspectives. Crit. Rev. Oncol. Hematol. 120, 180–193 (2017).
44. Ke, D. et al. The combination of circulating long noncoding RNAs AK001058, INHBA-AS1, MIR4435-2HG, and CEBPA-AS1 fragments in plasma serve as diagnostic markers for gastric cancer. Oncotarget 8, 21516–21525 (2017).
45. Hagan, J. P., O’Neill, B. L., Stewart, C. L., Kozlov, S. V. & Croce, C. M. At least ten genes define the imprinted Dlk1-Dio3 cluster on mouse chromosome 12qF1. PLoS One 4, e4352 (2009).
46. Davydov, E. V. et al. Identifying a high fraction of the human genome to be under selective constraint using GERP++. PLoS Comput. Biol. 6, e1001025 (2010).
47. Schüler, A., Ghanbarian, A. T. & Hurst, L. D. Purifying selection on splice-related motifs, not expression level nor RNA folding, explains nearly all constraint on human lincRNAs. Mol. Biol. Evol. 31, 3164–83 (2014).
48. Breschi, A., Gingeras, T. R. & Guigó, R. Comparative transcriptomics in human and mouse. Nat. Rev. Genet. 18, 425–440 (2017). 49. ENCODE Project Consortium. An integrated encyclopedia of DNA elements in the human genome. Nature 489, 57–74 (2012). 50. GTEx Consortium. The Genotype-Tissue Expression (GTEx) project. Nat. Genet. 45, 580–5 (2013).
51. Mallory, A. C. & Shkumatava, A. LncRNAs in vertebrates: advances and challenges. Biochimie 117, 3–14 (2015).
52. Albrecht, A.-S. & Ørom, U. A. Bidirectional expression of long ncRNA/protein-coding gene pairs in cancer. Brief. Funct. Genomics 15, 167–73 (2016).
53. Cai, Q. & Chan, H. P. A Double Application of the Benjamini-Hochberg Procedure for Testing Batched Hypotheses. Methodol Comput Appl Probab 19, 429–443 (2016).
54. Villar, D. et al. Enhancer Evolution across 20 Mammalian Species. Cell 160, 554–566 (2015).
55. Sun, J., Lin, Y. & Wu, J. Long non-coding RNA expression profiling of mouse testis during postnatal development. PLoS One 8, e75750 (2013).
56. Saliba, A.-E., Westermann, A. J., Gorski, S. A. & Vogel, J. Single-cell RNA-seq: advances and future challenges. Nucleic Acids Res. 42, 8845–60 (2014).
57. Shalek, A. K. et al. Single-cell transcriptomics reveals bimodality in expression and splicing in immune cells. Nature 498, 236–40 (2013).
58. Breschi, A. et al. Gene-specific patterns of expression variation across organs and species. Genome Biol. 17, 151 (2016).
59. Qureshi, I. A. & Mehler, M. F. Emerging roles of non-coding RNAs in brain evolution, development, plasticity and disease. Nat. Rev. Neurosci. 13, 528–41 (2012).
60. Zhou, J. et al. Conserved expression of ultra-conserved noncoding RNA in mammalian nervous system. Biochim. Biophys. Acta 1860, 1159–1168 (2017).
61. Carpenter, S. et al. A long noncoding RNA mediates both activation and repression of immune response genes. Science 341, 789–92 (2013).
62. Sun, L. et al. Long noncoding RNAs regulate adipogenesis. Proc. Natl. Acad. Sci. USA 110, 3387–92 (2013).
63. Liu, S. J. et al. CRISPRi-based genome-scale identification of functional long noncoding RNA loci in human cells. Science 355 (2017).
64. Dobin, A. et al. STAR: ultrafast universal RNA-seq aligner. Bioinformatics 29, (15–21 (2013).
65. Casper, J. et al. The UCSC Genome Browser database: 2018 update. Nucleic Acids Res. 46, D762–D769 (2018).
66. Wang, J., Vasaikar, S., Shi, Z., Greer, M. & Zhang, B. WebGestalt 2017: a more comprehensive, powerful, flexible and interactive gene set enrichment analysis toolkit. Nucleic Acids Res. 45, W130–W137 (2017).
Acknowledgements
The biological samples were obtained from the ‘Cani-DNA_CRB’, which is part of the CRB-Anim infrastructure (http://dog-genetics.genouest.org). We would like to thank the following funding agencies: the ‘Cani-DNA_CRB’ [ANR-11-INBS-0003], the CNRS (Centre National de la Recherche Scientifique), the Université Rennes1 and the Brittany Region (France) (PhD funding for CLB). We thank the LUPA consortium (http://eurolupa.org) and the BROAD Institute for the sequencing. We thank Sarah Djebali of the INRA GenPhyse of Toulouse and members of the canine genetics team at IGDR-Rennes. We thank Ignacio Gonzalez for help with the analysis using mixOmics. We also thank the Genouest Bioinformatic platform, Rennes, France (https://www.genouest.org/) for providing the necessary computing resources.
Author Contributions
C.L.B., T.D. and C.H. conceived the study and wrote the manuscript. C.L.B., V.W., L.L., E.C., B.H., N.B., C.D.B., A.S.G., C.A., T.D. and C.H. provided the samples and tissues for phenotyping. Data analysis was performed by C.L.B., V.W., T.D. and C.H. All authors read, improved and approved the manuscript.
Additional Information
Supplementary information accompanies this paper at https://doi.org/10.1038/s41598-018-31770-2.
Competing Interests: The authors declare no competing interests.
Publisher's note: Springer Nature remains neutral with regard to jurisdictional claims in published maps and
institutional affiliations.
Open Access This article is licensed under a Creative Commons Attribution 4.0 International
License, which permits use, sharing, adaptation, distribution and reproduction in any medium or format, as long as you give appropriate credit to the original author(s) and the source, provide a link to the Cre-ative Commons license, and indicate if changes were made. The images or other third party material in this article are included in the article’s Creative Commons license, unless indicated otherwise in a credit line to the material. If material is not included in the article’s Creative Commons license and your intended use is not per-mitted by statutory regulation or exceeds the perper-mitted use, you will need to obtain permission directly from the copyright holder. To view a copy of this license, visit http://creativecommons.org/licenses/by/4.0/.