RESEARCH
T cells loaded with magnetic
nanoparticles are retained in peripheral lymph
nodes by the application of a magnetic field
Laura Sanz‑Ortega
1, José M. Rojas
1,3, Ana Marcos
2,4, Yadileiny Portilla
1, Jens V. Stein
2,4and Domingo F. Barber
1*Abstract
Background: T lymphocytes are highly dynamic elements of the immune system with a tightly regulated migration.
T cell‑based transfer therapies are promising therapeutic approaches which in vivo efficacy is often limited by the small proportion of administered cells that reaches the region of interest. Manipulating T cell localisation to improve specific targeting will increase the effectiveness of these therapies. Nanotechnology has been successfully used for localized release of drugs and biomolecules. In particular, magnetic nanoparticles (MNPs) loaded with biomolecules can be specifically targeted to a location by an external magnetic field (EMF). The present work studies whether MNP‑ loaded T cells could be targeted and retained in vitro and in vivo at a site of interest with an EMF.
Results: T cells were unable to internalize the different MNPs used in this study, which remained in close associa‑
tion with the cell membrane. T cells loaded with an appropriate MNP concentration were attracted to an EMF and retained in an in vitro capillary flow‑system. MNP‑loaded T cells were also magnetically retained in the lymph nodes after adoptive transfer in in vivo models. This enhanced in vivo retention was in part due to the EMF application and to a reduced circulating cell speed within the organ. This combined use of MNPs and EMFs did not alter T cell viability or function.
Conclusions: These studies reveal a promising approach to favour cell retention that could be implemented to
improve cell‑based therapy.
Keywords: Cell‑based therapy, T cell, Magnetic nanoparticle, Magnetic retention, Lymph node
© The Author(s) 2019. This article is distributed under the terms of the Creative Commons Attribution 4.0 International License (http://creat iveco mmons .org/licen ses/by/4.0/), which permits unrestricted use, distribution, and reproduction in any medium, provided you give appropriate credit to the original author(s) and the source, provide a link to the Creative Commons license, and indicate if changes were made. The Creative Commons Public Domain Dedication waiver (http://creat iveco mmons .org/ publi cdoma in/zero/1.0/) applies to the data made available in this article, unless otherwise stated.
Open Access
*Correspondence: [email protected]
1 Department of Immunology and Oncology, and NanoBiomedicine Initiative, Centro Nacional de Biotecnología (CNB)‑CSIC, Darwin 3, Cantoblanco 28049, Madrid, Spain
Full list of author information is available at the end of the article
Background
Immunotherapy has re-emerged as a promising thera-peutic tool in recent years [1]. The idea of specifically modulating the immune response represents an attrac-tive approach to restore or enhance the immune sys-tem’s ability to fight cancer or control autoimmune diseases. In particular, immune cell-based thera-pies, which are based on the use of the patient’s own cells after in vitro expansion and/or modification,
are currently one of the most appealing strategies in this field [2, 3]. This approach can be applied to treat either cancer [4, 5] or autoimmunity [6–8]. The clinical response rates that these strategies elicit are nonethe-less strongly correlated to the number of transferred cells that reach the desired region. As such, one of the main limitations of cell-based therapies is the disper-sion of the in vivo-administered cells which results in only a small proportion of cells reaching the site of interest [9]. There is therefore a clear need to develop new strategies that promote specific cell infiltration, accumulation and survival in specific tissues so that they can exert their function effectively.
Nanotechnological approaches can offer a solu-tion, as they can increase treatment effectiveness by
concentrating therapeutic molecules in the required region. Nanoparticle-based drug delivery systems can access difficult-to-reach sites because of their small size. They can be directed by active or passive strategies based on the nanomaterial physical and chemical properties and/or through addition of targeting moieties in the nan-oparticle coating [10]. One promising active approach is based on superparamagnetic iron oxide nanoparti-cles, which can be localized precisely in the desired area by applying an external magnetic field (EMF) [11]. This approach could promote specific cell accumulation and thereby improve the efficacy of cell transfer therapies. Non-lymphoid cells loaded with these magnetic nano-particles (MNPs) can be inoculated systemically and attracted to a target tissue in mice by the application of an EMF [12–17]. These studies focused mainly on enrich-ing stem cells, mesenchymal cells, macrophages or den-dritic cells to control tissue injury and immune disorders. Studies using in vivo delivery of magnetically guided lym-phoid cells to treat cancer and autoimmunity are very limited [18] and this field remains vastly unexplored. The manipulation of highly motile effector lymphoid cells such as T or natural killer (NK) cells to target and accu-mulate them to a specific region such as lymph nodes (LNs) or solid tumours could be a promising approach to enhance their activity in the desired area.
In this work, we focus on T lymphocytes, an essential effector cell of the adaptive immune system, which con-tinuous circulation is very dynamic compared to other immune cells such as dendritic cells or macrophages. During an immune response, T cells need to interact with other cells and detect antigens in different contexts and tissues [19]. T cell migration, which is tightly regulated by multiple factors, such as cellular expression of selectins and chemokine receptors and interaction with other cells in secondary lymphoid organs (SLOs), is critical for the development of effective T cell responses [20, 21]. T cells circulate through lymphoid and target organs where they can search for their cognate antigen either on the surface of antigen-presenting cells (APCs) in lymphoid organs or on target cells in peripheral organs. Initial T cell acti-vation steps occur in SLOs such as the LNs, where the tissue organization allows murine primary T cells to encounter their cognate antigen on APCs coming from different tissues and become activated. Once activated, these antigen-experienced T cells scan peripheral tissues to find and eliminate their antigen [22, 23]. Manipulating T cells to target specific locations could therefore be an interesting strategy to promote for instance their accu-mulation in the SLOs during priming and activation to enhance the immune response, or to favour their reten-tion in the target tissue once activated. MNP-loading of
T cells could thus be used for these targeting purposes as long as T cell function and interaction with chemokines, adhesion molecules and other cell types is not impaired by the treatment.
In this study, we evaluated the possibility that MNPs could be used as a platform to magnetically guide T cells to a region of interest. We assess T cell migration func-tionality after MNP treatment as well as their in vitro and in vivo manipulation to a target site through the applica-tion of an EMF.
Methods
Iron oxide core synthesis
Iron oxide cores were prepared by following the Massart coprecipitation protocol [24]. Briefly, 445 ml of a mixture of FeCl3·6H2O (0.09 mol) and FeCl2·4H2O (0.054 mol)
were added to 75 ml of NH4OH (25%). This addition
was performed slowly and under vigorous stirring. The mixture was heated at 90 °C for 90 min to prepare nano-particles of approximately 12 nm in diameter. After that, the sample was washed three times with distilled water by magnetic decantation. To oxidize magnetite to magh-emite and activate surface for subsequent steps, the pre-cipitate was treated with 300 ml of HNO3 (2 M) under
stirring for 15 min. Then, nitric acid was removed by magnetic decantation, and 75 ml of Fe(NO3)3 (1 M) and
130 ml of water were added over the preparation. The mixture was heated up to boiling temperature and stirred for 30 min. The particles were then cooled to room tem-perature and, by magnetic decantation, the supernatant was substituted by 300 ml of HNO3 (2 M) and stirred for
15 min. Finally, they were washed three times with ace-tone and dispersed in distilled water. A rotary evaporator was used to remove any acetone waste and concentrate the sample.
MNP surface coating
Iron oxide cores were coated with dimercaptosuccinic acid (DMSA), 3-aminopropyl-triethoxysilane (APS) or dextran (6 kDa) following procedures previously described [25]. Briefly, for DMSA coating (DMSA-MNPs), 14.7 mg (0.08 mmol) of DMSA were added to a suspension of 30 ml of the iron oxide cores (0.05 M) under stirring at pH 3. After this, the pH was increased to 11 and the sample was sonicated for 20 min. After coat-ing, this suspension was dialyzed for 2 days and finally; the pH was adjusted to 7. For APS coating (APS-MNPs), 1.17 ml (0.005 mol) of APS was added very slowly to a mixture of 10 ml of the iron oxide cores (28 g Fe2O3
per l) and 10 ml of methanol under vigorous stirring for 12–16 h. Methanol was eliminated from the mix-ture using a rotary evaporator. The sample was then
washed three times with a mixture of acetone/water (70/30) and redispersed in 10 ml of distilled water. The pH was decreased to 3 and the sample was sonicated for 1 h. Finally, the pH was adjusted to 7 and sonicated for 10 min. For Dextran coating (DEXT-MNPs), the iron oxide core dispersion [600 mg of Fe2O3 in 4.8 ml NaOH
(0.8 M)] was added dropwise into a solution of 600 mg of dextran (6 kD) in 7.5 ml NaOH (0.5 M) under sonication. The mixture was sonicated for 6 h under refrigeration. After coating, this suspension was dialyzed for 3 days and finally; the pH was adjusted to 7.
MNP characterization
For TEM analyses, a drop of a dilute MNP suspension was placed on a carbon-coated copper grid and the sol-vent allowed to dry at room temperature. Images were acquired with a JEOL JEM 1011 transmission electron microscope with Gatan ES1000Ww camera. MNP size, shape and distribution were determined using TEM images and ImageJ software. For hydrodynamic size and Z-potential determination, we analysed a suspension of MNPs in water or in 0.01 M KNO3 solution, respectively.
Dynamic light scattering (DLS) for colloidal characteriza-tion was carried out using a Nano Sizer ZS (Malvern).
Coating presence on MNP surface was determined from FTIR spectra, recorded between 4000 and 250 cm−1
on a Bruker (USA) IFS 66V-S spectrometer and a Nicolet FT-IR 20SXC (Thermo Scientific, USA). Thermal analysis was performed to quantify the amount of coating mol-ecules on the MNP surface. Simultaneous thermogravi-metric (TG) and differential thermal analysis (DTA) were performed on a Seiko TG/DTA 320U thermobalance (Seiko Instruments, Japan). Samples were heated from room temperature to 900 °C at 10 °C/min under an air-flow of 100 ml/min. Iron determination was carried out in an inductively coupled plasma-optical emission spec-trometry (ICP-OES) OPTIME 2100DV [Perkin Elmer (USA)] apparatus after acid digestion. For the magnetic characterization, liquid samples were frozen and dried overnight in a LyoQuest freeze dryer (Telstar, Spain). The resulting solid sample was compacted into gela-tine capsules for magnetic characterization. Hysteresis loops with a maximum field of 5 T were measured in a Vibrating Sample Magnetometer (MLVSM9, MagLab 9T, Oxford Instruments, UK). AC magnetic susceptibil-ity measurements were performed in a Quantum Design (USA) MPMS-XL SQUID magnetometer with magnetic field amplitude of 0.41 mT and a frequency of 11 Hz in the temperature range between 2 and 300 K. Endotoxin levels in MNP preparations were measured using a com-mercial LAL chromogenic assay (Lonza) according to the manufacturer’s instructions.
Cell culture
The human cell line Jurkat (ATCC: TIB-152) and the murine cell line RAW264.7 (ATCC: TIB-71) were cul-tured in DMEM with 10% FBS, 2 mM l-glutamine, 1 mM sodium pyruvate, 50 µM 2-mercaptoethanol and 100 U/ ml penicillin/streptomycin (P/S) in standard culture con-ditions (37 °C, 5% CO2, 90% relative humidity). Murine
primary T cells were purified from spleen and LN cell suspensions obtained from C57BL/6 mice (Harlan Lab-oratories) using the Mouse T cell Isolation kit (STEM-CELL Technologies). After isolation, T cells were 90–95% CD3+ by flow cytometry analysis and cultured in RPMI
with 10% FBS, 2 mM l-glutamine, 2-mercaptoethanol and 100 U/ml P/S in standard culture conditions (37 °C 5% CO2, 90% relative humidity).
MNP treatment
Jurkat and murine primary T cells were incubated with MNPs (150 µg Fe/ml) in a reduced volume at high cell density (106 cells in 100 µl corresponding medium) for
2 h in standard conditions.
Cell viability, MNP uptake and staining assays
Cell viability was analysed by two methods. In the AlamarBlue assay (Invitrogen), cells were cultured in a 96-well plate with different MNP concentrations for 24 h and AlamarBlue was added to each well, incubated for 4 h and fluorescence was finally measured (530 nm excitation, 590 nm emission). Cell survival is expressed as the percentage of fluorescence of MNP-treated cells compared to untreated cells. For FITC-annexin V/pro-pidium iodide staining, cells were processed using the Annexin V-PI apoptosis assay kit according to the man-ufacturer’s protocol (Life Technologies) and analyzed by flow cytometry on a FC500 flow cytometer.
To quantify MNP uptake, cells (107 cells/ml) were
incubated with MNPs (150 µg Fe/ml) for 2 h in stand-ard conditions, washed with PBS and digested for 1 h at 90 °C sequentially with 1 ml HNO3 63% and then, with
1 ml H2O2. Iron determination was performed by
ICP-OES as in MNP characterization.
Different microscopy techniques were used to deter-mine MNP subcellular location. For iron staining, cells were washed with PBS after incubation with MNPs, fixed in paraformaldehyde (PFA) 4% (15 min), per-meabilized with TritonX-100 (5 min), stained with an equal volume of HCl 4% and potassium ferrocyanide trihydrate 4% (Prussian blue, 20–30 min) and counter-stained with neutral red 0.5% (1 min). Samples were washed with distilled water, air-dried and mounted using mounting medium (7.7% gelatine, 54% glycerol). Images were acquired on an Olympus IX70 inverted
bright field microscope with 63× or 100× oil-objec-tives. For dark-field confocal microscopy, LysoTracker Red DND-99 (Life Technologies) was added to the media during the incubation with MNPs. Alexa Fluor 647-wheat germ agglutinin (Life Technologies) was added during the last 15 min to the culture. Cells were then washed, fixed with PFA 4% (15 min), coun-terstained with DAPI and mounted in Fluoromont-G (SouthernBiotec). Images were acquired with a 0.13 μm step with a confocal multispectral Leica TCS SP5 sys-tem with a 63×/1.4 NA oil objective and 5× zoom. For dark-field acquisition of MNPs, the 488 nm laser light was used. ImageJ software was used for image analysis and orthogonal projections. For TEM microscopy, cells were fixed at RT in 2% glutaraldehyde, 1% tanic acid in 0.4 M HEPES at PH 7.2, washed and resuspended in HEPES buffer. Samples were processed and included by the Transmission Electronic Microscopy Service at the National Center for Biotechnology (CNB-CSIC, Madrid, Spain). Images were acquired at different mag-nifications with a JEOL JEM 1011 transmission electron microscope with Gatan ES1000Ww camera.
Real‑time metabolic analysis
Metabolic profiling of MNP-free and -loaded murine primary T cells was undertaken using a Seahorse XFp Extracellular Flux Analyser (Agilent Technologies) with the Agilent Seahorse XFp Cell Energy Phenotype Test Kit following the manufacturer’s protocol.
Calcium imaging assays
An 8-well μ-Slide (Ibidi) was coated with poly-lysine (Sigma) for 1 h at RT, washed 3 times with PBS and allowed to dry at 37 °C. Cells (107 cells/ml) were
incu-bated with MNPs (150 µg Fe/ml) for 2 h in standard con-ditions. Untreated and MNP-treated cells were washed with PBS and calcium starved for 3 h. After this, cells (2.5 × 10⁶ cells/ml) were stained with Fluo-3 AM (3 µM,
Invitrogen) for 30 min at 37 °C in rotation and washed with HBSS 1× (Gibco) 10% FBS without calcium. 2.5 × 10⁵ cells in 250 µl of HBSS 1× 10% FBS without
cal-cium were seeded per well and allowed to attach to the bottom of the poly-lysine coated slides for 5 min. Movies were acquired every 645 ms with a confocal multispec-tral Leica TCS SP5 system with a 20× objective and 2× zoom. Cell images were first recorded without calcium or stimuli for 3 min and then, 50 µl HBSS 1× 10% FBS with 50 ng/ml phorbol 12-myristate 13-acetate (PMA) (Sigma), 5 µM ionomycin (Sigma) and 2 mM CaCl2 were
added and movies immediately acquired for 10 min. In some experiments, an 8 × 6 mm neodymium–boron– iron (NdFeB) permanent magnet (Br: 1.45 T) was placed next to the well to study EMF effects. The appropriate
unstained and/or unloaded controls were also per-formed. LAS X Life Science Software (Leica) was used to analyse fluorescence fluctuation in cells due to calcium fluxes changes.
Mice
C57BL/6 mice purchased from Harlan and athymic nude mice purchased from Envigo were maintained in the CNB animal facility and handled according to the rec-ommendations of the CNB-CSIC institutional Ethics Committee. C57BL/6-Tg(CAG-EGFP)131Osb/LeySopJ (“Ubi-GFP”) mice purchased from Jackson and C57BL/6 mice purchased from Janvier were maintained in the Theodor Kocher Institute animal facility and handled according to the recommendations of the Cantonal Eth-ics Committee. The procedures involving animal work at CNB-CSIC were approved by the Ethics Committee for Animal Experimentation at the CSIC and by the Divi-sion of Animal Protection of the Comunidad de Madrid in compliance with national and European Union legisla-tion. The procedures involving animal work at the Theo-dor Kocher Institute, University of Bern were approved by the Cantonal Committee for Animal Experimentation and were conducted according to federal and cantonal guidelines.
Flow cytometry
Cells (107 cells/ml) were incubated with MNPs (150 µg
Fe/ml) for 2 h in standard conditions, washed with PBS and stained with fluorochrome-conjugated Abs against cell surface markers. For Jurkat cells, the following anti-human antibodies were used: anti-CD62L (DREGC 56, Coulter), -CD11a (25.3.1, Immunotech), -CD45 (KC56 (T-200), Beckamn C.) and -CD44 (G44-26, Pharmingen). For murine primary T cells, the following anti-mouse antibodies from Biolegend were used: anti-CD44 (IM7), -CD62L (Mel-14), -CD11a (M17/4), -CCR7 (4B12), -CD4 (RMA-5) and -CD8 (53-6.7). CCR7 labelling was per-formed at 37 °C for 30 min with biotinylated primary antibody followed by secondary staining with PE-conju-gated streptavidin. Data were acquired on a FC500 flow cytometer or in Attune Nxt flow cytometer and analysed with FlowJo software.
Transwell migration assay
Jurkat or murine primary T cells (107 cells/ml) were
treated or left untreated with MNPs (150 µg Fe/ml) for 2 h in standard conditions and washed with PBS. MNP-treated and unMNP-treated cells were differentially labelled with PKH26 Red or PKH67 Green fluorescent cell linker kits (Sigma Aldrich). MNP-treated and untreated cells were alternatively stained in red or green in repeat exper-iments to exclude dye labelling effects. MNP-treated
and untreated cells were mixed in a ratio 1:1 and seeded (5 × 10⁵ cells in 0.1 ml) in each insert (Corning, 5 µm
pore insert for Jurkat cells and 3 µm for murine T cells) in RPMI+ 2% FBS. To create a chemotactic gradient the recombinant human CXCL12 (10 nM, Peprotech) or the recombinant murine CCL21 (25 nM, Peprotech) was added to the lower chamber in Jurkat or murine T cells, respectively. Cells were allowed to migrate for 16 h (Jurkat cells) or 2 h (murine T cells) after which lower chamber contents were collected, stained with fluorochrome-labeled Abs against CD8 (53-6.7) and CD4 (RMA-5) in the case of murine T cells and cells were counted by flow cytometry, using a FC500 flow cytom-eter, and analysed by FlowJo software. Cell migration was referred and normalized to an input well [without transwell (100% migration)]. For magnetic field-exposed transwell assays, an 8 × 6 mm NdFeB permanent mag-net (Br: 1.45 T) was placed under the well, just below the pore insert.
Flow chamber assays
In vitro magnetic retention assays under flow conditions were performed in a modified channel slide (µ-Slide I Luer, 0.4 mm height, ibidi). This modification allowed the two-magnet system, specially designed for this assay, to be placed on the chamber and produce a homogene-ous strong magnetic gradient on both sides of the chan-nel. Jurkat or murine primary T cells (107 cells/ml) were
incubated or left untreated with different doses of MNPs (50, 100 and 150 µg Fe/ml) for 2 h in standard condi-tions, washed with PBS and stained with calcein-AM (ThermoFisher) for 20 min at 37 °C in PBS with 0.5% FBS. Cells were then diluted in PBS with 0.5% FBS (2.5 × 10⁵
cells/ml) until use. Flow chamber set-up was mounted on an Olympus Inverted Microscope model IX71 con-nected to an Imaging Station cellR and in standard
cul-ture conditions (37 °C 5% CO2, 90% relative humidity).
PBS with 0.5% FBS was infused at high flow rate to fill the system. Cells were infused at 0.5 dyne/cm2 (≈ 100 μl/
min). Images were recorded every 1 s for 4 min. After the first 60 s, the two-magnet system was placed into the flow chamber and its effect recorded for the remaining time. IMARIS Software (Bitplane) was used to generate the movies and for cell motility tracking. Displacement in Y-axes (magnetic-field direction) was analysed.
Adoptive transfer and in vivo T cell homing
Jurkat or murine primary T cells from C57BL/6 mice, MNP-treated and untreated, were stained with CFSE (Invitrogen) and Dye eFluor 670 (Thermofisher) and cell mixtures (1:1, total 107 cells/100 µl) were injected
intravenously into nude or C57BL/6 mice, respectively. Mice were sacrificed after 90 min or 24 h for Jurkat cell
transfer, or 1 h for murine T cell transfer. Spleen, periph-eral (inguinal and axillary) (PLN) and mesenteric LNs (MLN) were removed to obtain a single cell suspension, and fluorophore-labeled cells counted by flow cytom-etry [FACSCalibur flow cytometer (BD)] and analysed by FlowJo Software.
For magnetic-targeted homing, an 8 × 6 mm NdFeB permanent magnet (Br: 1.45 T) was placed over one of the popliteal LNs for 30 and 90 min for Jurkat cells and 20 min for murine T cells. In this case, axillary, inguinal and popliteal LNs from both sides were collected.
Selective plane illumination microscopy (SPIM)
A mixture of MNP-treated and untreated murine pri-mary T cells (107 cells/mouse, ratio 1:1), isolated from the
LNs and spleen of Ubi-GFP mice, were inoculated intra-venously into C57BL/6 mice and 20-min homing experi-ments with an 8 × 6 mm NdFeB permanent magnet (Br: 1.45 T) over one of the popliteal LNs was performed. Untreated cells were previously stained with CMTMR (5 µM, Molecular Probes) for 20 min at 37 °C to differ-entiate them from the treated ones (only GFP-labelled). High endothelial venules (HEV) networks were labelled by intravenous injection of Alexa Fluor 633-conjugated MECA79 mAb (Nanotools) 10 min prior to sacrifice and LN harvest. At 20 min after T cell transfer, popliteal LNs were collected and fixed in PFA 4% for 24 h before removing adjacent fat tissue under a stereomicroscope. Cleaned LNs were mounted in 2% ultrapure low-melting agarose and were optically cleared following the CUBIC protocol [26]. After this, LNs were scanned using a multi-spectral SPIM setup as described [27].
Two‑photon laser scanning microscopy (2PM) of popliteal LNs
To analyse the behaviour of MNP-treated T cells in the LNs, the right popliteal LN of recipient mice was surgi-cally prepared as previously described [28]. One or two 8 × 6 mm NdFeB permanent magnet (1.45 T) were placed as close as possible to the popliteal LN as showed in Fig. 9. Once prepared, a mixture of CMTMR- (5 µM) or CMAC- (20 µM) MNP-treated and untreated cells (107
cells/mouse, ratio 1:1) was intravenously injected and HEV networks were labelled by intravenous injection of Alexa Fluor 633-conjugated MECA79 mAb (Nanotools) just prior to recording. CMAC (CellTracker Blue) and CMTMR (CellTracker Orange) were both purchased from Molecular Probes. 2PM imaging was performed using a TrimScope 2PM system equipped with a fluores-cence microscope (BX50WI; LaVision Biotec; Olympus) equipped with a 20× objective (NA 0.95; Olympus). (11– 15)-slice z stacks with 4-µm spacing of 250 × 250–µm field of views (FOVs) were acquired every 20 s for 30 min.
IMARIS Software was used to generate 4D movies and for cell motility tracking. The Chemotaxis and Migration tool from Ibidi was used to plot the cells’ paths and ana-lyse their directionality.
Results
Synthesis and characterization of MNPs with different surface charges for T cell guidance
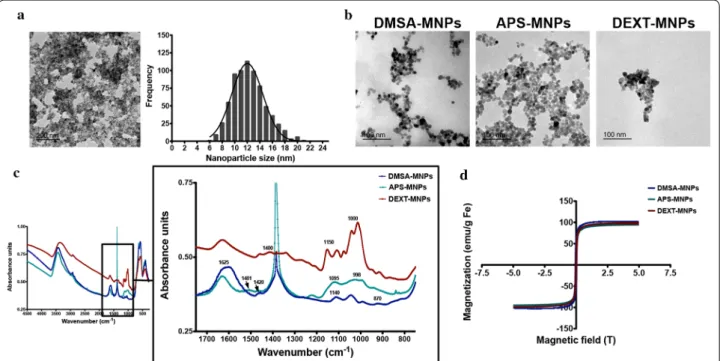
MNPs with almost spherical morphology were obtained by the coprecipitation method and subsequent acid treatment (Massart’s procedure). Transmission elec-tronic microscopy (TEM) imaging showed that these magnetic nanoparticle cores were on average 12.5 nm in diameter (Fig. 1a). The polydispersity degree was approximately 20%, indicating they are in the mono-dispersed range. MNPs were subsequently coated with dimercaptosuccinic acid (DMSA-MNPs), 3-amino-propyl-triethoxysilane (APS-MNPs) or dextran 6 kDa (DEXT-MNPs). This range of coatings produced MNPs with different surface charge and hydrodynamic size. The average particle size core of the coated MNPs and their aggregation status were verified by TEM (Fig. 1b). Fourier-transform infrared spectroscopy (FTIR) was used to evaluate the nature of each coating and its asso-ciation to the MNP surface (Fig. 1c). Coated MNPs showed characteristic IR bands at frequencies between 1000 and 1400 cm−1 associated to C–O and C–C bonds
due to polymer presence on MNP surface. Extra bands were detected, at 1625, 1400 and 1140 cm−1 for DMSA
(corresponding to the carboxylic acid-iron bond and C=O bonds), at 1095 and 998 cm−1 for APS
(corre-sponding to the formation of Si–O-Fe and Si–O-Si bonds) and in the range between 1000 and 1500 cm−1
and at 1400 cm−1 for dextran (due to C–O–C and C=O
bonds and CH2 and C–O–H deformations) [25, 29]. IR
bands at 500–600 cm−1 were present in all cases, due
to the Fe–O bond (Fig. 1c). The band at 1381 cm−1 in
APS-MNP spectra is due to the presence of nitric acid employed during MNP oxidation and pH adjustment [30]. Magnetization measurements confirmed MNP magnetic properties (Fig. 1d).
MNP hydrodynamic size values and surface charge were measured by dynamic light scattering (DLS). DMSA-MNPs, APS-MNPs and DEXT-MNPs hydro-dynamic sizes were 83 nm, 82 nm and 120 nm respec-tively (Table 1). Coating quantification was performed by thermogravimetric (TG) analyses. The weight percent-age of these coatings varied from 10% for DMSA-coated MNPs and APS-coated MNPs to approximately 38% for DEXT-coated MNPs (Table 1). Iron concentration in the MNP preparations was measured by inductively coupled plasma optical emission spectrometry (ICP-OES). Endo-toxin levels were below 0.1 EU/ml for all MNP prepara-tions (Table 1).
Fig. 1 Physico‑chemical characterization of MNPs. a TEM images of iron oxide cores prepared by co‑precipitation synthesis and MNP size
distribution and Gaussian fitting. b TEM images of DMSA‑MNPs, APS‑MNPs and DEXT‑MNPs. c Fourier transformed infrared spectra for DMSA‑MNPs, APS‑MNPs and DEXT‑MNPs. d Magnetization curve for DMSA‑MNPs, APS‑MNPs and DEXT‑MNPs showing the superparamagnetic behaviour
MNPs are not toxic and are mainly detected on T cell surface
To assess MNP effects on T cell we chose two T cell mod-els: the human T cell line Jurkat and murine primary T cells isolated from C57BL/6 mice. To examine nanoparticle tox-icity, we first analysed cell survival after MNP incubation using different assays. MNP treatment did not affect Jurkat and murine T cells viability in AlamarBlue assays (Fig. 2a, b). Indeed, MNP-treated T cells often showed greater fluorescence readings in the AlamarBlue assays, indicat-ing a slight increase in the mitochondrial metabolism of these cells. Similarly, no statistically significant differences in apoptosis induction were detected by annexin V-FITC/ PI staining, even at MNP concentrations of 150 μg Fe/ml (Fig. 2c, d). Preliminary analysis of the metabolic pheno-type of MNP-treated cells using the Seahorse extracellular flux analyser technology showed enhanced mitochondrial respiration and glycolysis (Additional file 1: Fig. S1).
To analyse how the three types of MNPs interacted with Jurkat and murine T cells, we first evaluated the capacity of these cells to associate with these MNPs after co-incubation. Optimal MNP association to T cells was obtained after 2-h incubation in a reduced volume. ICP measurements showed that both cell types were able to better associate with APS-MNPs than with DMSA-MNPs or DEXT-DMSA-MNPs (Fig. 2e, f). Moreover, MNP asso-ciation was higher in Jurkat cells than in murine T cells. Due to its high association to T cells, APS-MNPs thus appear as the preferred candidate to study MNP-medi-ated retention of these cells.
We next studied MNP subcellular localization in these cells using different approaches. Pearls staining and confocal microscopy showed that MNPs, regard-less of their polymeric coating, were mainly associ-ated with the cell membrane (Fig. 3a, b). These results were confirmed by TEM (Fig. 3c). Most of the MNPs remain in the periphery of the cells, probably associ-ated though electrostatic interactions with the mem-brane. TEM images at higher magnification (Fig. 4) confirmed the close interaction between the different MNPs and the cell membrane. APS-MNPs were those that seem to associate more with the surface of Jurkat and murine T cells, covering a larger cell membrane area, in line with the previous iron ICP measurements.
TEM microscopy with murine T cells also revealed an increase in the number of mitochondria after MNP treatment, supporting the enhanced metabolism seen in previous assays.
MNPs did not affect the expression of specific T cell markers but slightly impaired chemotactic response
To check whether MNP association with T cells affected their effector functions, we first analysed by flow cytometry the expression levels of several important T cell surface markers. In Jurkat cells the expression of the adhesion markers CD62L and CD44, the integrin CD11a and the general leukocyte marker CD45 was evaluated (Fig. 5a). In murine T cells we analysed the expression of CD62L, CD44, CD11a and the chemokine receptor CCR7 (Fig. 5b). No differences were observed in the expression levels of these markers in Jurkat or in murine T cells when treated with APS-MNPs.
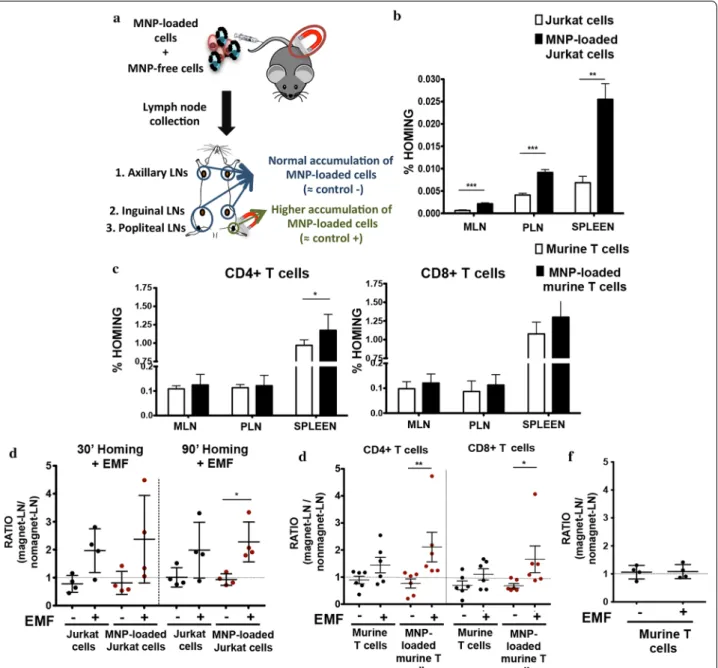
In order to effectively play their role in immune sur-veillance and in the body’s immune response, lym-phocytes need to respond to chemotactic factors that allow them to enter and exit specific lymphatic organs and tissues [31, 32]. We therefore measured the response of MNP-loaded T cells to a chemokine gradi-ent using transwell assay systems. MNP loading slightly impaired Jurkat cell migration in response to a CXCL12 chemokine gradient (Fig. 5c). A similar trend was also observed with primary murine T cells, although this difference was not statistically significant (Fig. 5d). This migratory defect was nonetheless corrected when a magnetic field was applied in the same direction as the biological gradient, more notably for Jurkat and CD4+
T cells (Fig. 5c, d). The application of an EMF probably facilitated the migration of MNP-loaded cells strug-gling to respond to the chemotactic gradient alone.
Magnetic fields enhanced in vitro T cell retention in flow conditions
To evaluate the capacity of a magnetic field to retain MNP-loaded T cells in hemodynamic conditions we analyse whether these cells were attracted to magnets in vitro in a dynamic flow system. Flow chambers were modified so that a two magnet system that exerts a homogenous and strong magnetic gradient [33, 34] could be applied at the cell flow
Table 1 Summary of the main characteristics of DMSA-MNPs, APS-MNPs and DEXT-MNPs
MNPs Coating Core
diameter (nm)
Hydrodynamic
diameter (nm) Z‑potential (mV) Coating (%) Endotoxin level (EU/ ml)
DMSA‑MNP Dimercaptosuccinic acid 12.5 83 − 34 10 < 0.1
APS‑MNP 3‑Aminopropyl‑triethoxysilane 12.5 82 + 38 10 < 0.1
level (Fig. 6a). Cell retention was analysed by changing the MNP doses as well as the magnetic force used (Fig. 6b).
MNP-free cells only moved in the flow direction, as shown in the movie (Additional file 2: Movie S1), whereas cells loaded with 150 µg/ml APS-MNPs start mov-ing towards the magnet when it was applied to the flow chamber, as shown in the movie (Additional file 3: Movie
S2). T cells needed a minimal amount of MNP (> 5 pg Fe/cell in our setting) for the magnetic field produced by the 1.35 T magnets to start retaining them (Additional file 1: Fig. S2). As the amount of cell-associated MNPs increased so did the cell retention by the magnetic field (Additional file 1: Fig. S2; Fig. 6c, d). This cell accumu-lation was also augmented when a stronger magnet
Fig. 2 MNP toxicity and association to Jurkat and murine primary T cells. a Jurkat and b murine T cell viability after MNP treatment measured by
AlamarBlue assays. Annexin‑V/PI analysis by flow cytometry of c Jurkat and d murine T cells after MNP treatment. e Jurkat and f murine T cell iron association after MNP treatment. Data (mean ± SD) are representative of three independent experiments in all analyses
Fig. 3 MNP subcellular localisation in Jurkat and murine primary T cells. a Representative images of Jurkat and murine T cells after MNP treatment
acquired by confocal microscopy [cell membrane (red), MNPs (gray) and nuclei (blue)] (scale bar = 10 μm). ImageJ software was used for orthogonal projections. b Perls’ Prussian blue staining and neutral red counterstaining of Jurkat and murine T cells after MNP treatment (scale bar = 10 μm). c Representative TEM images of Jurkat and murine T cells after MNP treatment. Whole cells (top panel pictures) were imaged as well as more detailed cell parts (bottom panel pictures) to better illustrate interactions between MNPs and cell surface. Arrowheads indicate MNP aggregates attached to the cell surface
(magnet B) was applied (Fig. 6c, d). Furthermore, cells were immobilised at the chamber wall near the magnet while attached (Fig. 6e) but resume following the flow direction once the magnet was removed. Similar results were obtained with both cell types, although magnetic retention in Jurkat cells was higher than in murine T cells since they associated with more MNPs as seen in ICP measurements.
T cell in vivo accumulation in the LNs was promoted by MNP loading and enhanced by localized EMFs application
Since T cells are continuously migrating into SLOs, such as LNs to maintain immune homeostasis [35], we decided to test, as a proof of concept for in vivo magnetic retention, whether the application of an EMF could affect the homing and retention of MNP loaded-T cells to a
Fig. 4 MNP association with the cell membrane of Jurkat and murine primary T cells. Representative TEM images of Jurkat and murine T cells after
MNP treatment. Highly detailed images showing the interaction between MNPs and cell surface (magnification 150–×200). Arrowheads indicate MNP aggregates attached to the cell surface. Scale bar: 50 nm
specific LN. MNP concentration (150 µg/ml APS-MNPs) and magnetic force [8 × 6 mm NdFeB permanent magnet (Br: 1.45 T)] used in in vivo studies were based on the optimal results obtained in flow chamber assays (Fig. 6c, d). A combination (ratio 1:1) of MNP-free and -loaded cells (Jurkat or murine T cells) was differentially labelled with dye Efluor 670 (red) or CFSE (green), to eliminate possible unspecific retention effects due to dye loading. Then, 107 cells per mouse were intravenously inoculated
in 5–6 weeks old mice (nude mice for Jurkat cells and C57BL/6 for murine T cells) and allowed to distribute in the organism. Mice were sacrificed at different timepoints post-adoptive transfer and representative lymphoid organs collected (axillary, inguinal, popliteal, mesenteric LNs and spleen depending on the experiments). In some experiments, an EMF was applied over a popliteal LN to promote specific lymphoid cell accumulation (Fig. 6a).
In vivo homing in the absence of an EMF was first tested to determine whether MNP loading impaired T cell traf-ficking towards SLOs. Irrespective of their origin (either the human T cell line Jurkat or primary murine T cells) MNP-loaded T cells were found in a higher number than MNP-free T cells in the collected peripheral and mes-enteric LNs and in the spleen (Fig. 7b, c). This difference was more remarkable in the case of Jurkat cells (Fig. 7b), and at later timepoints (data not shown).
After verifying that MNP treatment did not impair T cell homing capacity, these experiments were repeated with an EMF applied to a popliteal LN to potentially enhance cell retention at this location. Flow cytom-etry analyses after LN collection and disaggregation revealed that similar amounts of cells were found in pairs of matching lymph when no EMF was applied. EMF application increased the amount of cells found on the
Fig. 5 Biological effects of MNP treatment of Jurkat and murine primary T cells. Overlays of representative histograms for cell surface markers
of a Jurkat and b murine T cells after MNP treatment, compared to untreated cells. Isotype/unstained control, grey fill; untreated cells, blue line; MNP‑treated cells, orange line. Chemotactic response of c Jurkat and d murine T cells after treatment with MNPs. A mixture of differentially labelled MNP‑free and MNP‑loaded Jurkat or murine T cells (ratio 1:1) was prepared and seeded over a transwell. Their migration in the presence of chemotactic gradient of CXCL12 for Jurkat cells or CCL21 for T cells and in the presence or absence of a magnetic field was evaluated by flow cytometry after 16 h in Jurkat cells and 2 h in murine T cells. The results were normalized to input ratio. Data (mean ± SD) are representative of three‑four independent experiments. Student’s t‑test, *p < 0.05, **p < 0.01, ***p < 0.001
popliteal LN where the magnet was applied (Fig. 7d, e). The slight increase also detected in MNP-free cells in the LN with EMF application was probably due to their inter-action with MNP-treated cells in the cell mixture prior to injection, resulting in MNP transfer and/or aggregation of treated and untreated cells. Indeed, control inocula-tions of MNP-free cells alone showed no differential increase of this cell population in the LN over which the EMF was applied (Fig. 7f). Popliteal LNs were also imaged using SPIM. Image analysis revealed that larger numbers of transferred cells loaded with MNPs were retained in the LN exposed to a magnet than in non-exposed one (Fig. 8). These results confirm the results obtained in our in vivo homing studies.
MNPs and EMFs reduced T cell speed in popliteal LNs
Once magnetic retention of MNP-loaded T cells in the LNs was confirmed, we also wanted to study T cell behaviour in vivo and in real time. For this, intravital two-photon microscopy of popliteal LNs was performed in the absence of EMF or in EMF presence on one side or on both sides of the popliteal LN to increase mag-netic field strength (Fig. 9a, b). A combination of MNP-loaded and MNP-free cells (ratio 1:1) was inoculated just prior to recording and cell speed while traveling through the popliteal LN was analysed with the Imaris software. Image analysis from the recorded movies (Additional file 4: Movie S3; Additional file 5: Movie S4; Additional file 6: Movie S5) showed that MNP-loaded cells had a
Fig. 6 In vitro retention of MNP‑loaded cells in flow chamber assays. a Experimental set‑up for determining the magnetic in vitro retention of
MNP‑loaded cells. A special two‑magnet system was made to apply a homogeneous magnetic gradient and ibidi flow chambers were modified to adapt them to this device. b Summary of the properties of the permanent neodymium magnets used. Displacement in the magnetic force direction (Y‑axes) of MNP‑loaded c Jurkat and d murine primary T cells for varying MNP concentrations and magnetic force conditions. Cell displacement was analysed in at least 100 cells per movie by Imaris software. Data (mean ± SD) are representative of three independent experiments. Student’s t‑test, *p < 0.05, **p < 0.01, ***p < 0.001. e Capture of a flow chamber assay movie before and after magnetic field application. Arrows indicate the cell retention in the chamber wall near the magnet while applied
10% reduction in their speed compared to MNP-free cells even in the absence of EMF (Fig. 9c, d). No preferential location or directionality was observed in these experi-ments, even in the presence of an EMF (Additional file 1: Fig. S3). Image analysis nonetheless confirmed that the
MNP-loaded T cells were better retained in the popliteal LN than MNP-free cells (Fig. 9d). EMF application fur-ther reduced MNP-loaded T cell speed in the popliteal LN, and this was exacerbated by the application of 2 EMF. Surprisingly the speed of MNP-free cells was also
Fig. 7 In vivo homing capacity of Jurkat and murine primary T cells after MNP treatment with and without an EMF. a Experimental set‑up for
determining the homing capacity of MNP‑loaded cells compared to MNP‑free cells. A mixture of differentially fluorescence‑labelled MNP‑free and MNP‑loaded Jurkat or murine T cells (107 cells; ratio 1:1) was prepared and intravenously injected into nude (Jurkat) or C57BL/6J (murine T
cells) recipient mice. After 1 h, peripheral (PLN) and mesenteric (MLN) LNs and spleen were collected, processed and analysed by flow cytometry. Homing capacity of MNP‑free and MNP‑loaded b Jurkat and c murine T cells in the absence of an EMF, 1 h after cell injection. Data (mean ± SD) are representative of three independent experiments (n = 6). Student’s t‑test, *p < 0.05, **p < 0.01, ***p < 0.001. Ratio of MNP‑free and MNP‑loaded d Jurkat and e murine T cells in the LN exposed to an EMF to control LN (no EMF), 20 min after intravenous injection of the cell mixture into recipient mice, normalized to the input ratio. f Ratio of MNP‑free murine T cells, administered alone as control, in the LN exposed to an EMF to control LN (no EMF) after intravenous injection. Ratios of cell homing in magnet LN to no magnet LN (mean ± SD) are representative of three independent experiments [n = 4 (Jurkat cells), n = 6 (murine T cells)]. Student’s t‑test, *p < 0.05, **p < 0.01, ***p < 0.001
reduced in the popliteal LN when an EMF was applied (Fig. 9c, d). These could nonetheless be artefactual effects comparable to those detected in in vivo homing experi-ments (Fig. 7d–f) due to MNP transfer from MNP-loaded to MNP-free cells during inoculum preparation. It thus appears that MNP loading of T cells can promote cell retention in LNs and that circulation speed through the lymphoid organ can be reduced by EMF application.
Discussion
To evaluate the possibility of using MNPs to magneti-cally direct or retain T cells to a region of interest, we synthesized and characterized MNPs with coatings that provide different surface charges, and we have stud-ied their effects on T cell. The MNPs used in this study were produced by the coprecipitation method and had an average core diameter of 12.5 nm. FTIR spectra and DLS measurements confirmed coating procedure succeeded in creating monodispersed MNP preparations with dif-ferent surface charges. MNP treatment did not cause
any toxicity in the human T cell line Jurkat or in murine primary T cells in the conditions tested. MNP-treated murine primary T cells, however, presented a higher mitochondrial respiration and glycolysis. This could be associated with an activated state in T cells, since aero-bic glycolysis increases during the transition to effector T cells. Moreover, glycolytic catabolism is also associated with T cell functionalities such as Treg and memory T
cells [36].
Microscopy analysis showed that unlike macrophages, mesenchymal or malignant cells, which are able to inter-nalize different type of MNPs [11, 37–39], including the ones used in the present study (Additional file 1: Fig. S4) [40], T cells are apparently unable to do so. MNPs remain on the cell surface in close contact with cell membrane. T cells have typically low phagocytic capacity [41] with large nuclei and reduced cytoplasm, which could impair MNP entry inside the cytoplasm. Moreover, it has been also described that transfection of such cell types has always presented many difficulties and limitations, being
Fig. 8 Distribution of MNP‑free and MNP‑loaded murine primary T cells in the popliteal LN in the absence or the presence of an EMF. a SPIM images
of the popliteal LNs, 20 min after intravenous injection of a mixture of MNP‑free (yellow) and MNP‑loaded (green) murine T cells (ratio 1:1) into C57BL/6J recipient mice, exposed (right panel) or not (left panel) to an EMF. High endothelial venules (HEVs) are labelled in grey. b Quantification of the total transferred MNP‑free and MNP‑loaded murine T cells in SPIM images and the percentage of each cell type found in the absence or the presence of an EMF. Data are representative of 2 independent experiments
a really inefficient process [42–46]. The low endocytic capacity of lymphoid cells has been already reported [47,
48] and a special nanoparticle design is usually required to improve internalization by these nonphagocytic cells [49]. For example, some studies indicate that the uptake of NPs can be increased by coupling the NP to peptides or proteins, such as Tat protein of HIV, that exhibit a high permeability [50–52]. Microscopy analysis and cell-associated iron quantification showed that APS-MNPs were the MNPs most associated with T cells and they were therefore selected to perform subsequent magnetic retention experiments. DMSA-MNPs and DEXT-MNPs have negative and neutral charges respectively, whereas APS-MNPs are positively charged which probably favour their interaction with the negative potential of the cell membrane. There is a general tendency to assume that positively charged nanoparticles interact further with cell membranes, possibly due to electrostatic interactions
[53–60]. In this study, the positive MNPs (APS-MNPs) were the ones that interacted most with the membrane of the lymphoid cells, which correlates with what is described in the literature. Besides, some of the neutral and negative MNPs (DEXT- and DMSA-MNPs respec-tively) also interact but with smaller areas of the cell sur-face. This could be explained by the fact that, although cell membrane is, in general, negatively charged, it also presents areas with cationic sites allowing the binding of negatively charged NPs resulting in the clustering of the NPs around those domains [61].
Cytometric analyses of MNP-treated T cells showed that APS-MNPs caused no differences in the expres-sion levels of important cell surface markers such as CD62L, CD44, CD11a or CCR7 in Jurkat and primary T cell. These data are in consonance with previous reports showing that MNPs have no significant effect on the expression levels of surface markers of a variety of cells
Fig. 9 In vivo behaviour of MNP‑free and MNP‑loaded murine primary T cells in the popliteal LN in the absence or the presence of an EMF. a
Experimental set‑up of the 2PM assays, showing the exposure of the popliteal LN to the different EMF conditions. b Capture of the 2PM movies after intravenous injection of a mixture of 107 cells, differentially labelled MNP‑free (blue) and MNP‑loaded (red) murine T cells into C57BL/6J
recipient mice, in the absence of an EMF and in the presence of one or two magnets. HEVs are labelled in grey. c Quantification of cell speed in all conditions with Imaris software. Data (mean ± SD) are representative of two or three independent experiments. Student’s t‑test, *p < 0.05, **p < 0.01, ***p < 0.001. d Summary of the analyses of 2PM movies. Ratio (%) of unloaded to MNP‑loaded cells and cell speed (mean ± SD) in the popliteal LN are representative of two or three independent experiments
[62–66]. MNPs can trigger cellular activation in some cases [39, 67, 68] but this is mostly due to the nanoparti-cle design [69].
Chemotaxis is critical to T cell biology as it guides T cell movement across tissues and to the regions where their activity is required. MNP loading slightly decreased chemotactic responses. Our data nonetheless indicate that the adequate application of an EMF could correct this defect, probably because the magnetic gradient facil-itated the migration of these MNP-loaded cells. Similar results are reported in dendritic cells [12, 66], which indi-cate that MNP loading of immune cells could affect their chemotaxis. One of the main concerns of the present study was to evaluate the capacity of a magnetic field to promote the retention of MNP-loaded T cells in the pres-ence of flow forces similar to the ones found in blood ves-sels. Our results showed that a minimal amount of MNPs was required for T cells to be retained by an EMF. This magnetic retention increases with the amount of MNPs associated to the cells as well as with the magnetic field magnitude. Other studies also reported that these two parameters are critical for this magnetic targeting to occur [70, 71].
The in vivo analysis of T cell homing capacity in the presence or absence of MNPs revealed a higher amount of MNP-loaded T cells retained in the LNs, indicating that the presence of MNPs on the surface of T cells could increase by itself their retention in SLOs. MNP-loaded cells, however, did not show any preferential location or distribution for a specific SLO. The preferential accumu-lation of MNP-loaded T cells in lymphoid tissues even in the absence of a magnetic field has the potential to favour T cell interactions with accessory cells in these organs where T cell activation occurs. This property of MNP-loaded T cells could be used to promote T cell responses to specific antigens as well as to modulate the immune response in a pathological context. For example, for therapies based on adoptive transfer of regulatory T cells (T regs), approaches enhancing the LN trafficking and retention of these T regs could be beneficial to pre-vent immune-mediated diseases [72]. The strategic LN enrichment of antigen-specific T regs is crucial in con-trolling autoreactive effector T cells (T effs) and autoim-munity [73, 74]. For instance, it has been described that the accumulation of regulatory T cells in a LN near an ovary, counteracts the pathogenic immune response that takes place during ovarian autoimmune disease, inhib-iting therefore its development [74]. Besides, there are studies showing that the recirculation of T regs in mes-enteric LNs contributes to the downregulation of intes-tinal inflammation [75], that their accumulation in the
draining LN of the lung correlates with the resolution of chronic asthma in murine models [76] and also that the migration of T regs to specific draining LNs is required to suppress the alloimmune response [77] and is capa-ble to induce suppression of arthritis [78]. Therefore, the modulation of T cell trafficking could have interest in the treatment of autoimmune diseases. This preferential accumulation of MNP-loaded T cells in lymphoid tis-sues was also confirmed in the SPIM analyses of the LNs. There are some reports that analyse the biodistribution of MNP-labelled cells in different organs at short time points by magnetic resonance imaging [79–81]. Dodd et al. showed that most of naïve and memory T cells migrated to the spleen and LNs but also to the lungs and liver after adoptive transfer [81]. It is also described that in a tumour model, MNP-labelled CD8+ T cells
accumu-lated preferentially in the spleen and lymphoid tissues as well as in the tumour but also in the liver and in the lung [79, 80]. In this in vivo analysis, the application of an EMF favoured the retention of MNP-loaded transferred cells in the LN exposed to the magnet, indicating that, after reaching the LN, more MNP-loaded T cells were retained due to the presence of the EMF. Similar results have been obtained using other different cell types and regions of interest [12, 18, 38, 65, 66, 71, 82]. Our results reinforce the idea of magnetic targeting as a way to improve spe-cific cell accumulation and extend its application to T lymphocytes, a relatively unexplored field.
Two-photon microscopy intravital in vivo behaviour of MNP-loaded T cells in the popliteal LNs confirmed the increased retention of MNP-loaded T cells in lym-phoid organs and revealed a 10% reduction in their speed compared to MNP-free T cells. The increased reten-tion of MNP-loaded T cells in lymphoid organs even in the absence of EMF (Fig. 7b, c) could thus be due to a reduced circulating speed that would prolong cell inter-action with lymphoid tissue vasculature and facilitate retention. Unexpectedly, the speed of both MNP-loaded and –free T cells was reduced when applying an EMF. This could be partly due to the interaction between loaded and unloaded cells in the mixture prior to inocu-lation as previously demonstrated (Fig. 7d–f), resulting in the transfer of some MNPs to the unloaded T cells. Addi-tionally, it has been previously described that cells associ-ated with MNPs present a greater tendency to aggregate [83], so MNP-loaded cells could probably interact further with other surrounding cells, treated or not with MNPs. Alternatively, moderate static magnetic fields can influ-ence biological systems, mostly due to alterations of the transmembrane ion flux and the membrane phospholip-ids [84–86]. Preliminary calcium imaging assays did not
show significant alterations in calcium fluxes, essential for T cell functionality, neither in the maximum response nor the time to achieve it, in the presence of MNP in the case of Jurkat cells (Additional file 1: Fig. S5a, c). Murine T cells, however, showed a decrease in both, the maxi-mum response and the mean response after MNP load-ing (Additional file 1: Fig. S5b, d). Further studies would be needed to confirm this finding and determine its bio-logical significance. Biobio-logical effects supposedly depend more on the magnitude of the magnetic field gradient than on its strength [87]. This could explain the increased reduction in cell speed obtained in intravital experi-ments when two magnets were placed over the popliteal LN. This reduced speed could also have some interest. It has been reported that the duration of the interaction between dendritic cells and T cells in the LNs affects the specificity and potency of the T cell responses [88–91]. The decrease in the speed of T cells in the LN could serve to favour their interaction with the dendritic cells and the generation of more powerful T cell responses with a greater affinity. Cell path analysis in these experi-ments indicated that MNP loading does not influence the lymphocyte trajectory inside de LN when an EMF is applied, although further analysis over longer time peri-ods and with increased EMF strength could be necessary to detect trajectory changes due to the complex tissue architecture of LN. Some of these effects could also be masked by MNP transfer to unloaded cells during inocu-lum preparation.
Conclusions
T lymphocyte migration is a strongly regulated pro-cess, essential in the development of potent and effec-tive immune responses against different antigens. In the present study, we successfully show that the use of MNPs and EMFs can guide and retain T lymphocytes to a tar-get region of interest without critically affecting crucial biological aspects of these cells. We demonstrate that MNP-loaded murine T cells can be magnetically retained in the LNs, which could be useful to modulate immune response in a pathological context. This strategy could potentially be applied to other regions of interest, such as a tumour, to enhance the antitumoral immune response led by activated T cells.
Thus, our study describes an interesting and affordable approach to promote T cell retention that could be imple-mented in adoptive cell transfer therapies. This magnetic manipulation of T cell localisation could help improve their efficacy in autoimmunity and cancer treatment.
Additional files
Additional file 1: Fig. S1. Metabolic phenotype of murine primary T cells after MNP treatment. Fig. S2. MNP dose‑dependent in vitro retention of MNP‑loaded Jurkat cells. Fig. S3. MNP‑free and ‑loaded T cells’ trajectories inside de LN in the absence or the presence of an EMF. Fig. S4. MNP subcellular localisation in the murine macrophage RAW264.7 cell line. Fig.
S5. Calcium fluxes after MNP treatment.
Additional file 2: Movie S1. Image sequence showing MNP‑free T cells (green) in flow chamber assays before and after the application of an EMF in the upper part of the chamber.
Additional file 3: Movie S2. Image sequence showing MNP‑loaded T cells (green) in flow chamber assays before and after the application of an EMF in the upper part of the chamber.
Additional file 4: Movie S3. 2PM image sequence showing MNP‑free murine T cells (blue) and MNP‑loaded murine T cells (red) at early time points after t cell transfer in the popliteal LN, in the absence of an EMF. Bar, 20 µm.
Additional file 5: Movie S4. 2PM image sequence showing MNP‑free murine T cells (blue) and MNP‑loaded murine T cells (red) at early time points after t cell transfer in the popliteal LN, in the absence of a single EMF. Bar, 20 µm.
Additional file 6: Movie S5. 2PM image sequence showing MNP‑free murine T cells (blue) and MNP‑loaded murine T cells (red) at early time points after t cell transfer in the popliteal LN, in the presence of a double EMF. Bar, 20 µm.
Authors’ contributions
DFB and LSO designed the study. JVS helped with the design of the in vivo experiments. LSO conducted the experiments, and collected and analyzed the data. AM helped with the in vivo experiments. DFB, JMR, JVS and LSO analyzed the results. YP performed the assays with the murine macrophage line. DFB and LSO prepared the manuscript. DFB, JMR, JVS and LSO revised the manuscript. All authors read and approved the final manuscript.
Author details
1 Department of Immunology and Oncology, and NanoBiomedicine Initiative, Centro Nacional de Biotecnología (CNB)‑CSIC, Darwin 3, Cantoblanco 28049, Madrid, Spain. 2 Theodor Kocher Institute, University of Bern, 3012 Bern, Switzerland. 3 Present Address: Animal Health Research Centre (CISA)‑INIA, Instituto Nacional de Investigación y Tecnología Agraria y Alimentaria, Valdeol‑ mos 28130, Madrid, Spain. 4 Present Address: Section of Medicine, Depart‑ ment of Oncology, Microbiology and Immunology, University of Fribourg, 1700 Fribourg, Switzerland.
Acknowledgements
The authors thank M.P. Morales and her group at the Instituto de Ciencia de Materiales de Madrid (ICMM) for continuous support and help with the synthesis and characterization of the magnetic nanoparticles, our technician S. Pérez‑Yagüe for excellent support, and A.I. Checa and J.M. Frade (CNB‑CSIC, Madrid) for help with the flow chamber assays. We would also like to thank the CNB confocal microscopy service, the CNB flow cytometry service, and the CNB transmission electron microscopy service for their technical support. This work benefitted from microscopy setups of the “Microscopy Imaging Center” of the University of Bern. The authors also want to thank A. Marcos, F. Thelen and J. Abe (Theodor Kocher Institute) for their constant technical support in the in vivo imaging assays.
Competing interests
The authors declare that they have no competing interests.
Availability of data and materials
All data generated or analysed during this study are included in this published articles and its additional files.
Consent for publication
Not applicable.
Ethics approval and consent to participate
The procedures involving animal work at CNB‑CSIC were approved by the Eth‑ ics Committee for Animal Experimentation at the CSIC and by the Division of Animal Protection of the Comunidad de Madrid in compliance with national and European Union legislation. The procedures involving animal work at the Theodor Kocher Institute, University of Bern were approved by the Cantonal Committee for Animal Experimentation and were conducted according to federal and cantonal guidelines.
Funding
This work was supported in part by Grants from the Spanish Ministry of Economy, Industry and Competitiveness (SAF‑2014‑54057‑R and SAF‑2017‑ 82223‑R to DFB). L. Sanz‑Ortega and Y. Portilla receive predoctoral FPU Grants (FPU13/05037 and FPU15/06170 respectively) from the Spanish Ministry of Economy, Industry and Competitiveness; J.M. Rojas was supported by a JAE‑ doc Grant co‑financed by the CSIC and the European Social Foundation.
Publisher’s Note
Springer Nature remains neutral with regard to jurisdictional claims in pub‑ lished maps and institutional affiliations.
Received: 24 October 2018 Accepted: 3 January 2019
References
1. Caspi RR. Immunotherapy of autoimmunity and cancer: the penalty for success. Nat Rev Immunol. 2008;8(12):970–6.
2. Rosenberg SA, Restifo NP. Adoptive cell transfer as personalized immuno‑ therapy for human cancer. Science. 2015;348(6230):62–8.
3. Rosenberg SA, Restifo NP, Yang JC, Morgan RA, Dudley ME. Adoptive cell transfer: a clinical path to effective cancer immunotherapy. Nat Rev Cancer. 2008;8(4):299–308.
4. Kohl U, Arsenieva S, Holzinger A, Abken H. CAR T cells in trials: recent achievements and challenges that remain in the production of modified T cells for clinical applications. Hum Gene Ther. 2018;29(5):559–68. 5. Chu F, Cao J, Neelalpu SS. Versatile CAR T‑cells for cancer immunotherapy.
Współczesna Onkologia. 2018;2018(1):73–80.
6. Bluestone JA, Buckner JH, Fitch M, Gitelman SE, Gupta S, Hellerstein MK, et al. Type 1 diabetes immunotherapy using polyclonal regulatory T cells. Sci Transl Med. 2015;7(315):315ra189.
7. Desreumaux P, Foussat A, Allez M, Beaugerie L, Hebuterne X, Bouh‑ nik Y, et al. Safety and efficacy of antigen‑specific regulatory T‑cell therapy for patients with refractory Crohn’s disease. Gastroenterology. 2012;143(5):1207–17.
8. Brunstein CG, Miller JS, Cao Q, McKenna DH, Hippen KL, Curtsinger J, et al. Infusion of ex vivo expanded T regulatory cells in adults transplanted with umbilical cord blood: safety profile and detection kinetics. Blood. 2011;117(3):1061–70.
9. Yee C. Adoptive T cell therapy: addressing challenges in cancer immuno‑ therapy. J Transl Med. 2005;3(1):17.
10. Arruebo MF, Ibarra MR, Santamaría J. Magnetic nanoparticles for drug delivery applications. Nano Today. 2007;2(3):22–32.
11. Mejias R, Perez‑Yague S, Gutierrez L, Cabrera LI, Spada R, Acedo P, et al. Dimercaptosuccinic acid‑coated magnetite nanoparticles for magneti‑ cally guided in vivo delivery of interferon gamma for cancer immuno‑ therapy. Biomaterials. 2011;32(11):2938–52.
12. Jin H, Qian Y, Dai Y, Qiao S, Huang C, Lu L, et al. Magnetic enrichment of dendritic cell vaccine in lymph node with fluorescent‑magnetic nanoparticles enhanced cancer immunotherapy. Theranostics. 2016;6(11):2000–14.
13. Muthana M, Kennerley AJ, Hughes R, Fagnano E, Richardson J, Paul M, et al. Directing cell therapy to anatomic target sites in vivo with magnetic resonance targeting. Nat Commun. 2015;6:8009.
14. Landazuri N, Tong S, Suo J, Joseph G, Weiss D, Sutcliffe DJ, et al. Magnetic targeting of human mesenchymal stem cells with internalized superpara‑ magnetic iron oxide nanoparticles. Small. 2013;9(23):4017–26.
15. Riegler J, Wells JA, Kyrtatos PG, Price AN, Pankhurst QA, Lythgoe MF. Targeted magnetic delivery and tracking of cells using a magnetic reso‑ nance imaging system. Biomaterials. 2010;31(20):5366–71.
16. Kyrtatos PG, Lehtolainen P, Junemann‑Ramirez M, Garcia‑Prieto A, Price AN, Martin JF, et al. Magnetic tagging increases delivery of circulating progenitors in vascular injury. JACC Cardiovasc Inte. 2009;2(8):794–802. 17. Arbab AS, Jordan EK, Wilson LB, Yocum GT, Lewis BK, Frank JA. In vivo
trafficking and targeted delivery of magnetically labeled stem cells. Hum Gene Ther. 2004;15(4):351–60.
18. Jang ES, Shin JH, Ren G, Park MJ, Cheng K, Chen X, et al. The manipulation of natural killer cells to target tumor sites using magnetic nanoparticles. Biomaterials. 2012;33(22):5584–92.
19. Krummel MF, Bartumeus F, Gerard A. T cell migration, search strategies and mechanisms. Nat Rev Immunol. 2016;16(3):193–201.
20. Benechet AP, Menon M, Xu D, Samji T, Maher L, Murooka TT, et al. T cell‑intrinsic S1PR1 regulates endogenous effector T‑cell egress dynamics from lymph nodes during infection. Proc Natl Acad Sci USA. 2016;113(8):2182–7.
21. Schwab SR, Cyster JG. Finding a way out: lymphocyte egress from lym‑ phoid organs. Nat Immunol. 2007;8(12):1295–301.
22. Ley K. The second touch hypothesis: T cell activation, homing and polarization [version 1; referees: 1 approved, 3 approved with reserva‑ tions]. F1000Research. 2014;3:37. https ://doi.org/10.12688 /f1000 resea rch.3‑37.v1.
23. Fu H, Wang A, Mauro C, Marelli‑Berg F. T lymphocyte trafficking: mol‑ ecules and mechanisms. Front Biosci. 2013;18:422–40.
24. Massart R. Preparation of aqueous magnetic liquids in alkaline and acidic media. IEEE Trans Magnet. 1981;17(2):1247–8.
25. Luengo Y, Nardecchia S, Morales MP, Serrano MC. Different cell responses induced by exposure to maghemite nanoparticles. Nanoscale. 2013;5(23):11428–37.
26. Susaki EA, Tainaka K, Perrin D, Kishino F, Tawara T, Watanabe TM, et al. Whole‑brain imaging with single‑cell resolution using chemical cock‑ tails and computational analysis. Cell. 2014;157(3):726–39.
27. Abe J, Ozga AJ, Swoger J, Sharpe J, Ripoll J, Stein JV. Light sheet fluores‑ cence microscopy for in situ cell interaction analysis in mouse lymph nodes. J Immunol Methods. 2016;431:1–10.
28. Moalli F, Cupovic J, Thelen F, Halbherr P, Fukui Y, Narumiya S, et al. Thromboxane A2 acts as tonic immunoregulator by preferential disruption of low‑avidity CD4+ T cell‑dendritic cell interactions. J Exp Med. 2014;211(13):2507–17.
29. Villanueva A, Canete M, Roca AG, Calero M, Veintemillas‑Verdaguer S, Serna CJ, et al. The influence of surface functionalization on the enhanced internalization of magnetic nanoparticles in cancer cells. Nanotechnology. 2009;20(11):115103.
30. Gutierrez L, Romero S, da Silva GB, Costo R, Vargas MD, Ronconi CM, Serna CJ, Veintemillas‑Verdaguer S, Del Puerto Morales M. Degradation of magnetic nanoparticles mimicking lysosomal conditions followed by AC susceptibility. Biomed Tech (Berl). 2015;60(5):417–25. 31. Debes GF, Arnold CN, Young AJ, Krautwald S, Lipp M, Hay JB, et al.
Chemokine receptor CCR7 required for T lymphocyte exit from periph‑ eral tissues. Nat Immunol. 2005;6(9):889–94.
32. Campbell JJ, Butcher EC. Chemokines in tissue‑specific and micro‑ environment‑specific lymphocyte homing. Curr Opin Immunol. 2000;12(3):336–41.
33. Shapiro B, Dormer K, Rutel IB. A two‑magnet system to push therapeu‑ tic nanoparticles. AIP Conf Proc. 2010;1311(1):77–88.
34. Il’yashenko EI, Glebov AV, Skjeltorp AT, Johansen TH. Permanent magnet systems with a strong stray magnetic fields and very high gradients for material separation. Phys Status Solidi. 2006;203(7):5. 35. Forster R, Braun A, Worbs T. Lymph node homing of T cells and den‑
dritic cells via afferent lymphatics. Trends Immunol. 2012;33(6):271–80. 36. Buck MD, O’Sullivan D, Pearce EL. T cell metabolism drives immunity. J
Exp Med. 2015;212(9):1345–60.
37. Ottersbach A, Mykhaylyk O, Heidsieck A, Eberbeck D, Rieck S, Zim‑ mermann K, et al. Improved heart repair upon myocardial infarction: combination of magnetic nanoparticles and tailored magnets strongly increases engraftment of myocytes. Biomaterials. 2018;155:176–90.
![Fig. 3 MNP subcellular localisation in Jurkat and murine primary T cells. a Representative images of Jurkat and murine T cells after MNP treatment acquired by confocal microscopy [cell membrane (red), MNPs (gray) and nuclei (blue)] (scale bar = 10 μm)](https://thumb-eu.123doks.com/thumbv2/123doknet/14821855.615941/8.892.85.808.132.736/subcellular-localisation-representative-treatment-acquired-confocal-microscopy-membrane.webp)