DOI 10.1007/s00421-014-2939-1 OrIgInAl ArtIclE
Energy expenditure of extreme competitive mountaineering
skiing
Caroline Praz · Bertrand Léger · Bengt Kayser
received: 25 April 2014 / Accepted: 13 June 2014 / Published online: 5 July 2014 © Springer-Verlag Berlin Heidelberg 2014
Conclusions Energy expenditure and energy deficit of a multi-hour ski mountaineering race are very high and energy intake is below recommendations.
Keywords Endurance · Energy balance · Altitude · Skiing Abbreviations
AcSM American college of Sport Medicine Ec Energy cost
EE Energy expenditure Hr Heart rate
Hrmax Maximal heart rate Hrmod Modified heart rate Hrres Heart rate reserve
MEt Metabolic equivalent of task mvert Vertical meter
s1 Speed 1 s2 Speed 2
s3 Speed 3
SD Standard deviation VO2 Oxygen consumption
VO2max Maximal oxygen consumption
vt2 Ventilatory threshold 2
Introduction
Ski mountaineering for leisure and competition has become popular in alpine countries over the past dec-ades. It consists of ascending snow-covered slopes on skis with special bindings that allow pivoting at the toe, letting the heel free when climbing, and fixing it when skiing down hill. For climbing, adhesive nylon or mohair skins are attached under the skis, preventing sliding backward.
Abstract
Purpose Multi-hour ski mountaineering energy balance may be negative and intake below recommendations. Methods Athletes on the ‘Patrouille des Glaciers’ race-courses (17 on course Z, 27 km, +2,113 m; 11 on course A, 26 km, +1,881 m) volunteered. Pre-race measurements included body mass, stature, VO2max, and heart rate (Hr) vs VO2 at simulated altitude; race measurements Hr, altitude, incline, location, and food and drink intake (A). Energy expenditure (EE) was calculated from altitude corrected Hr derived VO2.
Results race time was 5 h 7 min ± 44 min (mean ± SD, Z) and 5 h 51 min ± 53 min (A). Subjects spent 19.2 ± 3.2 MJ (Z), respectively, 22.6 ± 2.9 MJ (A) during the race. Energy deficit was −15.5 ± 3.9 MJ (A); intake covered 20 ± 7 % (A). Overall energy cost of locomotion (Ec) was 9.9 ± 1.3 J m−1 kg−1 (Z), 8.0 ± 1.0 J m−1 kg−1
(A). Uphill Ec was 11.7 ± 1 J m−1 kg−1 (Z, 13 % slope)
and 15.7 ± 2.3 J m−1 kg−1 (A, 19 % slope). race A
sub-jects lost −1.5 ± 1.1 kg, indicating near euhydration. Age, body mass, gear mass, VO2max and Ec were significantly correlated with performance; energy deficit was not.
communicated by Michael lindinger. c. Praz · B. Kayser (*)
Institute of Sports Sciences and Department of Physiology, Faculty of Biology and Medicine, University of lausanne, géopolis, campus Dorigny, 1015 lausanne, Switzerland e-mail: bengt.kayser@unil.ch
c. Praz · B. léger
Institute for research in rehabilitation, Suvacare rehabilitation clinic, Sion, Switzerland
there are several types of ski mountaineering races: individual, team (team members must stay together), relay (team members relay each other), vertical (uphill only), sprint and long distance races. the main differences are the total vertical and horizontal distances covered and the dis-tribution of downhill and uphill sections. team events alter-nate several steep ascents with downhill sections (ISMF 2012–2013, http://www.ismf-ski.org). During transitions skins are quickly removed or applied, and the bindings changed to the uphill or downhill position, respectively. Downhill sections are mostly ‘off-piste’, where the snow is not groomed, while uphill sections are usually prepared with two parallel trails to allow overtaking. In addition to uphill and downhill sections on skis, there can be running, walking and steep climbing sections, with skis fastened on the backpack, and flat sections where the athlete adopts a cross-country skate skiing-like movement. team races are often several hours long. Most of the time, two or three par-ticipants make up a team. Athletes must carry most of their liquid and solid food on them, as there generally are few if any food and drink stations along the racetrack.
Few studies have been carried out on ski mountain-eering. tosi et al. (2009) estimated the energy cost (Ec) of ski mountaineering on packed snow (slope 21 %) and described Ec variations with speed and ankle load. they also reported that the effect of ankle load on Ec is negli-gible for recreational skiers but relevant for elite skiers, explaining the on-going quest for lighter ski boots and skis in competition. In a second study they measured Ec on a motorized treadmill using roller skis (tosi et al. 2010) and showed that locomotor efficiency depends on speed, with the skiers self-selecting a speed minimizing Ec. Duc et al. (2011) studied the physiological demand during an actual ski mountaineering race. they chose an individual race, shorter than most team races, with a series of uphill and downhill sections (mean duration 1 h 40 min ± 11 min). they showed that such type of ski mountaineering race is very strenuous, due to the large fraction of time spent around the respiratory compensation threshold. Diaz et al. (2010) reported a negative energy balance during a 2-day ski mountaineering competition accompanied by signs of increased oxidative stress, but did not actually measure energy expenditure.
to infer more about long duration ski mountaineering races we must refer to events of similar duration in other endurance sports like ultra-marathon and trail running, cycling or cross-country skiing. For team ski-mountaineer-ing races, like for other types of endurance sports of long duration, EE is expected to be very high and energy intake low. this would imply a large energy deficit and the guide-lines of the AcSM (rodriguez et al. 2009) for endurance sports, 0.7 g carbohydrates kg−1 h−1, might not be met
(Diaz et al. 2010) although carbohydrate ingestion during
exercise is known to improve performance during endur-ance events (Jeukendrup 2011). In endurance sports with races lasting several hours there is also risk for excessive dehydration. the guidelines of the AcSM indicate that endurance athletes should limit body mass losses from sweating to 2–3 % of body mass (rodriguez et al. 2009; Jeukendrup 2011). Kruseman et al. (2005) found a weight loss of 4.5 ± 1.5 kg in runners after participating in a mountain marathon lasting 7 h, mostly from loss of water. We expected that a multi-hour ski mountaineering race would also lead to significant dehydration.
In order to better describe the physiological demand of ski-mountaineering and predictors of race results we there-fore set out to measure Ec and EE in participants to a com-petitive extreme ski mountaineering race in the Swiss Alps, ‘La Patrouille des Glaciers’, combining laboratory indirect calorimetry test results with Hr monitoring during the race. We tested the following hypotheses: (1) athletes’ EE is very high and only partly covered by energy intake; (2) athletes develop significant dehydration (>3 % body mass); (3) race performance is function of age (lara et al. 2014), low altitude aerobic capacity, fractional use of Hr reserve (Hrres), body and racing gear weight (tosi et al. 2009) and technical competences for uphill and down-hill skiing [linked to Ec (tartaruga et al. 2013)].
Methods
the protocol of the study was approved by the Valais research ethics committee (ccVEM 033/11). Each partici-pant gave informed written consent prior to participate to the study.
the race
the study was conducted during the ‘Patrouille des Gla-ciers’ (http://www.pdg.ch) held on 25, 26, 27 and 28 April 2012. the ‘Patrouille des Glaciers’ is the most famous and popular ski mountaineering race in Switzerland with 1,450 selected teams of three skiers each that must stay grouped at all times. the worlds best ski mountaineering athletes participate in the race. the race consists of different types of locomotion: running, walking, and steep climbing on foot, ascent on skis with adhesive skins applied, alpine ski-ing style descents, and cross-country skatski-ing-like skiski-ing.
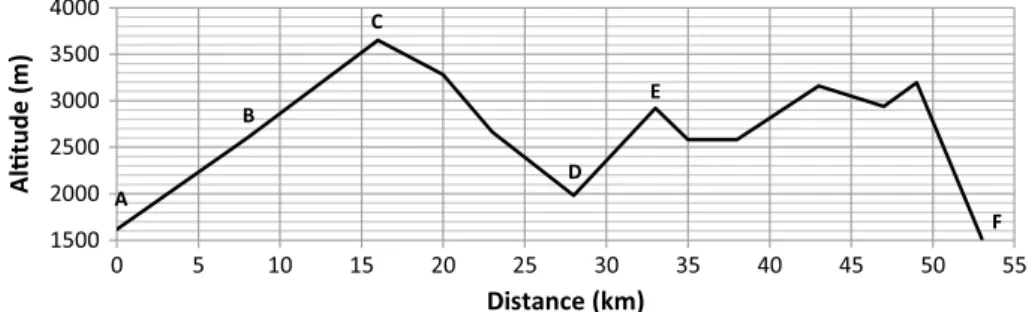
there are two official race routes, one from Zermatt to Verbier (race Z; distance 53 km; altitude differences +3,994 and −4,090 m; maximal altitude 3,650 m) and one from Arolla to Verbier (race A, distance 26 km; altitude dif-ferences +1,881 and −2,341 m; maximal altitude 3,160 m) (Fig. 1) and two races on separate days for each race route. In 2012 due to high avalanche danger one start of each race
route was cancelled. Half the participants of the race A could race normally and half the participants of the race Z could race but were stopped after 27 km (instead of 53) and 2,113 m ascent and 1,749 m descent. this change of race-track Z was not known at the start of the race; participants were only informed when stopped in Arolla.
the modified route of the race Z consisted of a 16 km uphill section followed by an 11 km downhill section. the first part of the uphill section was covered walking or run-ning with the skis attached to the backpack. then the par-ticipants put their skis with adhesive skins on and walked up on skis. We analysed separately this uphill section where the athletes used their skis mounted with skins (distance 8 km, mean slope 13 %). the route of the race A began with an ascent section (distance 5 km, mean slope 19 %) that we also analysed separately. then there were an uphill section, a flat section, an uphill section and the final down-hill. the athletes walked, ran, climbed on skis with skins applied, and skied downhill during the race.
the weather conditions at the start sites were: minimal temperature: 3 °c for the first race day and 10° for the sec-ond race day, maximal temperature: 14 and 19 °c; mean air humidity was 37 and 20 % and maximal wind speed 35 and 50 km h−1, respectively, while at 3,500 m, for the
two race days, minimal temperature, maximal temperature, air humidity and maximal wind speed were, respectively: −3 and 0 °c, −8 and −6 °c, 66 and 61 % and 70 and 59 km h−1.
Subjects
Seventy subjects were recruited (40 for the race Z and 30 for the race A); 28 subjects could be taken into account due to the cancellation of several races. they were all healthy and trained skiers. 17 (14 men, 3 women) took part in race Z and 11 (11 men) in race A. their mean ± SD age, height, body mass, body fat percentage and maximal oxygen consumption (VO2max) were, respectively, 41 ± 6 years,
177 ± 6 cm, 69 ± 9 kg, 12 ± 5 %, 60 ± 5 ml kg−1 min−1
for the race Z subjects and 30 ± 10 years, 178 ± 7 cm, 74 ± 8 kg, 15 ± 5 %, 54 ± 5 ml kg−1 min−1 for the race
A subjects. there were no significant differences between groups.
research design
the experimental protocol consisted of two visits to the laboratory prior to the race and measurements on race day. the aim of the first laboratory visit was to characterize the participants [anthropometry and aerobic fitness level (VO2max)]. the second visit allowed creating individual Hr-altitude-VO2 equations, which were then used to esti-mate EE from Hr and altitude measured during the race. Anthropometry and maximal test
Between 2 and 3 months prior to the race, anthropomet-ric features, body composition, VO2max and maximal Hr (Hrmax) were determined. Body fat percentage was meas-ured by air displacement plethysmography (BodPod, cos-med, Italy). the subjects performed a maximal running test on a motorized treadmill (HP cosmos Pulsar, germany) to determine VO2max and Hrmax. running was chosen because maximum exercise testing while walking/running uphill on skis with skins applied (uphill ski mountaineering) in the laboratory was technically too difficult for most athletes. running on a treadmill was assumed to involve a sufficiently similar muscle mass volume as ski mountaineering and most athletes used running for base training. After warm-up (3 min at 5.4 km h−1), speed was set at 7.2 km h−1 and increased by
1.8 km h−1 every 3 min without breaks between stages up
to voluntary exhaustion under strong verbal encouragement. the inclination of the treadmill was 0 %. gas exchange and breathing variables were measured breath-by-breath throughout with a metabolic measurement system (Meta-lyser, cortex, germany) and Hr with a portable Hr monitor
Fig. 1 racetrack of the Patrouille des Glaciers: A start of race Z, B
start of the separately analysed ski mountaineering uphill section of race Z, C finish of the separately analysed ski mountaineering uphill section of race Z, D finish of race Z after racetrack modification, start
of race A and start of the separately analysed ski mountaineering uphill section of race A, E finish of the separately analysed ski moun-taineering uphill section of race A and F scheduled finish of race Z and finish of race A
(Suunto t6d, Finland). the data obtained during the last 30 s of each step were considered for the analysis. the metabolic system was calibrated prior to each experimental session with a 3 l syringe and gases of known composition. the Hr results were analysed according to five exercise intensity zones to describe the intensity profile during the race: <60 % of the Hrres, between 60 and 70 % Hrres, between 70 and 80 % Hrres, between 80 and 90 % Hrres and >90 % Hrres, with Hrres defined as the difference between resting Hr and Hrmax (Achten and Jeukendrup 2003; gatterer et al. 2013;
Haddad et al. 2014; Vernillo et al. 2012). resting Hr was measured with the athlete standing quietly on the treadmill before the start of the VO2max test. As a second means for the quantification of exercise intensity we determined the venti-latory threshold 2 (vt2) with the V-slope method (Wasserman and McIlroy 1964).
Individual altitude corrected Hr-VO2 relationships
Between 2 and 4 weeks before the race, each subject per-formed a trial by ascending on skis on a motorized tread-mill with a slope set at 19 % (cosmed Venus, Italy). there were 12 stages at different speeds and simulated altitudes. the subjects were equipped with their own racing gear including clothes, skis, skins, boots, poles, helmet, back-pack, avalanche probe, snow shovel, avalanche transceiver, head lamp, food, drink, etc. (11.4 ± 2.6 kg). the purpose was to obtain individual altitude corrected Hr-VO2 rela-tionships for each participant in order to interpret the Hrs recorded during the race as metabolic rates. Since altitude exposure during the race is acute we exposed the subjects to acute simulated altitude, having the subjects breathe n2 -enriched air through a mask from a mixing bag continu-ously monitored for partial pressure of oxygen, equivalent to the desired altitude (Altitrainer, SMtec, Switzerland). At each altitude (500, 2,500, 3,500 m) the participants per-formed four 3 min stages: rest, speed 1 (s1), speed 2 (s2, estimated race pace) and speed 3 (s3). S2 was self-selected
by each subject s1 was 0.5 km h−1 slower than s 2 and s3
0.5 km h−1 faster than s
2. the total duration was 36 min for
the 12 stages. Between s1, s2 and s3 there was no break and the order of the stages was always the same for all the sub-jects. VO2 and Hr were measured and recorded in the same way as for the maximal test except that a portable indirect calorimetry system (Metamax, cortex, germany) was used. these measurements allowed us to draw up relationships with individual coefficients between Hr, altitude and VO2 for each subject.
Since Hr varied non-linearly with speed and simulated altitude, the data were fitted with exponential functions (1) in order to derive correction factors, which allowed cal-culating an equivalent low altitude Hr (Hrmod) from Hr measured at any altitude during the race (richalet 2012):
with y0 the y axis intercept, i.e., the Hr found at that given speed at 500 m and a and b determined individually for each subject.
then Hrmod was then linked to a VO2 (2).
with c and d determined individually for each subject (Key-tel et al. 2005; Wicks et al. 2011).
In addition, body fat percentage and mass were meas-ured again on this day to have values close to the race day. Day −4 to race day measurements
From day 4 before the race till pre-race meal, the partici-pants noted every food item or drink they consumed. On race day, 1 to 2 h prior to the departure, after voiding, the subjects were weighed with a scale (precision 100 g, Mio Star Body Balance, Melectronic, Migros, Switzerland), once in underwear only and once carrying complete race equipment, skis, boots and poles included (12.9 ± 3.0, 1.5 kg more than during the treadmill test).
race Hr was recorded beat-by-beat (t6d or Memory Belt, Suunto, Finland). For each team altitude was also continuously measured (t6d, Suunto, Finland). Each sub-ject collected the wrappings of all food items consumed during the race. Any liquid or food intake on the way other than that carried was noted.
the 11 subjects of six teams that reached their scheduled finish (race A) were weighed again with and without racing gear immediately upon arrival before they ate or drank any-thing. One athlete gave up because of injury, one was dis-qualified because his team was too slow and two could not be taken into account because their watch did not record Hr. the 15 others could not race because their start was cancelled. Upon arrival any food or drink items consumed during the race from other sources than the supplies carried were recorded by checking and discussing the notes of the participants and crosschecking the answers with the other team members. the subjects of the race Z were not taken into account for weight measurement and food intake because they did not reach the scheduled finish line and could not be weighted again and asked about eating and drinking.
Individual calibration equations relating Hr and alti-tude to VO2 obtained during simulated uphill skiing on the
treadmill were used to calculate VO2 at any time point dur-ing the race (Achten and Jeukendrup 2003). We estimated EE using a conversion factor of 20 kJ l O2−1 assuming an
average metabolic respiratory quotient of 0.8 represent-ing a mixed energy substrate includrepresent-ing use of fat mass energy reserves. Ec (J m−1 kg−1) was calculated with the
estimated EE (J) per mass unit (body mass+equipment (1) HRmod = HR − a(−altitude/b) +y0
(2) V O2 = c · HRmod +d
mass) (kg) divided by the absolute distance covered (m). Ec per vertical meter (mvert) was measured with the
esti-mated EE (J) per mass unit (body mass+equipment mass) (kg) divided by the altitude difference (m). We estimated metabolic equivalent of task (MEt), a measure express-ing the energy cost of physical activities in multiples of 4.184 kJ kg−1 h−1. the energy intake during the race was
calculated from the nutritive values indicated on the wrap-pings of the consumed food items (bars, gels, etc.) and using standard food tables. liquid intake was calculated as the watery part of all ingested food and drink.
Dehydration status was estimated according to the guidelines of AcSM that indicate that body mass losses from sweating should be limited to 2−3 % of body mass (rodriguez et al. 2009; Jeukendrup 2011).
Statistical analysis
For each group mean and standard deviation (SD) values were calculated for each variable. linear regressions were performed to verify the association between each variable and race performance (time). to assess the relative impor-tance of each variable a multiple linear regression was then performed including those variables that were significantly associated with performance in individual linear regres-sions. Differences were considered significant at an alpha level of 0.05 or smaller.
Results
race Z
Absolute best time of the Z race was 2 h 55 min. For the experimental subjects who participated in race Z mean race
time was 5 h 7 min ± 44 min (175 ± 25 % of the best time). Best female time was 3 h 31 min and our female subjects (1 patrol) took 4 h 9 min (118 %). the subjects spent 76 ± 1 % of race time going uphill and 24 ± 1 % downhill. Mean Hr was 156 ± 7 bpm, i.e., 75 ± 7 % of Hrres. going uphill Hr
was 76 ± 7 % of Hrres. Figure 2 shows the average (±SD)
distribution of time spent in the five intensity zones. the athletes spend 17 ± 23 % of the total time above vt2. the
mean total EE was 19.2 ± 3.2 MJ (3.4 ± 5 MJ h−1). the Ec
(EE/distance) for the whole race was 9.3 ± 1.2 J kg−1 m−1
and the Ec for the 8 km long 13 % uphill section was 11.7 ± 1.7 J kg−1 m−1 or 89.4 ± 12.6 J kg−1 m−1
vert, taking
into account the 11.6 ± 2.4 kg racing gear. the climbing speed for this section was 584 ± 76 mvert h−1 and the athletes
spent about 3.3 ± 0.5 MJ h−1 (12 ± 1 MEts). the uphill
section analysed consisted almost exclusively of ascent on skis equipped with skins, but all the types of locomotion are included in the energy values reported for the complete race. race A
Absolute best race time was 3 h 32 min. the mean race time of the study subjects in race A was 5 h 51 min ± 53 min (166 ± 25 % of best time). Mean Hr was 153 ± 8 bpm, i.e., 71 ± 4 % of Hrres. During the uphill section Hr was
82 ± 5 % of Hrres. the average (±SD) distribution of
time spent in the five intensity zones is shown in Fig. 2. the athletes spend 13 ± 20 % of the total time above vt2.
the mean total EE was 22.6 ± 2.9 MJ (3.5 ± 0.4 MJ h−1).
the Ec for the whole race was 8.0 ± 1.0 J kg−1 m−1
and the Ec for the 5 km and 19 % uphill section was 15.7 ± 2.3 J kg−1 m−1 or 86.5 ± 10.0 J kg−1 m−1
vert, taking
into account the 14.8 ± 2.7 kg equipment. the climbing speed for this section was 632 ± 104 mvert h−1 and the
ath-letes spent 3.8 ± 0.5 MJ h−1 (13 ± 2 MEts). Participants
Fig. 2 Exercise intensity
frac-tion of race time (in % of race time) in each intensity zone for race A and race Z: the distribu-tion of the intensity zones was similar for both races but the subjects of race Z started out expecting to complete a 53 km route and not only 27 km, there-fore they paced their race for a twice as long race as the race they finally did
ate and drank during the race for a total energy intake of 4.4 ± 1.3 MJ reaching 20 ± 7 % of the EE (Fig. 3) and a fluid intake of 1.8 ± 0.7 l. the mean weight loss was 1.5 ± 1.1 kg (2 ± 1 % of body mass). the energy intake of the pre-race breakfast was 3,056 ± 1,059 kJ. total energy intake (pre-race meal+intake during the race) thus reached 35 ± 12 % of race EE. During the 4 days before the race, they ate 10.6 ± 2.3 MJ day−1 (n = 9).
correlates of performance
Multivariate analysis showed positive associations between body mass, racing gear mass, body fat percentage, average Ec for the whole race, Ec of the uphill section, with race time, and a negative association between VO2max with race time (table 1).
Discussion
the main findings were that participants of an extreme competitive ski mountaineering race, ‘La Patrouille des Glaciers’, (1) developed an important energy deficit, which was only partly covered by energy intake en route (race A), (2) showed no significant dehydration despite 4–7 h of endurance effort at 12–13 ± 2 MEts and the need to dis-pose of up to 3 MJ of heat h−1 (climbing sections), and (3)
had a race performance which correlated to age, sex, body and gear mass, aerobic capacity and locomotor efficiency but not to liquid and energy intakes.
Energy expenditure
the energy requirement for a multi-hour ski mountain-eering race is very high with a mean EE in our study of
Fig. 3 Energy expenditure and energy intake comparison between
energy expenditure, energy intake and recommended energy intake (dotted line) for the 26 km race A. the total energy intake reached 20 ± 7 % of the EE Table 1 r esults of multi
variate analysis for performance
Best predictors of race time (multiple linear re
gression): age, mass and E
c
are positi
vely related with race time, while
V
O2max
w
as ne
gati
vely correlated with race time
t
here were not enough w
omen to consider the se
x performance relationship for race
A CI confidence interv al r ace Z r ace A c oefficient c I (95 %) p v alue Adjusted coef -ficient c I (95 %) c oefficient c I (95 %) p v alue Adjusted coefficient c I (95 %) Age (years) 0.07 (0.02; 0.11) 0.01 0.45 (0.07; 0.82) 0.03 (− 0.02; 0.07) 0.18 0.32 (− 0.23; 0.87) Sex − 1.00 (− 1.94; − 0.06) 0.04 − 0.55 (− 1.03; − 0.07) Mass (body + gear) (kg) 0.02 (− 0.3; − 0.07) 0.35 0.30 (− 0.29; − 0.89) 0.08 (0.02; 0.15) 0.02 0.92 (0.26; 1.58) V O2max (l × min − 1) − 0.49 (− 1.02; − 0.04) 0.07 − 0.50 (− 10.95; − 0.04) − 1.49 (− 2.87; − 0.11) 0.04 − 0.71 (− 1.31; −0.11) E c (J kg − 1 m − 1) 0.09 (− 0.15; 0.33) 0.43 0.20 (− 0.11; 0.52) 0.32 (− 0.11; 0.76) 0.12 0.51 (− 0.11; 1.13) c onstant 2.21 (− 1.46; 5.89) 0.21 − 9.3 × 10 − 10 (− 0.27; 0.27) 0.51 (− 7.42; 8.45) 0.87 (7.9 × 10 − 9 7.74) (− 0.47; 0.47)
11–26 MJ for exercise durations of 5–6 h. If the race Z had taken place normally, the duration would have been about twice so long and the EE twice as high, or about 35 MJ. A pilot study in 2010 on six men, of which three completed the whole race Z yielded 43.1 ± 0.6 MJ. In comparison, Kimber et al. (2002) showed that the EE for a triathlon ironman is 42.0 ± 3.9 MJ for men and 35.9 ± 4.2 MJ for women for durations similar to the scheduled dura-tion of the race Z of our study, without the mid-race stop. Saris et al. (1989) found that cyclists who participate in the tour de France have a mean daily EE of 25.4 MJ and reach 32.7 MJ on mountain days, again values similar to that of the modified race Z and of race A. cross-country skiers expend between 13 and 15 MJ for a 50 km race (Meyer et al. 2011). the environment of the latter sport is more similar to the environment of ski-mountaineering rac-ing than cyclrac-ing or triathlon, but the duration is shorter. A multi-hour ski mountaineering event therefore belongs to the category of extreme activities and can be considered as very strenuous and energy-demanding, with even higher intensities reached for races of shorter duration (Duc et al.
2011).
calculated over 24 h, race day energy expenditure can be estimated as 24.6 ± 3.9 MJ for the participants of the race Z and 28.9 ± 2.9 MJ for the participants of the race A, supposing that the athletes did not engage in signifi-cant other additional physical activity except participating to the race. this total daily expenditure was calculated by summing calculated basal metabolic rate considering sex, weight, stature and age [Black formula (Black et al. 1996)], physical activity induced energy expenditure and 10 % of total energy expenditure to take into account the thermic effect of food (Black et al. 1996). the physical activity level (PAl), defined as daily energy expenditure divided by basal metabolic rate, on race day thus amounted to 2.4 ± 0.4 for participants doing race Z and 3.0 ± 0.5 doing race A. the general population has a natural limit of sus-tainable daily energy turnover at a PAl of 2–2.5 that can
be maintained over several days (Westerterp et al. 1992). the high PAl values for non-elite athletes found for race A suggest that those subjects would probably not be able to maintain energy balance with time, as suggested also by the important energy deficit attained during the race.
the large muscle mass involved in this particular type of locomotion is a major reason why the EE is so high. Altitude also influences the EE. Since maximum aerobic capacity decreases with altitude, the absolute EE decreases, as athletes choose to exercise at similar relative intensity levels. In acclimatizing subjects basal metabolic rate was found higher compared to sea level (Meyer et al. 2011): at 4,300 m basal metabolic rate had increased by 10–17 % compared to sea level, presumably because of increased sympathetic activity (Mawson et al. 2000). Altitude was lower for our race (between 1,520 and 3,650 m) and expo-sure short, but it is conceivable that basal metabolic rate was somewhat increased. Furthermore, cold exposure linked to the alpine environment in winter also increases EE (Meyer et al. 2011).
Energy cost of locomotion
In general the energy cost of locomotion (Ec) is a prime determinant of performance for endurance type sports (di Prampero 1986) that can make the difference between two athletes with the same VO2max. the combination of a high aerobic capacity, a low Ec and the ability to main-tain a high fraction of aerobic capacity will allow better performance. In extreme ski mountaineering, global Ec involves several types of locomotion like running, walking, ascent on skis with skins applied, alpine skiing in descent, or cross-country skating-like skiing. this implies that the overall Ec is very dependent on the route of the particu-lar race and differs between races according to the frac-tion of the race spent in the different types of locomofrac-tion. Most of the time is generally spent climbing uphill on skis equipped with adhesive skins applied and the bindings in
Table 2 comparison between
studies
Ec in (J kg−1 m−1) of ski-mountaineering comparison between the values of the present study (race A and race Z) and the results of previous studies: Ec calculated for race A is the highest because of the steep gradient and the heavier load carried Uphill section of the race Z Uphill section of the race A tosi et al. (2009) Uphill sections (addition of 2) Duc et al. (2011) length (m) 8,000 5,000 500 7,070 Altitude difference (m) 1,050 933 105 1,315 Mean gradient (%) 13 19 21 18 Mean duration (h) 1.95 ± 0.26 1.51 ± 0.23 0.13 ± 0.01 1.4 ± 0.2 load (kg) 11.6 ± 2.4 14.8 ± 2.7 7 ± 1 ~4.5 Mean speed (km h−1) 4.2 ± 0.6 3.4 ± 0.6 3.9 ± 0.2 4.8 ± 0.9 Mean vertical speed (m h−1) 584 ± 76 632 ± 104 808 ± 48 896 ± 96 Ec (J kg−1 m−1) 11.7 ± 1.7 15.7 ± 2.3 10.6 ± 0.4 14.2 ± 2.5 Ec (J kg−1 m−1
open mode so that minimizing Ec in that particular mode has an important impact on overall energy cost. the Ec of the uphill sections we found can be compared with the results of other studies (table 2). the lowest Ec (tosi et al.
2009) was described for a short section lasting only 8 min while that of races lasting 1–2 h (Duc et al. 2011) up to 6 h 45 (this study) are higher. the Ec of the uphill section of race A had the highest Ec (15.7 ± 2.3 J kg−1 m−1); but the
load that the athletes carried was also the heaviest for this race, and the movement is likely less efficient while carry-ing heavier backpacks. Effect of mass is even more impor-tant on Ec per mvert as on Ec per m distance covered. the lower mean slope of the uphill section of the race Z thus probably also partly explains the lower Ec. Our subjects were slower than the subjects of Duc et al. (2011) probably because our race was much longer. the highest speed and vertical speed were reported by Duc et al. (2011) because they studied an actual race situation that was shorter than ‘La Patrouille des Glaciers’. like for walking there likely is an optimal gradient of path regarding Ec. the 13 % gra-dient of race Z is the less economical of the already tested gradients and the 21 % gradient of tosi et al. (2009) the most economical. these results suggest that the most eco-nomical gradient may be close to the optimal gradient for walking (25 %) (Minetti 1995). Variations of Ec of ski mountaineering with speed, slope, snow conditions (type and temperature of snow) are not known yet. the Ec that we calculated is only for a definite speed, load and gradient and cannot be generalized for all ski-mountaineering races. to assess the Ec of a given race it would be useful to know how the Ec changes with those factors.
Exercise intensity
the distribution of Hr in the intensity zones was similar for race A and Z (see Fig. 2). this was expected since the 2 routes were quite similar: 26 km for race A, 27 km for race Z, with altitude differences of +1,881 and −2,341 m for race A, and of +2,113 and −1,749 m for race Z. However, the subjects of race Z started out expecting to complete the originally scheduled route, 53 km long and double positive and negative altitude differences. the pace and intensity they chose were those they felt appropriate for a race twice as long as they finally completed. If we consider that the skiers who chose to participate in race Z, the longer and generally considered elite race, were well trained and expe-rienced skiers (their VO2max was 60.1 ± 7.5, 10 % higher as those participating in race A), we may speculate that they would have kept this intensity for the second part of the race if it had taken place. On the other hand, Hr may decrease with exercise duration and fatigue (Esteve-lanao et al. 2008), so if the subjects of the race Z had known from the departure that they would race for only 27 km, their Hr
might have been somewhat higher because of the higher intensity of a faster pace.
In an individual and shorter ski mountaineering race, the ‘Trace catalane’, Duc et al. (2011) found a mean per-centage of Hrmax of 93 ± 2 % but they used percentage of Hrmax and not percentage of Hrres. In the present study the
average percentage of Hrmax amounted to 81 ± 2 % (race Z) and to 82 ± 4 % (race A). this is less than that reported by Duc et al. (2011). the difference is likely due to the race being much shorter (mean time of the ‘Trace Catalane’: 1 h 41 min ± 11 min).
In our study the distribution of time spent in the Hr zones, below and above vt2 was quite heterogeneous: some athletes spent more than half of race time above 90 % of Hrres whereas others spent more than 2/3 of race time below 70 % of Hrres; some athletes spent no time above the ventilatory threshold whereas other spent three quar-ters of the race time above this value. the likely reason is that ‘La Patrouille des Glaciers’ is a team event and that the three athletes of a patrol must stay together. If a team is made up of athletes of different performance capacity this will lead to intra-team differences for Hr. this makes inter-individual comparisons difficult but reflects the reality of most multi-hour ski mountaineering races that generally are team events. this team effect may also at least partly explain our finding of a modest influence of VO2max upon
race performance. Food and drink supply
the high EE we found should be associated with important food and drink intake during the race to at least partly bal-ance it. that is even truer in altitude where substrate utili-zation is modified. More blood glucose is used at rest and during exercise (Brooks et al. 1992). the high blood glu-cose utilization has no sparing effect on muscle glycogen; consequently, carbohydrate need is increased and exog-enous carbohydrate consumption during the race is likely of great importance.
the mean energy intake during race A from food and liquids was only 4.4 ± 1.3 or 7.1 ± 1.8 MJ with pre-race breakfast included. this implied an average energy defi-cit at the finish of the race of 18.2 ± 2.9 MJ, respectively, 13.4 ± 3.6 MJ. the recommendations of the AcSM for endurance sports are 0.7 g carbohydrates·kg−1 h−1, which
in our study amounted to an average value of 5.1 ± 0.9 kJ, and the recommendations were therefore not met by 14 %. But an energy deficit cannot be avoided during such races because the access to and capacity to eat and process food is limited (Diamond 1991). Apart from the practi-cal difficulties of eating while being engaged in sports, a physiological limiting step is the capacity of absorption of the small intestine. the sodium dependant transporters
of glucose (Sglt1) become saturated at a carbohydrate intake around 7 g × kg−1 h−1, the rate recommended by
the AcSM. nevertheless, even if all athletes had followed the recommendation, the deficit would have been 15.8 MJ (12.4 MJ, pre-race breakfast included) (rodriguez et al.
2009).
the subjects who finished the race A lost 1.5 ± 1.1 kg, i.e., 2 ± 1 % of their body mass. the guidelines (Jeuke-ndrup 2011) recommend that endurance athletes should attempt to minimize dehydration by limiting body mass loss through sweating to not more than 2−3 % of body mass. thus, our athletes followed the recommendations for rehydration. Knechtle et al. (2012) reported similar weight loss, 1.9 ± 1.4 kg, during a 100 km ultra-marathon. Kruse-man et al. (2005) reported a weight loss of 4.5 ± 1.5 kg during a 7 h 3 min ± 1 h 17 min mountain running mar-athon. the longer duration and the fact that the race took place in summer with higher temperatures can explain the higher losses than observed in our study.
the sweat loss and water need depend on the evapora-tion required to maintain heat balance at any given core temperature and on the maximal evaporative capacity of the environment. the first depends on skin and core tempera-ture and metabolic rate, and the second on clothing, envi-ronmental temperature, wind and humidity (gonzalez et al.
2009). For a winter mountain race like ‘La Patrouille des Glaciers’ the low temperatures and air dryness bring the sweat loss down compared to other events of same duration in warmer and more humid conditions. On race day, the air was dry and there was a lot of wind at altitude. In alti-tude diuresis is increased and thirst impaired (Kayser 1994; Meyer et al. 2011). Furthermore, respiratory water loss is greater in altitude than at sea level due to increased ventila-tion and low air humidity. respiratory water loss can be as high as 1.90 l day−1 for men (Butterfield et al. 1992) and
0.85 l day−1 for women (Mawson et al. 2000).
For races of such long duration, loss of body mass is not only function of dehydration but also due to use of energy substrate. At the end of a long race like ‘La Patrouille des Glaciers’, glycogen stores are mostly depleted, whereas they are generally full at the start since most athletes use nutritional strategies stocking up on glycogen reserve prior to major competitions. given that glycogen is stored with 3–4 parts of water per glucose unit, the oxidation of 500 g of glycogen (8,368 kJ) would have involved >1.5 kg weight loss. So it seems that our athletes were not much dehy-drated and it follows that their drinking habits can be con-sidered appropriate.
correlates of performance
like for other endurance sports, we found that age (lara et al. 2014), body and gear mass (tosi et al. 2009), VO2max
and Ec correlated with performance in multi-hour ski mountaineering racing. that was expected, and confirms that the great importance given by athletes to reduce the mass of their equipment is at least partly justified. How-ever, body mass cannot be neglected. Mass is especially important for sports with ascensions, like ski mountain-eering, because a great part of the energy consumption is used to overcome gravity (Ardigo et al. 2003; Saibene and Minetti 2003). the part of total energy consumption used against gravity (Potential energy/EE) were, respectively, 22 ± 3 and 18 ± 3 % for race Z and A.
the influence of the Ec showed that it is important to optimize ski mountaineering technique by specifically training this type of locomotion. training and experience influence Ec (Beneke and Hutler 2005). the more the ath-lete trains for a sport, the more economical he may become. the fraction of the time that the athletes spent for the way up and for the way down of the Z race was calculated. there was no correlation between the fraction of the time spent for the way up and performance. In fact, this fraction did not vary much from one person to another and shows that skiers who perform better on the way up also do better on the way down.
Limitations
Sea level aerobic capacity was measured 8–12 weeks before the race and changes in that period cannot be excluded. However, the individual altitude corrected Hr-VO2
rela-tionships were obtained more close (2–4 weeks) to the start of the race. Since there were similar Hr-VO2 relationships between the two tests at submaximal stages, we are confi-dent about the use of the Hr-VO2 relationship to transform
Hr on race day into VO2.
calorimetry would have been the most accurate method to measure EE and Ec. nevertheless the use of calorimetry for field activity is unfeasible. For indirect calorimetry, VO2
must be measured, which implies that participants wear a mask and a bulky metabolic testing system. to limit inter-ference with performance it is more practical to measure Hr with a thoracic belt and a watch, associating it with lab-oratory measured individual Hr-VO2 relationships, taking into account the effect of altitude, since Hr-VO2 relation-ships shift with increasing altitude. this method seemed to give us similar values compared with other studies.
the Hr-altitude-VO2 relationship was determined on a motorized treadmill with skis, skins, poles, etc., to be then used to interpret Hr collected on snow, assuming that this relationship is similar on treadmill and on snow. this seems a reasonable assumption since tosi et al. (2010) found sim-ilar Ec values on a treadmill and on snow (2009). the main difference is that tosi et al. used roller skis while normal
skis with skins were used in the present study. With roller skis on a treadmill the friction is perhaps lower than with skins on snow whereas with skis and skins on treadmill the friction may be higher than on snow.
Several factors might have influenced Hr during the race independently from oxygen consumption, such as the excitement of the race. In addition, cardiac drift (Esteve-lanao et al. 2008) during long-duration exercise may also have influenced Hr during the race. For a same intensity or speed Hr increases with time. So an increasing Hr does not always means an increasing speed, like a constant Hr does not always means a constant speed or intensity. the drift already begins after 10 min and is especially impor-tant for multi-hour exercises. We can estimate that the drift can increase Hr by about 10 bpm for a given intensity between start and finish of the race (about 5 h) (gimenez et al. 2013). the limited dehydration in our subjects and the relatively low air temperature probably limited the extent of cardiovascular drift (Montain and coyle 1992). During the downhill sections eccentric muscular activity may also have lead to an exaggerated Hr response (turnbull et al.
2009).
the race cancellations are clearly the most impor-tant limitation of this study. We lost more than half of the subjects. In addition, the remaining subjects became, by chance, less representative of the general population of par-ticipants. Almost all women could not start; the majority of our youngest and oldest subjects were also eliminated. But overall as many slow as fast subjects were lost. the effect of sex could thus not be evaluated for race A because there were no women who reached the finish, while the effect of sex in race Z is influenced by the fact that there was only one women’s patrol and this team was very fast. Moreo-ver, age was not any more evenly distributed for race A and the correlation between age and performance is therefore difficult to evaluate. Finally, the interruption of the race Z halfway made calculation of energy expenditure for the full race Z impossible and we could therefore only estimate it, while the exercise intensity chosen by the participants was likely lower than if the participants had known about the interruption.
Perspectives and conclusions
Multi-hour ski mountaineering racing requires a lot of energy (about 20 MJ for 5 h 30 min on average). this very high requirement is not balanced by energy intake in paral-lel, and the majority of the athletes do not fulfil the recom-mendations of AcSM for energy intake during endurance sports. On the other hand, dehydration may not be a major problem for this type of race since weight loss remains limited. the dry and cold high mountain environment in
winter conditions likely contributes to this. Exercise inten-sity is high, but heterogeneous because performance capac-ity between members in a team can vary. Age, low body and racing gear mass, high VO2max and low energy cost are significantly correlated with performance. Accordingly, ski mountaineering athletes should be advised to increase food intake during racing, adapt exercise intensity during train-ing accordtrain-ing to expected race intensity and beware of the importance of body and gear mass for performance.
Acknowledgments this study was supported by a grant from the
Swiss federal office for sports. We thank Philippe Vuistiner, Vin-cent Favre, Joachim Staub, Olivier Dériaz and the team of the Swiss Olympic Medical center of Sion for their excellent technical help. We are also very grateful to the subjects for their precious time in partici-pating in the study.
Conflict of interest there are no conflicts of interests.
References
Achten J, Jeukendrup AE (2003) Heart rate monitoring: applications and limitations. Sports Med 33:517–538
Ardigo lP, Saibene F, Minetti AE (2003) the optimal locomotion on gradients: walking, running or cycling? Eur J Appl Physiol 90:365–371. doi:10.1007/s00421-003-0882-7
Beneke r, Hutler M (2005) the effect of training on running econ-omy and performance in recreational athletes. Med Sci Sports Exerc 37:1794–1799
Black AE, coward WA, cole tJ, Prentice AM (1996) Human energy expenditure in affluent societies: an analysis of 574 doubly-labelled water measurements. Eur J clin nutr 50:72–92
Brooks gA et al (1992) Muscle accounts for glucose disposal but not blood lactate appearance during exercise after acclimatization to 4,300 m. J Appl Physiol (1985) 72:2435–2445
Butterfield gE, gates J, Fleming S, Brooks gA, Sutton Jr, reeves Jt (1992) Increased energy intake minimizes weight loss in men at high altitude. J Appl Physiol (1985) 72:1741–1748
di Prampero PE (1986) the energy cost of human locomotion on land and in water. Int J Sports Med 7:55–72. doi:10.105 5/s-2008-1025736
Diamond J (1991) Evolutionary design of intestinal nutrient: enough but not too much. news Physiol Sci 6(92):96
Diaz E et al (2010) cell damage, antioxidant status, and cortisol lev-els related to nutrition in ski mountaineering during a two-day race. J Sports Sci Med 9:338–346
Duc S, cassirame J, Durand F (2011) Physiology of ski moun-taineering racing. Int J Sports Med 32:856–863. doi:10.105 5/s-0031-1279721
Esteve-lanao J, lucia A, deKoning JJ, Foster c (2008) How do humans control physiological strain during strenuous endurance exercise? PloS One 3:e2943. doi:10.1371/journal.pone.0002943 gatterer H, Schenk K, Wille M, raschner c, Faulhaber M, Ferrari M,
Burtscher M (2013) race performance and exercise intensity of male amateur mountain runners during a multistage mountain marathon competition are not dependent on muscle strength loss or cardiorespiratory fitness. J Strength cond res 27:2149–2156. doi:10.1519/JSc.0b013e318279f817
gimenez P, Kerherve H, Messonnier lA, Feasson l, Millet gY (2013) changes in the energy cost of running during a 24-h tread-mill exercise. Med Sci Sports Exerc 45:1807–1813. doi:10.1249/ MSS.0b013e318292c0ec
gonzalez rr, cheuvront Sn, Montain SJ, goodman DA, Blanchard lA, Berglund lg, Sawka Mn (2009) Expanded prediction equa-tions of human sweat loss and water needs. J Appl Physiol (1985) 107:379–388. doi:10.1152/japplphysiol.00089.2009
Haddad M, chaouachi A, del Wong P, castagna c, Hue O, Impel-lizzeri FM, chamari K (2014) Influence of exercise intensity and duration on perceived exertion in adolescent taekwondo athletes. Eur J Sport Sci 14(Suppl 1):S275–S281. doi:10.1080/17461391. 2012.691115
Jeukendrup AE (2011) nutrition for endurance sports: marathon, tri-athlon, and road cycling. J Sports Sci 29(Suppl 1):S91–S99. doi:1 0.1080/02640414.2011.610348
Kayser B (1994) nutrition and energetics of exercise at altitude. the-ory and possible practical implications. Sports Med 17:309–323 Keytel lr, goedecke JH, noakes tD, Hiiloskorpi H, laukkanen r, van
der Merwe l, lambert EV (2005) Prediction of energy expenditure from heart rate monitoring during submaximal exercise. J Sports Sci 23:289–297. doi:10.1080/02640410470001730089
Kimber nE, ross JJ, Mason Sl, Speedy DB (2002) Energy balance during an ironman triathlon in male and female triathletes. Int J Sport nutr Exerc Metab 12:47–62
Knechtle B, Knechtle P, Wirth A, Alexander rüst c, rosemann t (2012) A faster running speed is associated with a greater body weight loss in 100-km ultra-marathoners. J Sports Sci 30:1131– 1140. doi:10.1080/02640414.2012.692479
Kruseman M, Bucher S, Bovard M, Kayser B, Bovier PA (2005) nutrient intake and performance during a mountain marathon: an observational study. Eur J Appl Physiol 94:151–157. doi:10.1007/ s00421-004-1234-y
lara B, Salinero JJ, Del coso J (2014) the relationship between age and running time in elite marathoners is U-shaped. Age (Dordr) 36(2):1003–1008. doi:10.1007/s11357-013-9614-z
Mawson Jt, Braun B, rock PB, Moore lg, Mazzeo r, Butterfield gE (2000) Women at altitude: energy requirement at 4,300 m. J Appl Physiol (1985) 88:272–281
Meyer nl, Manore MM, Helle c (2011) nutrition for winter sports. J Sports Sci 29(Suppl 1):S127–S136. doi:10.1080/02640414.201 1.574721
Minetti AE (1995) Optimum gradient of mountain paths. J Appl Phys-iol 79:1698–1703
Montain SJ, coyle EF (1992) Influence of graded dehydration on hyperthermia and cardiovascular drift during exercise. J Appl Physiol (1985) 73:1340–1350
richalet JP (2012) Altitude and the cardiovascular system. Presse Med 41:638–643. doi:10.1016/j.lpm.2012.02.003
rodriguez nr, Di Marco nM, langley S (2009) American col-lege of Sports Medicine position stand. nutrition and ath-letic performance. Med Sci Sports Exerc 41:709–731. doi:10.1249/MSS.0b013e31890eb86
Saibene F, Minetti AE (2003) Biomechanical and physiological aspects of legged locomotion in humans. Eur J Appl Physiol 88:297–316. doi:10.1007/s00421-002-0654-9
Saris WH, van Erp-Baart MA, Brouns F, Westerterp Kr, ten Hoor F (1989) Study on food intake and energy expenditure during extreme sustained exercise: the tour de France. Int J Sports Med 10(Suppl 1):S26–S31. doi:10.1055/s-2007-1024951
tartaruga MP, Mota cB, Peyre-tartaruga lA, Brisswalter J (2013) Scale Model on performance prediction in recreational and elite endurance runners. Int J Sports Physiol Perform 9(4):650–655 tosi P, leonardi A, Schena F (2009) the energy cost of ski
mountain-eering: effects of speed and ankle loading. J Sports Med Phys Fit 49:25–29
tosi P, leonardi A, Zerbini l, rosponi A, Schena F (2010) Energy cost and efficiency of ski mountaineering. A laboratory study J Sports Med Phys Fitness 50:400–406 (r40103056)
turnbull Jr, Kilding AE, Keogh JWl (2009) Physiology of alpine skiing. Scand J Med Sci Sports 19(2):146–155. doi:10.1111/j.1600-0838.2009.00901.x
Vernillo g, Agnello l, Drake A, Fiorella P, Piacentini MF, la torre A (2012) cardiovascular responses during an indoor race walking competition. J Sports Med Phys Fit 52:589–595
Wasserman K, McIlroy MB (1964) Detecting the threshold of anaero-bic metabolism in cardiac patients during exercise. Am J cardiol 14:844–852
Westerterp Kr, Meijer gA, Janssen EM, Saris WH, ten Hoor F (1992) long-term effect of physical activity on energy balance and body composition. Br J nutr 68:21–30
Wicks Jr, Oldridge nB, nielsen lK, Vickers cE (2011) Hr index—a simple method for the prediction of oxygen uptake. Med Sci Sports Exerc 43:2005–2012. doi:10.1249/MSS.0b013e318217276e