*Corresponding author: Marianne Schmid Daners, Product Development Group Zurich, Department of Mechanical and Process Engineering, ETH Zurich, CLA G21.1, Tannenstrasse 3, Zurich 8092, Switzerland, Phone: +41 44 632 24 47, E-mail: [email protected] Alexander Jöhl: Product Development Group Zurich, Department of Mechanical and Process Engineering, ETH Zurich, Zurich 8092, Switzerland; and Department of Radiation Oncology, University Hospital Zurich, Zurich 8091, Switzerland
Stephanie Lang, Stefanie Ehrbar, Matthias Guckenberger and Stephan Klöck: Department of Radiation Oncology, University Hospital Zurich, Zurich 8091, Switzerland; and University of Zurich, Zurich 8006, Switzerland
Mirko Meboldt: Product Development Group Zurich, Department of Mechanical and Process Engineering, ETH Zurich, Zurich 8092, Switzerland
Alexander Jöhl, Stephanie Lang, Stefanie Ehrbar, Matthias Guckenberger, Stephan Klöck,
Mirko Meboldt and Marianne Schmid Daners*
Modeling and performance evaluation of a robotic
treatment couch for tumor tracking
DOI 10.1515/bmt-2015-0187
Received September 29, 2015; accepted February 20, 2016; online first March 25, 2016
Abstract: Tumor motion during radiation therapy increases
the irradiation of healthy tissue. However, this problem
may be mitigated by moving the patient via the treatment
couch such that the tumor motion relative to the beam is
minimized. The treatment couch poses limitations to the
potential mitigation, thus the performance of the Protura
(CIVCO) treatment couch was characterized and
numeri-cally modeled. The unknown parameters were identified
using chirp signals and verified with one-dimensional
tumor tracking. The Protura tracked chirp signals well up
to 0.2 Hz in both longitudinal and vertical directions. If only
the vertical or only the longitudinal direction was tracked,
the Protura tracked well up to 0.3 Hz. However, there was
unintentional yet substantial lateral motion in the former
case. And during vertical motion, the extension caused
rotation of the Protura around the lateral axis. The
numeri-cal model matched the Protura up to 0.3 Hz. Even though
the Protura was designed for static positioning, it was able
to reduce the tumor motion by 69% (median). The
corre-lation coefficient between the tumor motion reductions of
the Protura and the model was 0.99. Therefore, the model
allows tumor-tracking results of the Protura to be predicted.
Keywords: medical control systems; medical robotics;
oncology; tumor motion compensation.
Introduction
Along with surgery and chemotherapy, radiation therapy
is one of the three main options in cancer treatment. Its
efficacy largely depends on the absorbed radiation dose.
An increased dose to the tumor leads to a better tumor
control. However, at the same time the healthy tissue
around the tumor receives a higher dose, which leads
to increased side effects. Therefore, a big challenge in
radiation therapy is to control the tumor with sufficient
dose, while keeping the complication rate for normal
tissue reasonably low. There are always uncertainties in
the treatment chain in radiation therapy. They lead to
the concept of margins, meaning that not only the tumor
itself is irradiated but also a margin around the tumor to
ensure enough dose to the tumor. The motion of tumors
in the thorax and abdomen is one factor contributing to
these uncertainties. The patient’s respiration causes a
time-varying position of thoracic, liver, and adrenal gland
tumors. The motion of lung tumors has been reported to
have a peak-to-peak amplitude of up to 24 mm [19] or even
38 mm [6]. A liver tumor may move up to 34 mm [18], and
the thoracic wall may move up to 14 mm [17]. Therefore, a
mitigation of the tumor motion allows the decrease of the
margins and, consequently, the reduction of the irradiated
healthy tissue.
There are several methods to mitigate respiratory
tumor motion [14], 1) respiratory gating monitors the
tumor motion, and only if the tumor is in a specific
respiration phase, the radiation beam is switched on.
This leads to increased time needed for each treatment
session. 2) Breath-hold gating means that the patient
holds the breath, thereby holding the tumor position.
Only then the beam is switched on. This also results in
increased treatment time, although the increase might
be smaller than for respiratory gating. However,
breath-hold may not be feasible for all patients, especially those
with reduced lung function. 3) Tumor tracking
continu-ously compensates for tumor motion. This is possible
by moving the beam source, modifying the beam, or
moving the patient using a robotic treatment couch.
These methods are more difficult to implement and
require more technical resources than respiratory gating
or breath-hold gating.
Robotic treatment couch tracking can be
imple-mented on conventional, widely available C-arm linear
accelerators. Additionally, tumor tracking with a couch
leaves the treatment beam undisturbed, which reduces
the dosimetric error of the treatment and makes quality
assurance easier than with other techniques. The
patient is placed on a treatment couch which moves
in the opposite direction of the tumor motion to
com-pensate it. The goal is to minimize the patient’s tumor
motion relative to the radiation beam, which, in turn,
allows the margins to be decreased. Thus, the
radia-tion dose to healthy tissue can be decreased, which
might ultimately lead to a reduction of side effects, e.g.
pneumonitis.
The behavior of the robotic treatment couch is of
utmost importance in tumor tracking, as it sets limits on
the tumor-tracking performance. A general study in this
direction was described in [7], where the authors
devel-oped specifications of an ideal treatment couch design for
tumor tracking.
In the current study, we assessed the clinically
available treatment couch Protura (CIVCO Medical
Solu-tions, Kalona, IA, USA) with respect to its performance
in tumor tracking. In addition, we developed and tested
a numerical model of the Protura. To our knowledge,
no model for the Protura has been developed as yet,
although it allows a quick preliminary testing of control
strategies for tumor tracking using the Protura. Other
treatment couches have been assessed in the
litera-ture, for example, the ELEKTA Precise Table (ELEKTA,
Stockholm, Sweden) [2, 9], and the HexaPOD (Medical
Intelligence GmbH, Schwabmünchen, Germany) [2,
10]. Both couches were modeled in [2] using theory of
mechanics and which were numerically simulated with
tumor motion signals obtained from real patient data.
In [10], the HexaPOD was modeled employing the
black-box approach and chirp signals to obtain parameter
identification data. In [9], the ELEKTA Precise Table was
modeled with a blackbox approach. A control algorithm
was then developed using the model.
In our study, the Protura was modeled using
theo-ries of mechanics and of chirp signals. The Protura and
the model were set to track the same recorded tumor
motion signals and the position of the Protura was
measured. Their tracking errors, compared to the case
without tracking, were evaluated. The model allows
different concepts of treatment couch tumor tracking to
be tested and the tracking errors of the Protura to be
predicted.
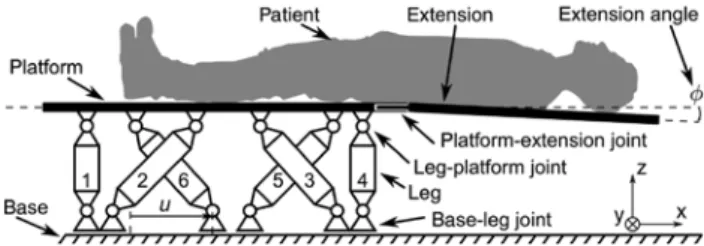
Figure 1: Schematic of the Protura with a patient.
The Protura allows the positioning in six degrees of freedom (DoF). The head and torso of the patient lie on the extension and the legs are positioned on the platform. The extension is removable via the platform-extension joint. The platform is connected to the legs via the rotational DoF leg-platform joints. The legs are rigid and connected to the base, which is fixed to the inertial frame of reference. The base-leg joints also allow rotational DoF, but additionally they each allow one translational DoF. The dislocation along this DoF is denoted as u. The platform-extension joint has some play resulting in a nonzero extension angle φ between the extension and the platform.
Materials and methods
The Protura was modeled and the performances of the model and the Protura were compared. The tracking error was defined as the Euclidean distance between the tumor center and the planned tumor center. The potential reduction of the tracking error depends on both the accuracy of the knowledge of the tumor motion and the performance of the actuator, namely the treatment couch. This study assumed perfect knowledge of the tumor position relative to the patient position, and only the performance of the treatment couch was considered. The treatment couch investigated was the Protura, which in this case was in use at a clinical linear accelerator. For the preparation of further experiments on real couch tracking with the Protura, a model was developed that allowed preliminary numeri-cal simulations. The model parameters were identified with experi-ments that were carried out to determine the Protura’s performance for tumor tracking. The performance of the Protura was evaluated using the maximum speed and acceleration of the Protura as well as using Bode diagrams.
System description
A schematic overview of the Protura is shown in Figure 1. The patient is placed on the platform and its extension. The latter allows the beam source to be rotated by 360° around the patient. Addition-ally, the extension is removable from the platform via the platform-extension joint, which is rigid in the ideal case. However, there may be some play in the joint, which leads to a nonzero angle [rotation in the lateral (y) direction] between the extension and the platform. The platform itself is attached to six legs via the leg-platform joints, which allow three rotational degrees of freedom (DoF). The legs are rigid and are linked to the base via the base-leg joints, which also allow three rotational DoF. However, the base-leg joints additionally allow one translational DoF per leg. The dislocation of one out of six base-leg joints is denoted as u and the six dislocations together are denoted as u. The base is fixed to the inertial frame of reference. In
the coordinate system of the Protura, x represents the longitudinal direction, y the lateral direction, and z the vertical direction. The Protura allows the positioning of a patient in six DoF (three orthogo-nal translations and rotations).
The mechanics of the Protura operate similarly to a standard Stewart platform [4], where the legs consist of prismatic joints. The lengths of those legs can be set via electric motors independently of each other, resulting in defined positions and orientations of the platform. In contrast, the Protura’s legs have fixed lengths, and the base-leg joints may move in one additional dimension. Each of them can be set independently, and each combination of base-leg joints’ positions corresponds to a position and orientation of the platform. Therefore, first, the positions of the base-leg joints are computed for a given reference position and orientation of the platform. Then, the controller drives the actual base-leg joints to the computed reference positions. To the best of our knowledge, such kinematics have not yet been modeled before.
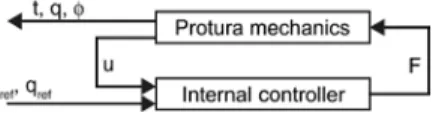
The Protura was modeled as depicted in Figure 2. The “Protura mechanics” represents the mechanical parts and the “internal con-troller” designates the controller of the Protura. This controller was considered given and nonmodifiable. The “internal controller” requires the desired position tref, the orientation qref of the platform,
and the current positions u of the base-leg joints as inputs. Its outputs are the forces F acting on the base-leg joints along the translational DoF. The “Protura mechanics” receives F as inputs, while the outputs are u and additionally the platform position t and orientation q, as well as the extension angle φ. The electric motors were assumed to have no dynamics as well as no saturations and, therefore, were not explicitly modeled.
Protura mechanics
The subsystem “Protura mechanics” was modeled by a simplified system consisting of the platform, the extension, the base, and one leg. This approach and the derivation of the “Protura mechanics” equations of motions were taken from [4], but were adapted to the Protura.
Figure 3 shows the relevant points and vectors. O is the origin of the “Protura mechanics” and is fixed to the base, Bi is the location of
the base-leg joint of leg i, and Bi0 is the initial location of Bi. The leg’s
center of gravity (CG) is LiCG. The geometrical center of the platform is
T and the CG is TCG. The leg-platform joint is Ji, the platform-extension
joint is E and, finally, the CG of the extension is ECG.
The positions of the points relative to the origin are described by vectors and rotations of the rigid bodies relative to the base
Figure 2: Signal flow diagram of the Protura, which is divided in two subsystems, the “Protura mechanics” and the “internal controller”. The “Protura mechanics” subsystem is driven by the input forces F acting at the base-leg joints. Its outputs are the current position t, orientation q, the extension angle φ, and the base-leg joints positions u. The “internal controller” subsystem’s inputs consist of u, the reference position trefand orientation qref. Its outputs are the
forces F. rT pi t bi bi0 Platform Base z φ y x Extension Leg pE riL rE Ji TCG ECG Bi LiCG Bi0 E O T
Figure 3: Representative sketch of the Protura to derive the model of the “Protura mechanics”.
The capital letters represent geometrical points of the system. The lowercase bold letters represent vectors connecting the points. i, Leg number; O, origin of system; T, center of platform; Bi, base-leg
joint position; Bi0, initial base-leg joint position; Ji leg-platform joint
position; E, point on joint edge of extension; ECG, center of gravity
(CG) of extension; LiCG, leg CG; TCG, platform CG.
coordinate system (Figure 3). To know the positions of all points of the “Protura mechanics” only the vector t, the platform’s cur-rent rotation (orientation), and the extension angle φ are needed. The rotation of the platform is represented by quaternions q, which are similar to complex numbers. Quaternions are widely used to describe rotations in three dimensions [15]. The variables t, q, and φ are the minimal coordinates of the “Protura mechanics” and were used to derive the kinematics which define the location of any point of the “Protura mechanics”. The equations for the linear and angular momentum of the platform, the extension, and the legs are described in the supplementary material provided online. The final equation has the form of (1), which allowed the equations to be solved numerically. ( , , )φ ωIT ( , , , ,φ ω φIT, , ) φ ⋅ = t M t q f t q t F (1)
The left-hand side of (1) consists of M, the mass matrix, multiplied with the second derivative of the minimal coordinates (accelera-tions). The entries of the mass matrix depend on the minimal coordi-nates. The right-hand side consists of the vector f, whose entries are functions of the minimal coordinates (t, q, φ), the first derivative of the minimal coordinates ( ,t ωIT, φ ), and the input forces F given by
the “internal controller”.
Internal controller
The signal flow diagram of the “internal controller” is shown in Figure 4. The “reference conversion” computes uref from the reference
input tref and qref using the kinematics of the “Protura mechanics”.
The “trajectory generator” limits the derivatives of its input signals, such that the input and output are identical as long as the deriva-tives of the inputs respect the given limits, which allows for taking into account the Protura’s maximum speeds and accelerations. The method of limiting the derivatives of a signal is adopted from [1].
The utraj signal is fed together with the actual base-leg joints
posi-tions u to the “feedback” controller, which consists of proportional-integral-differential (PID) controllers that work in parallel, thereby resulting in six PID controllers. The six PID controllers adjust the respective positions of the base-leg joints independently. The out-puts of the “feedback” controllers are the forces FFB. In parallel to the
“feedback” controller, there is the “feedforward” controller comput-ing FFF. The “feedforward” controller uses the “Protura mechanics”
equations with all the derivatives set to zero and solved for F. These F are the forces needed to keep the “Protura mechanics” in steady state at the reference position tref and with the orientation qref. The output
of the “internal controller” F is the sum of FFB and FFF.
Hardware setup
For the measurements on the Protura, one PC communicated with all the devices used in this study (Figure 5). The software used consisted of MATLAB/Simulink and Real Time Windows Target (The MathWorks Inc., Natick, MA, USA), which enabled the real-time execution of the calculations as well as the synchronization of all signals. The most
tref uref utraj FFB FFF F u Reference
conversion Trajectorygenerator
Feedback
Feedforward qref
Figure 4: Signal flow diagram of the “internal controller”. The inputs are the references tref, qref, and the current base-leg
posi-tions u. The output is F, which is also the input to the mechanical system. The “reference conversion” converts the platform position to the positions uref. The “trajectory generator” limits the derivatives
of uref. The “feedback” computes FFB from the difference of u and utraj,
while the “feedforward” computes FFF from the reference input. The
sum of FFB and FFF results in F.
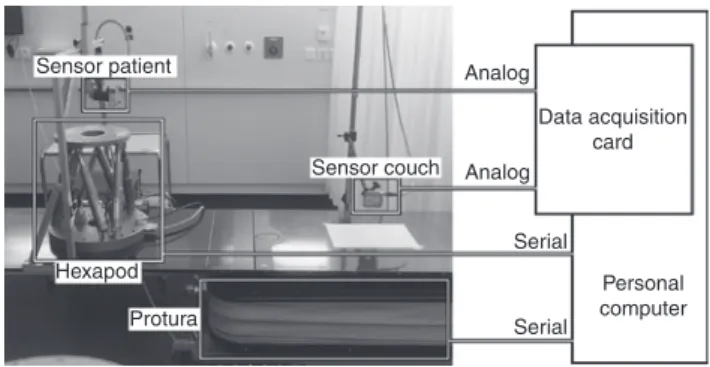
Sensor patient Sensor couch Hexapod Protura Analog Analog Serial Serial Personal computer Data acquisition card
Figure 5: Hardware setup for experiments.
“Sensor patient” measures either the respiratory motion (“Hexapod”) or the position of the Protura, while “sensor couch” measures the position of the Protura. If both sensors measure the Protura position, they measure different directions. The “data acquisition card” converts the analog signals to digital signals. The “Protura” and the “Hexapod” communicate with the “personal computer” (PC) via serial interfaces.
important actuator was the Protura (CIVCO, Kalona IA, USA), to which the PC communicated via a serial interface. The other actuator, the Hexapod (Hexapod H840.5PD, Physik Instrumente GmbH & Co. KG, Karlsruhe/Palmbach, Germany), communicated in the same way and was used to mimic the respiratory motions of the patients. The sensors consisted of two laser triangulation systems (LTS) (optoNCDT 1302, Micro Epsilon Messtechnik GmbH & Co. KG, Ortenburg, Germany), which measured the position of a point on the Protura or the Hexapod. The specific setup of the sensors depended on the actual experiments described in the sections “Parameter estimation”, “Parameter verifica-tion”, and “Influence of extension”. The sensors sent analog signals to the PC with an integrated data acquisition card (MF624, Humusoft, Prague, Czech Republic) that converted analog to digital signals. This converter worked with 14 bits, while the measuring range of the laser sensors was 50 mm, which resulted in a quantization of approximately 0.003 mm.
Parameter estimation
The known parameters included the geometrical parameters, such as the locations of the leg-platform joints, the lengths of the legs, as well as the inertias of the bodies of the Protura mechanics. How-ever, there were unknown parameters, which had to be identified, namely, the maximum speeds, the maximum accelerations, the friction coefficients, and the parameters of the PID controllers. The unknown parameters concerning the extension were not identi-fied, therefore, the experiments described in the following were carried out without the extension. But the influence of the exten-sion on the rotational behavior of the Protura was considered in the section “Influence of extension”.
For the identification of the unknown parameters, a sinusoidal chirp signal (linear increase of frequency from 0.01 Hz to 1 Hz in 200 s, amplitude of 10 mm) was used. The chirp signal was applied in the longitudinal direction (x chirp), the vertical direction (z chirp), and both directions simultaneously (xz chirp). The frequency range was chosen such that the typical breathing frequencies were included (0.27 Hz average, according to [19]).
The LTS sensors always measured the longitudinal (x) and ver-tical (z) position of the platform. In the case of xz chirp, the meas-urement was repeated with one sensor repositioned to measure the lateral (y) position.
In the first step, the speed and acceleration limits imposed by the trajectory generator were identified using the chirp signal meas-urements. The trajectory generator limits the speeds and accelera-tions of the posiaccelera-tions of the base-leg joints rather than the platform position directly. But the known geometrical parameters and the kinematics of the Protura mechanics allowed the positions u to be computed from the measured platform position. Each position u was then fitted at each time step tk with both a linear and a quadratic
polynomial p over an interval Δt of 0.5 s, which yielded the speeds and the accelerations, respectively. The first derivative of the linear polynomial is the speed, while the second derivative of the quadratic polynomial is the acceleration. The peaks of the resulting sinusoidal signals yield the maximum values.
1 1
( ) ( ) error( ), k-2 k 2
uτ=pτ+ τ t ∆ < ≤ + ∆t τ t t (2)
Given the speed and acceleration limits of the trajectory generator, the friction coefficients and PID controller parameters were estimated
using the same chirp signals. The quality of the estimations were evaluated using Bode diagrams.
Parameter verification
The verification of the parameters identified was not carried out with chirp signals, but with data closer to actual tumor tracking. The fol-lowing experiment was performed. The Hexapod was placed on the Protura platform and one LTS sensor measured the vertical motion of the Hexapod while being attached to the Protura platform. The motion of the Protura platform was measured by the other LTS sen-sor. Ten respiratory patterns were sent to the Hexapod. These pat-terns were previously acquired during a four-dimensional computer tomography scan using the respiratory patient monitoring system (RPM, Varian Medical Systems, Palo Alto, CA, USA). Based on a patient-specific correlation model, the one-dimensional external motion was converted to a three-dimensional internal motion. This motion was assumed to be the actual tumor motion and was com-pensated by the Protura in the longitudinal and the vertical direc-tions but not in the lateral direction. The tumor sites consisted of lung, liver, and adrenal glands. The characteristics of these motion patterns, such as frequencies and amplitudes are listed in tables in the Supplement in Section 3. The time delay in the system was not compensated. The model was used to simulate the tumor tracking with the same respiratory patterns and correlation models. For both the model and the Protura the root mean square of the tracking error (eRMS) was computed for ten different respiration cases.
Influence of extension
As mentioned above, these experiments were carried out without the extension. As the patient is placed mainly on the extension, its behavior is expected to have a great influence on the tracking error. Additionally, the motion of the extension relative to the platform is not known to the Protura. Therefore, we looked at the behavior of the angle φ between the platform and the extension. The experiment was set up as follows: First, the two LTS sensors were placed at one end of the Protura where they measured the vertical position of the Protura while it made a vertical step without load. The two LTS sen-sors were then shifted repeatedly a certain distance along the longi-tudinal direction of the Protura, while the measurement and the step were repeated after each shift. Figure 6 shows the resulting measure-ment positions. The measuremeasure-ment data was processed as follows: At each time sample of the measurements, two linear regressions were performed, with the first representing the platform and the second the extension.
Figure 6: Measurement setup for examining the influence of the extension.
The vertical arrows point to the position measurement locations.
Results
Parameter estimation
Speed and acceleration limitations
The mean values of the maximum velocities of the
plat-form show larger variations than those of the base-leg
joints (Table 1). The highest accelerations were reached
with the z chirp for both the platform and the base-leg
joints. Furthermore, results of simulations with the model
were acquired with a speed limit of 20.09 mm/s and an
acceleration limit of 72.93 mm/s
2.
Input-output behavior with estimated parameters
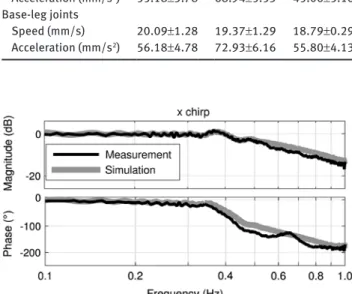
The Protura was able to follow the amplitude of the input
signal in the longitudinal direction up to 0.40 Hz, but it
lagged behind as the phase decreased from -4.31° at 0.10 Hz
to -22.41° at 0.35 Hz (Figure 7). The magnitude of the
meas-urement peaks at 0.37 Hz reaching 1.22 dB. The magnitudes
Table 1: Absolute values of maximum velocities and accelerations of the platform and the base-leg joints for x chirp, z chirp, and xz chirp (mean±standard deviation).
x chirp z chirp xz chirp
Platform Speed (mm/s) 20.21±1.13 18.62±1.09 14.77±0.37 Acceleration (mm/s2) 55.18±3.78 68.94±5.53 45.06±5.16 Base-leg joints Speed (mm/s) 20.09±1.28 19.37±1.29 18.79±0.29 Acceleration (mm/s2) 56.18±4.78 72.93±6.16 55.80±4.13
Figure 7: Bode diagram of the Protura (Measurement) and the model (Simulation), which followed an x chirp.
The input is the chirp signal and the output is the actual longitudinal position of the platform.
of the model and of the measurement matched over the
entire frequency range. Except for the frequency range
between 0.44 Hz and 0.73 Hz, the phases also matched.
The Protura managed to follow the magnitude
of signals in the vertical direction with up to 0.38 Hz
(Figure 8), but also here the phase showed a decrease
from -6.65° at 0.10 Hz to -13.70° at 0.33 Hz. The match in
magnitude between the model and the Protura was
accu-rate up to 0.40 Hz and above 0.80 Hz. The phases match
up to 0.37 Hz and diverge as the frequency increases.
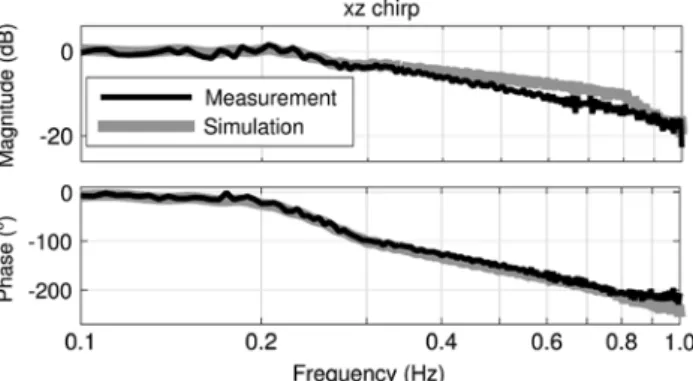
Figure 9 shows the tracking behavior of the Protura
in the vertical direction, when it followed a chirp signal
in the vertical as well as in the longitudinal direction. The
magnitude was zero up to 0.23 Hz and decreased as the
frequency increased. The phase also showed a decrease
from -7.05° at 0.10 Hz to -21.64° at 0.21 Hz. In this case,
the magnitudes of the model and of the Protura matched
at frequencies of up to 0.35 Hz and at frequencies above
0.86 Hz. The phases matched up to 0.80 Hz. The tracking
behavior was similar in the longitudinal direction.
Figure 8: Bode diagram of the Protura (Measurement) and the model (Simulation), which followed a z chirp.
The input is the chirp signal and the output is the actual vertical position of the platform.
Figure 9: Bode diagram of the Protura (Measurement) and the model (Simulation), which followed a xz chirp signal.
The input is the chirp signal, while the output is the actual vertical position of the platform.
In the case of simultaneous vertical and longitudinal
motions, the Protura also exhibited a lateral motion even
when the corresponding reference value was set to zero. In
Figure 10, the magnitude of the Bode diagram shows the
transfer function of the vertical reference input and the
lateral position output of the Protura and of the model.
The Protura had a peak magnitude of about -9.25 dB at a
frequency of 0.36 Hz. The magnitude of the model peaked
at -13.41 dB at 0.32 Hz and thus was smaller than that of the
Protura at frequencies above 0.28 Hz, but the magnitudes
matched at frequencies below this value.
Parameter verification
The root mean square of the tracking error (e
RMS) was
computed for respiration measurements and correlation
models of ten different patients (Figure 11). The white bars
show the error without using tracking. The black bars
show the measured tracking errors, while the gray bars
represent the tracking errors of the simulation. Couch
tracking always reduced the tracking error, but with
vari-ations over the respiration patterns of the patients. The
median reduction of the measured tracking errors was
69% with a standard deviation of 17%, while the
respec-tive values for the model were 80% and 17%, respecrespec-tively.
The Pearson correlation coefficient between the
reduc-tions of the Protura and the model was 0.99.
Figure 10: Bode diagram of the Protura (Measurement) and the model (Simulation), with the vertical longitudinal reference as the input and the unintended lateral motion as the output during an xz chirp.
Figure 11: Comparison of tumor-tracking performances simulated with the Protura (Measurement) and the model (Simulation) for ten different patients.
Each patient had a specific respiratory behavior and tumor motion. “No tracking” represents a static couch. The variable eRMS is the root
Influence of extension
The profile of the Protura, as seen from the lateral
direc-tion, is shown in Figure 12 during a vertical step of
20 mm. The line segments on the left side represent the
platform and those on the right represent the extension,
corresponding to the schematic of Figure 1. Each pair is a
side-view snapshot of the Protura with the corresponding
times marked on the left. The step motion started at time
2 s and took about 1.5 s to complete.
The platform and the extension were horizontal
before the step motion and afterwards. However, during
the step there was a height difference of approximately
2 mm between the far left end of the platform and the
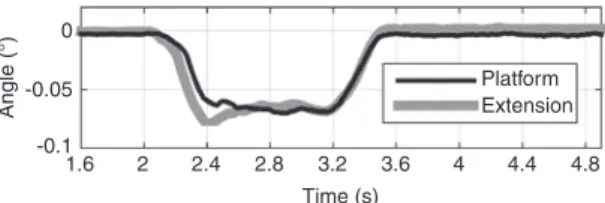
far right end of the extension. Figure 13 shows the
cor-responding tilt angles around the lateral axis of both the
platform and the extension. The angles were nonzero
during the step. Additionally, in the first half-second of
the step, the tilt angles of the platform and the extension
differed.
Discussion
In this study the tracking behavior of the Protura was
modeled and its performance was tested. For all
respi-ration trajectories tested the tumor motion relative to
20 15 10 Ve rtical position (mm) 5 0 0 500 1000 Longitudinal position (mm) Platform 2.4 s 2.8 s 3.2 s 3.6 s 2.0 s Extension 1500 2000
Figure 12: The sideways profile of the platform (left line segments) and the extension (right line segments) of the Protura during a measured vertical step of 20 mm shown at several time instances (marked on the left).
The crosses show the measured values, the lines the linear regres-sion fits and the dots the location of the platform-extenregres-sion joint.
0 -0.05 -0.1 Angle (°) 1.6 2 2.4 2.8 3.2 3.6 4 4.4 4.8 Time (s) Platform Extension
Figure 13: The tilt angle (lateral rotation) of the platform and the extension during a vertical step of 20 mm of the Protura.
the radiation beam was reduced by a median of 69%
(Figure 11). However, in some circumstances there was
an unintended lateral motion, especially at increased
frequencies. The extension caused nonnegligible
rota-tional motion around the lateral axis of the Protura,
even though the corresponding reference was zero. The
model represents the Protura well, which allows
experi-ments on the Protura to be replaced by tests on the
model.
In our earlier work, we reported the maximum speed
of the Protura to be 16 mm/s [16], which corresponds to
the platform speed. The Protura is actually limited in the
speed of the base-leg joints, so the maximum speed of the
platform depends only on the type of motion which the
platform has to execute. The limit of 16 mm/s is valid for
a motion in general directions, but it does not hold true
for a motion in only one, e.g. the vertical direction. In
this case, the speed of the Protura may reach 20 mm/s. Its
maximum speed lies between the maximum speeds of the
other treatment couches: the HexaPOD is stated to reach
8 mm/s [11], while maximum speed of the ELEKTA Precise
Table is specified to reach 40 mm/s [9]. No information is
publicly available on the maximum accelerations of those
two. D’Souza et al. [7] developed specifications of an ideal
treatment couch for tumor tracking. Such a couch should
reach speeds of 162 mm/s and accelerations of 887 mm/s.
Both specifications are an order of magnitude larger than
the values achieved by the Protura. These specifications,
however, are very conservative and the majority of tumor
speeds do not reach such high values, but are below
16 mm/s [20].
To the best of our knowledge, the Protura has not yet
been modeled. The most similar system that was modeled
is the HexaPOD [11]. A blackbox model was derived,
which required the identification of parameters. Chirp
signals were also employed, and in the case of vertical
motion, the HexaPOD could fully track the chirp signal
up to about 0.3 Hz. The Protura reached only slightly
higher values for pure longitudinal or vertical motion,
even though the maximum speed of Protura was twice as
high. This can be explained by the fact that the
ampli-tudes of the chirp signals were different. An amplitude of
10 mm was used, while for the HexaPOD it was only 5 mm.
The maximum speed of the chirp signal of the HexaPOD
amounted to only one-half of those of the Protura, which
corresponded with the maximum speed of the treatment
couches. Additionally, there may be differences between
the HexaPOD and the Protura in the phase lag. The
HexaPOD was also modeled in [3] using an approach that
included the underlying mechanics. However, the
param-eters of the HexaPOD were considered to be known and
no identification and verification of the model’s
param-eters were carried out.
The Bode plots (Figures 7–10) show a good match
between the Protura and the model for frequencies of up
to 0.3 Hz, although the unintended lateral motion limits
the model. Therefore, the model allows the behavior of the
Protura to be predicted accurately for respiratory motion
tracking with frequencies of up to 0.3 Hz.
The lateral motion can be explained by the
particu-lar setup of the Protura mechanics. Legs 1 and 4 (Figure
1), at the short ends of the platform, exert lateral forces
on the platform. During a vertical motion of the
plat-form, the base-leg joints of these two legs move to
differ-ent locations, which results in nonzero errors. The PID
controllers translate the nonzero errors into nonzero
forces in the lateral direction. Thus, there are lateral
forces acting on the platform even though none are
needed. The faster the vertical motion was, the larger
the forces were acting in the lateral direction and the
more motion occurred in the lateral direction. The
dis-crepancy observed may be due to differences between
the parameters of the PID controllers of the model and
the Protura.
Figure 11 shows that the model accurately predicted
the tumor-tracking performance of the Protura, although
with a tendency to decreased tracking errors. This
dif-ference in tracking errors can be corrected by a linear
function as indicated by the correlation of 0.99. It was
observed that tumor tracking always decreased the
tumor motion relative to the beam. The root mean square
of the tracking error values varied between 0.31 mm and
7.76 mm, corresponding to reductions by 86% and 29%,
respectively.
The tracking errors reported in other works were
mostly smaller than the results shown in Figure 11. For
example in [9], the root mean squares of the tracking
errors of the ELEKTA Precise Table were reported to be
between 0.81 mm and 1.03 mm, corresponding to motion
reductions by about 80%. In [10], the values reported
for the HexaPOD were between 0.03 mm and 1.62 mm.
Nevertheless, the results of seven tracking cases of our
study were comparable to those from the literature, with
only one large outlier (patient 1). The Protura was
evalu-ated in an earlier study by our group [16], and there the
median tumor motion reduction was reported to be about
90%, which is higher than the 69% achieved in this
work. However, only vertical tracking was considered
in [16], which allows a higher performance, as shown in
Figures 8 and 9. Tumor-tracking systems based on
differ-ent techniques were also considered in the literature. In
[12], a reduction of up to 82% (reduction factor of 5.7) was
achieved with the CyberKnife System (Accuray Inc.,
Sun-nyvale CA, USA), when treating lung cancer patients with
tumor motion amplitudes of up to 15 mm in cranial-caudal
and 10 mm in anterior-posterior direction. In [5], a
gimbal-based system was used for tumor tracking. A sinusoidal
motion (20 mm amplitude) was tracked, and a motion
reduction of at least 85% was achieved. In [13], a
multi-leaf collimator was used for tumor tracking, and motion
reductions of up to 83% were accomplished when
track-ing a sinusoidal motion with 20 mm amplitude. These
results of alternative techniques show reductions on the
same order of magnitude as the Protura’s reductions. As
the results varied depending on the current respiration
patterns, standardized respiration trajectories would be
required to yield valid comparisons. The tumor motion
patterns used in this work varied in their superior-inferior
amplitudes between 4.9 mm and 24.8 mm, and in
anterior-posterior direction between 1.2 mm and 14.6 mm,
respec-tively. The frequencies varied between 0.14 Hz and 0.4 Hz.
Figures 12 and 13 show that the rotations of the
plat-form and the extension need to be considered as well. Even
without a load, the platform and the extension showed a
tilt angle around the lateral axis. This fact greatly affects
the position of the tumor relative to the beam because the
patient’s torso is placed on the extension as depicted in
Figure 1. While the “internal controller” could keep the
rotation of the platform at the reference value in the steady
state case, it was unable to do so in the transient case.
Additionally, because the extension is flexible, any loads
can bend it, which was considered in [9]. The unintended
rotation and the flexibility of the extension emphasize the
need to consider the influence of the extension in tumor
tracking.
Preliminary tests showed very small influence of the
patient’s weight on the performance of the Protura and
were therefore neglected in the measurements, as were
the three-dimensional rotations of the platform. The time
delay of the Protura was not explicitly considered, but
was implicitly included in the results of the chirp signal
measurements.
The reduction of the tumor motion is expected to
reduce the radiation dose to the healthy tissue. Figure 11
shows that tumor tracking reduced the amplitude of the
tumor motion by 69% (median) compared to “no
track-ing”. A reduction of the respiratory amplitude of 50%
leads to a reduction in the mean lung dose (surrounding
healthy tissue) of about 30% [8]. This can be expected for
treatment couch tracking with the Protura and may lead to
reduced side effects such as pneumonitis.
Conclusion
Although the Protura is only designed for pre-treatment
positioning of the patients, it can be used to compensate
for tumor motion below the speed limit of the Protura. The
compensation for faster tumor motion is challenging, and
the resulting reduction of tracking errors depends very
much on the respiration pattern. The unintended lateral
motion becomes relevant at increased frequencies. To
avoid such unwanted motions, an “internal controller”
compensating for lateral motion may be required. The
extension introduces additional dynamics, which have to
be taken into account when the Protura is used for tumor
tracking.
The model represents the Protura well and can be
used as a substitute for the Protura to conduct initial tests
of algorithms such as prediction filters that are used for
tumor tracking.
Nomenclature
B base-leg joint location
B0 initial base-leg joint location CG center of gravity
DoF degree(s) of freedom
E platform-extension joint
ECG center of gravity of extension F input forces of mechanical system
J leg-platform joint location
LCG center of gravity of leg
M generic mass matrix of (1)
O inertial origin of system PID proportional-integral-differential
T geometrical center of platform of treatment couch
TCG center of gravity of platform of treatment couch
eRMS root mean squared error
t vector from origin to center of platform tref reference platform position
q quaternion vector for rotation of platform qref reference quaternion for rotation of platform
u one base-leg position (a component of u) u base-leg positions
uref reference base-leg positions
utraj derivative limited reference base-leg positions
φ angle of extension relative to platform ωIT rotational velocity of platform
Acknowledgments: This work was supported by the Swiss
National Science Foundation (SNSF) through
“Devel-opment of prediction models for liver, lung, and breast
tumors and implementation and verification of prediction
filters for advanced couch tracking in a clinical
environ-ment”, Grant No. CR32I3_153491.
References
[1] Biagiotti L, Zanasi R. Time-optimal regulation of a chain of integrators with saturated input and internal variables: an application to trajectory planning. In: 8th IFAC Symposium on Nonlinear Control Systems. 2010; 1278–1283.
[2] Buzurovic I, Huang K, Yu Y, Podder TK. A robotic approach to 4D real-time tumor tracking for radiotherapy. Phys Med Biol 2011; 56: 1299.
[3] Buzurovic I, Podder T, Huang K, Yu Y. Tumor motion prediction and tracking in adaptive radiotherapy. In: BioInformatics and BioEngineering (BIBE), 2010 IEEE International Conference on. 2010; 273–278.
[4] Dasgupta B, Mruthyunjaya T. Closed-form dynamic equations of the general stewart platform through the Newton-Euler approach. Mech Mach Theory 1998; 33: 993–1012. [5] Depuydt T, Verellen D, Haas O, et al. Geometric accuracy of a
novel gimbals based radiation therapy tumor tracking system. Radiother Oncol 2011; 98: 365–372.
[6] Dieterich S, Suh Y. Tumor motion ranges due to respiration and respiratory motion characteristics. In: Uschel HC, Kresl JJ, Luketic JD, Papiez L, Timmerman RD, Schulz RA, editors. Treating tumors that move with respiration. Berlin, Heidelberg: Springer 2007: 3–13.
[7] D’Souza WD, McAvoy TJ. An analysis of the treatment couch and control system dynamics for respiration-induced motion compensation. Med Phys 2006; 33: 4701–4709.
[8] Guckenberger M, Kavanagh A, Webb S, Brada M. A novel respiratory motion compensation strategy combining gated beam delivery and mean target position concept – a compromise between small safety margins and long duty cycles. Radiother Oncol 2011; 98: 317–322.
[9] Haas OC, Skworcow P, Paluszczyszyn D, Sahih A, Ruta M, Mills JA. Couch-based motion compensation: modelling, simulation and real-time experiments. Phys Med Biol 2012; 57: 5787.
[10] Herrmann C, Ma L, Wilbert J, Baier K, Schilling K. Control of a HexaPOD treatment couch for robot-assisted radiotherapy. Biomed Tech (Berl) 2012; 57: 333–351.
[11] Herrmann C, Schilling K, Ma L. Modeling a HexaPOD for tumor motion compensation in robot assisted radiotherapy. In: Proceedings of the Joint Conference of the 41st International Symposium on Robotics and the 6th German Conference on Robotics. Munich, Germany: June 2010.
[12] Hoogeman M, Prvost JB, Nuyttens J, Pöll J, Levendag P, Heijmen B. Clinical accuracy of the respiratory tumor tracking system of the cyberknife: Assessment by analysis of log files. Int J Radiat Oncol Biol Phys 2009; 74: 297–303.
[13] Keall PJ, Cattell H, Pokhrel D, et al. Geometric accuracy of a real-time target tracking system with dynamic multileaf collimator tracking system. Int J Radiat Oncol Biol Phys 2006; 65: 1579–1584.
[14] Keall PJ, Mageras GS, Balter JM, et al. The management of respiratory motion in radiation oncology report of AAPM Task Group 76. Med Phys 2006; 33: 3874–3900.
[15] Kuipers JB. Quaternions and rotation sequences, vol. 66. Princeton: Princeton University Press 1999.
[16] Lang S, Zeimetz J, Ochsner G, Schmid Daners M, Riesterer O, Klöck S. Development and evaluation of a prototype track-ing system ustrack-ing the treatment couch. Med Phys 2014; 41: 021720.
[17] Quirk S, Becker N, Smith W. External respiratory motion analy-sis and statistics for patients and volunteers. J Appl Clin Med Phys 2013; 14: 90–101.
[18] Rohlfing T, Maurer Jr CR, ODell WG, Zhong J. Modeling liver motion and deformation during the respiratory cycle using intensity-based nonrigid registration of gated MR images. Med Phys 2004; 31: 427–432.
[19] Seppenwoolde Y, Shirato H, Kitamura K, et al. Precise and real-time measurement of 3D tumor motion in lung due to breath-ing and heartbeat, measured durbreath-ing radiotherapy. Int J Radiat Oncol Biol Phys 2002; 53: 822–834.
[20] Shirato H, Suzuki K, Sharp GC, et al. Speed and amplitude of lung tumor motion precisely detected in four-dimensional setup and in real-time tumor-tracking radiotherapy. Int J Radiat Oncol Biol Phys 2006; 64: 1229–1236.
Supplemental Material: The online version of this article (DOI: 10.1515/bmt-2015-0187) offers supplementary material, available to authorized users.