J.‐B. Bosson1 , M. Huss2,3 , and E. Osipova1
1World Heritage Programme, International Union for Conservation of Nature (IUCN), Gland, Switzerland,2Laboratory of Hydraulics, Hydrology and Glaciology (VAW), ETH Zurich, Zurich, Switzerland,3Department of Geosciences, University of Fribourg, Fribourg, Switzerland
Abstract
Since 1972, the United Nations Educational, Scientific and Cultural Organization (UNESCO) World Heritage Convention aims to identify and protect sites of Outstanding Universal Value for future generations. However, growing impacts of climate change are of the utmost concern for the integrity of many sites. Here, we inventory the glaciers present in natural World Heritage sites for thefirst time. We found 19,000 glaciers in 46 sites located all over the world. We analyze their recent evolution, current state, and project their mass change over the 21st century. Our results are based on a comprehensive review of the literature as well as a state‐of‐the‐art glaciological model for computing glacier responses up to 2100. Illustrating the strong influence of CO2emission scenarios and human actions on future ice loss magnitude,we project the wastage of 33% to 60% of the 2017 cumulative ice volume of 12,000 km3of World Heritage glaciers by 2100. Furthermore, we expect complete glacier extinction in 8 to 21 of the investigated World Heritage sites until the end of the century, depending on the climate scenario. We suggest that World Heritage glaciers should be considered as analogs to endangered umbrella, keystone, andflagship species, whose conservation would secure wider environmental and social benefits at global scale.
Plain Language Summary
The World Heritage convention aims at protecting the Earth'soutmost assets and commits humanity to transmit them to future generations. However, many World Heritage sites are affected by anthropogenic climate change. Here, we present thefirst study on the glaciers located within the natural World Heritage sites. We inventoried 19,000 World Heritage glaciers and projected their mass changes over the 21st century. The results emphasize that major glacier decline will occur in these iconic sites in future decades. Nevertheless, ice loss magnitude will vary by a factor of 2 according to CO2emission scenarios and thus human activities. This study points out how the conservation
of World Heritage glaciers could serve as a leverage and a target to tackle the unprecedented issue of climate change. Glaciers are more than disappearing passive climatic indicators. They are key components of planetary ecosystems that influence global climate and sea level, as well as water fluxes, human activities, or biodiversity at the regional scale. The conservation of these iconic endangered features could thus mobilize global‐scale conservation and climate mitigation benefits. In this context, we show how drastic reduction of emissions will rapidly curb melt rates and safeguard a large glacier volume on the long term.
1. Introduction
The Convention Concerning the Protection of the World Cultural and Natural Heritage was conceived to protect the planet's most significant and irreplaceable places from loss or damage (United Nations Educational, Scientific and Cultural Organization, 1972). It constituted a major advance in conservation strategies by linking together, above any spatial and temporal boundaries, the preservation of natural and cultural heritage. Today, 247 natural World Heritage sites are listed for their Outstanding Universal Value (OUV)—in terms of natural beauty or importance for geological and biological diversity and processes— committing states and the international community to make the utmost effort to conserve and transmit them to future generations. Although the 1972 World Heritage Convention did not identify anthropogenic climate change (Intergovernmental Panel on Climate Change, 2013, 2018) among the major issues, it now represents one of the most serious threats to natural sites and is the main source of future threat (Osipova et al., 2017). Recent studies have shown how direct or cascading effects of climate change lead to negative impacts on inscribed sites in various regions (Allan et al., 2017; Hughes et al., 2017; Reimann et al., 2018; Scheffer et al., 2015). Major changes are also documented in polar and mountainous environments, where
©2019. The Authors.
This is an open access article under the terms of the Creative Commons Attribution‐NonCommercial‐NoDerivs License, which permits use and distri-bution in any medium, provided the original work is properly cited, the use is non‐commercial and no modifica-tions or adaptamodifica-tions are made.
Key Points:
• First inventory and study of the 19,000 glaciers located in natural World Heritage sites is presented • In response to anthropogenic
warming, these glaciers are expected to lose 33% to 60% of their volume by 2100
• The conservation of World Heritage glaciers is paramount in a changing climate because of their key role in planetary ecosystems Supporting Information: • Supporting Information S1 • Table S1 Correspondence to: J.‐B. Bosson, [email protected] Citation:
Bosson, J.‐B., Huss, M., & Osipova, E. (2019). Disappearing World Heritage glaciers as a keystone of nature conservation in a changing climate.
Earth's Future, 7, 469–479. https://doi.
org/10.1029/2018EF001139 Received 20 DEC 2018 Accepted 25 JAN 2019 Published online 29 APR 2019
ongoing warming is amplified (MRI Working Group, 2015). The fate of glaciers appears especially troubling as their global decline is both observed and predicted (Intergovernmental Panel on Climate Change, 2013; Marzeion et al., 2018; Zemp et al., 2015). Although studies exist on some glaciers located in World Heritage sites, their particular conservation status—that is, their recognition as outstanding natural assets or components of ecosystems that have to be protected for future generations—is almost never considered, and no comprehensive assessment of their state has been carried out. This paper addresses this gap by com-paring natural World Heritage sites and the globally complete Randolph Glacier Inventory (RGI; Pfeffer et al., 2014). Thisfirst identification of World Heritage glaciers allowed us to review the literature on their recent evolution and to explore the potential mass change during 21st century by using an updated version of the Global Glacier Evolution Model (Huss & Hock, 2015), a sophisticated approach to compute the indi-vidual response of glaciers.
2. Data and Methods
2.1. DataThe boundaries of the 247 natural World Heritage sites originate from the World Database on Protected Areas. Following the adoption of the World Heritage Convention in 1972, cultural and natural sites of OUV have been inscribed on the World Heritage list since 1978 and, with the exception of Antarctica, are currently present across the world.
Glaciers are dynamical ice masses formed by snow compaction. Outlines of all glaciers worldwide are provided by the globally complete RGI version 6.0 (RGI Consortium, 2017). The acquisition dates of the glacier outlines range from 1943 to 2013 but are typically from thefirst decade of the 21st century (Table S1 in the supporting information). We used global digital elevation models from various sources (Howat et al., 2014; Jarvis et al., 2008; Morin et al., 2016; Tachikawa et al., 2011) to extract and aggregate into 10‐m elevation bands the topography of each glacier. Ice thickness distribution at the inventory date was calculated for each glacier by a numerical method for inverting bedrock elevation from surface topography relying on the principles of ice flow dynamics (Huss & Farinotti, 2012). In order to run the glacier evolution model at the global scale, we used monthly near‐surface air temperature and pre-cipitation data from the ERA‐Interim Reanalysis (Dee et al., 2011) for the period 1980–2016. Results of monthly 2‐m air temperature and total precipitation of the Fifth Phase of the Coupled Model Intercomparison Project (Taylor et al., 2012) for 2017–2100 were used for the future and were down-scaled to all glaciers individually (Huss & Hock, 2015). We use projections from 14 global circulation models forced by three emission scenarios (Representative Concentration Pathways, RCP: Meinshausen et al., 2011; RCP 2.6, drastic reduction of greenhouse gas emissions; RCP4.5, intermediate scenario; and RCP8.5, high emissions).
2.2. Glacier Inventory in Natural World Heritage Sites
A World Heritage glacier inventory was established by intersecting the outlines of all natural World Heritage sites with those of the >200,000 glaciers of the RGIv6.0 (e.g., Figure S1). Most of the inventoried glaciers (94%) have their whole area encompassed within the World Heritage sites, whereas other glaciers have only a part of their area within the latter. As the Greenland ice sheet outlines are not included in the RGI, we used satellite‐derived data (09.2016 MeASUREs Greenland Mosaics from Haran et al., 2017, and winter 2016– 2017 glacier terminus position from reference; Joughin et al., 2017) to delineate the frontal zone of the Jakobshavn Isbræ in Ilulissat Icefjord, the glacier located in the only natural World Heritage site encompass-ing part of Greenland.
In order to investigate how future glacier evolution and possible disappearance will modify or jeopardize the OUV of the World Heritage sites that contain them, we analyzed the consideration of glaciers in official documents of inscription and in the statements of OUV. We found four different types of consideration for glaciers: (1) Glaciers were (among) the primary reasons for OUV, (2) they influence the wider OUV of the site, (3) they are recognized, but the site was inscribed only under biodiversity criteria, and (4) they are present but not recognized within OUV. A potential glacier decline will thus have no to crucial influence on the site's OUV and, hence, on the justification of the World Heritage status of a site.
2.3. Glacier Modeling
As illustrated for Southern Patagonia (Figure S1), some World Heritage glaciers only have small portion of their surface within the inscribed area. We thus removed the glaciers having less than 50% of their surface within the World Heritage sites to obtain a representative picture of the processes that will occur within the World Heritage sites. Hence, 18,452 World Heritage glaciers of the 19,039 inventoried (i.e., 97%) were considered during the glacier evolution modeling.
In order to assess the future evolution of all individual glaciers of the World Heritage, we rely on the estab-lished glacier model GloGEM (Huss & Hock, 2015). GloGEM computes glacier mass balance and associated changes in glacier geometry (thickness, length, and width) at the glacier‐specific scale. The model operates in elevation bands of 10 m for each individual glacier. The surface mass balance is computed at monthly resolution as the sum of snow accumulation, snow, and ice melt and refreezing based on near‐surface air temperature and precipitation time series. GloGEM also accounts for mass losses at marine‐ or lake‐ terminating glacier fronts due to iceberg calving and subaerial ablation approximated by a simple scheme (Oerlemans & Nick, 2005) that has been compared to direct observations in different regions of the Earth (Huss & Hock, 2015). At the end of each year, computed glacier mass changes are used to adjust each gla-cier's thickness distribution and spatial extent using an empirical parameterization relating total mass change to distributed ice surface elevation changes (Huss et al., 2010). The model thus does not explicitly include ice dynamics but parametrizes the corresponding effects on glacier geometry relying on a simple but widely used scheme (e.g., Li et al., 2015; Seibert et al., 2018). GloGEM was calibrated at the scale of indi-vidual regions of the RGI based on glacier mass change estimates derived from a multimethod consensus study (Gardner et al., 2013). Model results were compared to observations of glacier mass balance (in situ and geodetic measurements) available for all regions around the globe (Zemp et al., 2012) and glacier area changes indicating a generally good skill in reproducing past variation in glacier mass and area. For further details on the model, its calibration and downscaling procedures we refer to Huss and Hock (2015). For the present study, the setup of GloGEM is widely consistent with the model version presented in Huss and Hock (2015). However, all model runs where updated using (i) the newest version of the RGI, that is, RGIv6.0, instead of RGIv4.0 as in Huss and Hock (2015), and (ii) time series of observed meteorological con-ditions were extended up to 2016. For some regions, this update has resulted in more accurate results for regions with an enhanced quality of glacier inventory data (e.g., central Asia), and for small glaciers experi-encing large changes in thefirst decade of the 21st century.
2.4. Uncertainties
The results presented here are subject to uncertainties. First, except for Jakobshaven Isbrae (Ilulissat Icefjord, Greenland), the present World Heritage glacier inventory fully relies on the glacier outlines con-tained in the RGI. In some regions, glacier outlines are outdated. For instance, the nine glaciers of Yellowstone National Park listed in the RGIv6.0 seem to have disappeared already and/or are stagnant snow patches according to recent aerial photographs (imagery from Google Earth and Plans software). Our model also provides evidence for the likely disappearance of these glaciers by simulating complete glacier disinte-gration before 2005 (Figure S2). Nevertheless, the RGI remains the most complete source of glacier outlines at the global scale. In addition, we also analyzed aerial photographs in other natural World Heritage sites located in cold and mountainous environments to investigate if all World Heritage glaciers were included in the RGI. No large glaciers were found. However, existing remnant ice patches (e.g., in Pirin National Park, Gachev et al., 2016) or active rock glaciers (e.g., in Jiuzhaigou Valley Scenic and Historic Interest Area; 32°55′50″N, 103°53′E) having a potentially glacial origin (Berthling, 2011; Bosson & Lambiel, 2016) could indicate recent disappearance of active glaciers in a few World Heritage sites other than the 46 inven-toried ones with glaciers.
Uncertainties also arise in projections of future glacier change using GloGEM from uncertainties in (1) the climate projections, (2) the data on initial glacier area and ice thickness, and (3) the simplifications and approximations in the model and the calibration procedure. Various sensitivity experiments performed by Huss and Hock (2015) have shown that factors (2) and (3) can importantly influence projected future glacier change of individual glaciers as no measurements of glacier‐specific ice thickness are available at the global scale, many physical processes have to be strongly simplified in a global glacier model, and the downscaling
of meteorological variables to thousands of glaciers remains challenging. Nevertheless, validation of computed initial ice thicknesses and past mass balances against globally almost complete data bases of these variables has indicated a satisfactory performance of the model with only small regional biases (Huss & Farinotti, 2012; Huss & Hock, 2015). However, uncertainties in future climate forcing as evidenced by the partly large differences in projected temperature and precipitation changes of the individual global circulation models forced by the same CO2 emission pathways are considerable and
clearly dominate the overall uncertainties of the modeled glacier volume evolution of the 21st century (Marzeion et al., 2018). Here, we therefore consider uncertain climate evolution as the main uncertainty source and have used this factor to visualize and estimate overall uncertainty of glacier evolution in response to each RCPs.
3. Results
3.1. World Heritage Glaciers Inventory
Wefind that 19,039 glaciers have their whole or partial area within natural World Heritage sites. This cor-responds to 9% of all glaciers on Earth (Figure 1 and Tables S2 and S3). Between one and several thousand glaciers, whose sizes range from 0.01 to 106km2, have been inventoried in 46 sites. Glaciers cover 55,950 km2 within these sites, corresponding to 0.4% of the global glacier area (7.5% if one excludes the ice sheets in Antarctica and Greenland). New Zealand (76%; Table S1), Alaska (44%), and North Asia (26%) are the regions with the largest proportion of ice within World Heritage sites while Arctic Canada, Iceland, Svalbard, the Russian Arctic, and Antarctica have no World Heritage glaciers. Among outstanding glaciers, one of the fastest glaciers and largest iceberg producer (Jakobshavn Isbrae in Ilulissat Icefjord), the longest glacier outside continental ice sheets (Bering Glacier in Kluane Wrangell St Elias Glacier Bay Tatshenshuni‐ Alsek), and the highest glacier (on Mount Everest in Sagarmatha National Park) are designated as World Heritage. The largest glacier of Alaska (Seward Glacier in Kluane), central Europe (Grosser Aletschgletscher in Swiss Alps Jungfrau‐Aletsch, Figure 2), central Asia (Fedchenko Glacier in Tajik Figure 1. Glaciers (red dots) located in natural World Heritage sites (white polygons). Their number and area are scaled with circle size and color, respectively. Site names are abbreviated, and their full names are given in Table S2. Sites abbreviated in bold are those where glaciers were one of the primary reasons for inscription on the World Heritage List. Gray polygons are glacierized regions, and black dots correspond to all other inventoried glaciers (RGI Consortium, 2017, in addition to the two continental ice sheets in Greenland and Antarctica).
National Park), Southern Andes (Pio XI in Los Glaciares National Park), and New Zealand (Tasman Glacier in Te Wahipounamu) are also listed.
The presence of glaciers is stated among the principal reasons for World Heritage inscription infive of the 46 sites (Table S2): Ilulissat Icefjord (Greenland), Kluane (Alaska), Los Glaciares National Park (Patagonia), Swiss Alps Jungfrau‐Aletsch (Europe, Figure 2), and Tajik National Park (central Asia). In another 28 sites, glaciers contribute, together with other natural features, to their recognized OUV. In 13 sites, glaciers are not specifically mentioned as contributing to inscription.
3.2. Recent and Future Evolution of World Heritage Glaciers
Glaciers are among the best climate indicators in nature because their volume depends on air temperature, precipitation and energy exchange at the Earth's surface. Since the nineteenth century, by limiting snow pre-cipitation and extending and intensifying melt periods, anthropogenic global warming has induced a world-wide glacier decline (Intergovernmental Panel on Climate Change, 2013; Marzeion et al., 2014; Zemp et al., 2015). Substantial ice loss with mostly increasing magnitudes since the 1990s affected World Heritage gla-ciers (e.g., Figure 2; Brun et al., 2017; Das et al., 2014; Kjeldsen et al., 2015; López‐Moreno et al., 2016; Schaefer et al., 2015; Thompson et al., 2011). The largest one, Jakobshavn Isbrae, very likely experienced the most severe loss since the nineteenth century as surface and submarine ablation, iceflux and iceberg dis-charge noticeably increased. It accounted for ~6% of the Greenland ice loss between 1983 and 2003 (Kjeldsen et al., 2015) and for ~3% of global sea level rise between 2000 and 2011 (i.e., 1 mm, Howat et al., 2011). Retreat and thinning of other World Heritage glaciers locally led to their disintegration or even complete disappear-ance (e.g., López‐Moreno et al., 2016; Thompson et al., 2011). Glaciers also likely disappeared recently in a few other World Heritage sites than those inventoried, as evidenced by remnant ice patches (e.g., Gachev et al., 2016). Within this period of overall decline, mass gain and glacier advances may have temporally and locally occurred at some of the sites (Mackintosh et al., 2017; Schaefer et al., 2015; Zemp et al., 2015), Figure 2. Current state and reconstitution of Grosser Aletschgletscher extent at the end of the Little Ice Age, in the midnineteenth century. This 23‐km‐long valley glacier is located in the World Heritage site Swiss Alps Jungfrau‐Aletsch. It contributed significantly to the recognition of the World Heritage criteria vii (i.e., aesthetic value) and viii (i.e., geological value) that led to the inscription of this site in 2001. Grosser Aletschgletscher is by far the largest and longest glacier in the European Alps. It has lost more than 25% of its volume and has been partly dislocated since the midnineteenth century (Bauder et al., 2007). Illustrating the long response time of large glaciers to the post–Little Ice Age anthropogenic warming, Jouvet et al. (2011) showed that ~40% of its current volume would melt in future decades even if the climate would stabilize at the level of the year 2000. We project the melt of 66 ± 32% (RCP2.6) to 96 ± 7% (RCP8.5) of the current ice volume for this site by 2,100 (Table S4 and Figure S2), which will severely jeopardize its Outstanding Universal Value. Photograph: ©aletscharena.ch—Christian Rueegg, 2011. RCP = Representative Concentration Pathways.
as a result of shorter‐term decreases of atmospheric or oceanic temperatures, increases in precipitation, or variations of solar or volcanic activity.
We used a process‐based model (Huss & Hock, 2015) to investigate the 21st century evolution of World Heritage glaciers. However, this model was not operable on Jakobshavn Isbrae due to the complexity of the involved glaciological and oceanographic processes for this site. According to existing modeling based on RCP4.5 (Church et al., 2013), this glacier will remain one of the largest contributors to sea level rise with 4–10 mm until 2100 (i.e., ~1% to 2.5% of the average global value). As the whole Greenland ice sheet, it responds with inertia to climatic variations and mass loss will very likely continue far beyond the end of the 21st century.
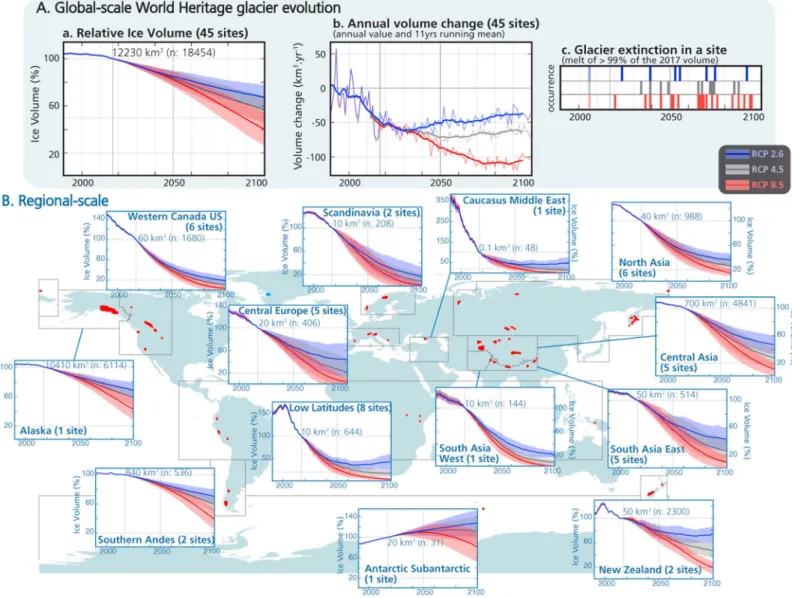
Overall, our model predicts a substantial ice loss for World Heritage glaciers throughout the 21st century (Figure 3a and Table 1). Mass loss by 2100 will account for 33 ± 11% (RCP2.6) to 60 ± 14% (RCP8.5) of the 2017 volume, corresponding to 3,600 ± 1,200 to 6,600 ± 1,600 km3of water, or 10 ± 3 to 18 ± 4 mm of sea level equivalent. All the annual (Figure 3a‐b) and decadal means (Table 1) of glacier volume change are expected to be negative over the century, illustrating a continuous ice loss for all climatic scenarios. Figure 3. (a) Global and (b) regional 21st century evolution of glaciers located in natural World Heritage sites according to different CO2emission scenarios (RCP2.6, RCP4.5, and RCP8.5). Ice volume variations (multimodel mean of 14 general circulation models ±1 standard deviation) are relative to the 2017 ice volume (in cubic kilometer with the number of glaciers considered in each evolution diagram). On the map, the red dots correspond to the modelled World Heritage glaciers. RCP = Representative Concentration Pathways.
However, the rate of mass loss will be reduced after the 2030s for RCP2.6 whereas it is expected to strongly increase for RCP8.5.
Due to heterogeneous climatic and topographic conditions, the evolution of World Heritage glaciers will dif-fer at regional and site scales (Figures 3b and 4 and S2 and Tables 1, S4, and S5). However, except for the mostly balanced conditions modeled for Heard and McDonald Islands (Antarctic Islands), substantial ice loss will occur in all natural World Heritage sites. Over the 21st century, the magnitude of the relative ice melt will strongly depend on the size of glaciers in each site. Very small glaciers rapidly respond to climatic variations because it strongly modifies their mass balance and the accumulation area ratio (AAR, i.e., the ratio of the area of the accumulation zone compared to the entire glacier area, Figure 4). Hence, relative Table 1
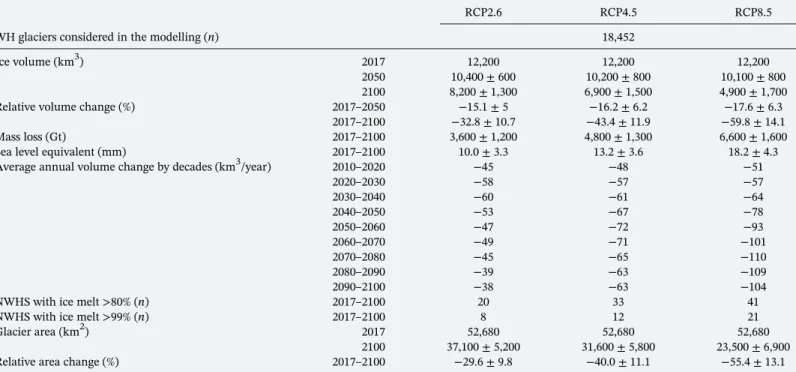
Multimodel Means of the Computed Evolution of Glaciers Located in Natural World Heritage Sites Over the 21st Century
RCP2.6 RCP4.5 RCP8.5
WH glaciers considered in the modelling (n) 18,452
Ice volume (km3) 2017 12,200 12,200 12,200
2050 10,400 ± 600 10,200 ± 800 10,100 ± 800
2100 8,200 ± 1,300 6,900 ± 1,500 4,900 ± 1,700
Relative volume change (%) 2017–2050 −15.1 ± 5 −16.2 ± 6.2 −17.6 ± 6.3
2017–2100 −32.8 ± 10.7 −43.4 ± 11.9 −59.8 ± 14.1
Mass loss (Gt) 2017–2100 3,600 ± 1,200 4,800 ± 1,300 6,600 ± 1,600
Sea level equivalent (mm) 2017–2100 10.0 ± 3.3 13.2 ± 3.6 18.2 ± 4.3
Average annual volume change by decades (km3/year) 2010–2020 −45 −48 −51
2020–2030 −58 −57 −57 2030–2040 −60 −61 −64 2040–2050 −53 −67 −78 2050–2060 −47 −72 −93 2060–2070 −49 −71 −101 2070–2080 −45 −65 −110 2080–2090 −39 −63 −109 2090–2100 −38 −63 −104
NWHS with ice melt >80% (n) 2017–2100 20 33 41
NWHS with ice melt >99% (n) 2017–2100 8 12 21
Glacier area (km2) 2017 52,680 52,680 52,680
2100 37,100 ± 5,200 31,600 ± 5,800 23,500 ± 6,900
Relative area change (%) 2017–2100 −29.6 ± 9.8 −40.0 ± 11.1 −55.4 ± 13.1
Note. Mass loss and sea level equivalent are computed assuming an ice density of 900 kg/m3and an ocean area of 3.625 × 10⁸km2. WH = World Heritage. NWHS = Natural World Heritage sites.
Figure 4. The 21st century evolution of glaciers located in three natural World Heritage sites according to different CO2emission scenarios (RCP2.6, RCP4.5, and
RCP8.5). Ice volume variations (multimodel mean of 14 general circulation models ±1 standard deviation) are relative to the 2017 ice volume (in cubic kilometer with the number of glaciers and their mean area considered in each panel). Los Glaciares National Park (a; located in South America), Te
Wahipounamu‐SW New Zealand (b), and the Dolomites (c; central Europe) are displayed as examples of evolution in sites having mostly large ice cap glaciers, valley glaciers and very small glaciers, respectively. RCP = Representative Concentration Pathways; AAR = accumulation area ratio.
ice volume will rapidly decrease in sites with very small glaciers in a warming climate, while it will take longer in sites with large glaciers (Figure 4). If air temperature would stabilize in future decades as projected by RCP2.6, the smallest glaciers could rapidlyfind a new balance with climatic conditions and stop shrink-ing (AAR will be comprised between 50% and 70%) and even experience a mass gain if AAR values will exceed 70% as projected for the glaciers in Te Wahipounamu and the Dolomites (Figures 4b and 4c). Conversely, projections of glacier evolution in Los Glaciares National Park illustrate the slow response time of large glaciers (Figure 4a). The low AAR values (<50%) modeled for the glaciers in this site at the end of the 21st century indicate a strong imbalance between the remaining large ice volume and climatic conditions and thus the continuation of ice loss beyond 2100.
Overall, more than 80% of the 2017 ice volume is expected to have melted in 20 (RCP2.6) to 41 (RCP8.5) sites by 2100 and glacier extinction, defined here as the disappearance of more than 99% of the current ice volume, is forecasted in 8 (RCP2.6) to 21 (RCP8.5) sites (Figure 3a‐c and S3 and Tables 1 and S4). Compared to ice volume in 2017, the difference between estimated volume losses by 2100 for RCP2.6 and RCP8.5 is smaller than 10% in 13 sites (e.g., Figures 4c and S3 and Table S4), reflecting the irremediable future vanishing of small glaciers in unfavorable environments. In other words, at such sites glaciers will dis-appear no matter which RCP scenario occurs. Conversely, this difference is above 25% in 20 sites (e.g., Figures 4a and 4b), emphasizing the strong influence of CO2emissions scenarios and, thus, human actions
on the magnitude of ice loss. At the end of the century, the computed glacier geometry will be close to equi-librium with climate for RCP2.6 (mean AAR > 50% in 60% of the sites; e.g., Figures 4b and 4c and S4 and Table S4). However, a strong imbalance is modeled for RCP4.5 and RCP8.5 (mean AAR > 50% in only 31% and 3%, respectively, of the sites) and therefore suggests the continuation of ice loss far beyond 2100.
4. Discussion and Conclusion
Through thefirst complete inventory of glaciers located in natural World Heritage sites, the analysis of their recent evolution, and the modeling of their future mass change, this study shows that, beyond the presence of many outstanding glaciers and their particular internationally recognized World Heritage status, these glaciers are similar and representative of the other glaciers on Earth. From very small cirque glaciers to ice caps or part of the continental ice sheet, all types and sizes of glaciers can be found among the 19,039 World Heritage glaciers. Present in most of the glacierized regions on Earth (Pfeffer et al., 2014), they experi-enced the same widespread mass loss as other glaciers in response to recent anthropogenic warming (e.g., Zemp et al., 2015). Our projections on the intensification of their melt over the 21st century are in line with previous glacier modeling studies at the local, regional or global scale (e.g., Clarke et al., 2015; Kraaijenbrink et al., 2017; Marzeion et al., 2018; Radić et al., 2014; Zekollari et al., 2014). In comparison to a previous appli-cation of the global glacier model used in the present study (Huss & Hock, 2015), wefind similar trends in glacier wastage, but results are based on the newest available input data and, hence, are assumed to be more accurate.
This ongoing major and unprecedented glacier decline highlights the threat posed to the World Heritage in a changing climate. The presence of glaciers has been recognized as a natural value and is often mentioned to justify the inscription of the 46 studied sites on the World Heritage list (Table S2). Hence, the strong ice loss, and moreover, the projected glacier extinction in 8 (RCP2.6) to 21 sites (RCP8.5) over the 21st century will strongly affect the integrity and value of many of these World Heritage sites. It could even directly question the recognized OUV in sites like Swiss Alps Jungfrau‐Aletsch (Figure 2), Ilulissat Icefjord, or Kluane Wrangell St Elias Glacier Bay Tatshenshuni‐Alsek, which have been inscribed at least partly for their exceptional glaciers.
These results complete the observations and projections made on the loss of other geological and biological assets in natural World Heritage sites in a warming climate (e.g., Allan et al., 2017; Hughes et al., 2017; Osipova et al., 2017; Scheffer et al., 2015). Despite their commitment to use utmost resources, states and international community fail to preserve and conserve some valued natural features for future generations, even in the most outstanding protected areas. The current situation of the Great Barrier Reef demonstrates the complexity of nature conservation in World Heritage sites in a changing climate. The World Heritage Committee considered inscribing this site as in danger as of 2015, due to the occurrence of climatically con-trolled coral bleaching events. To prevent this undesirable inscription, the Australian government adopted a
long‐term sustainability plan (Normile & Dayton, 2014). However, the most serious bleaching event of at least 20 years occurred in 2016 (Hughes et al., 2017), illustrating that local and national efforts, as well as usual nature conservation tools, cannot address a global issue having the magnitude and the complexity of atmosphere and ocean warming. Loss and damage related to anthropogenic climate change could thereby lead to the designation of more and more World Heritage sites as in danger or with a critical state of conser-vationin the near future (Osipova et al., 2017). However, if the World Heritage status does not protect from climate change impacts, World Heritage sites currently serve to develop knowledge, mitigation, and adapta-tion policy and to raise public awareness of this issue. Increasing efforts are especially made since 2005 by the different involved stakeholders in terms of strategy and capacity building from the local to the global scale (e.g., United Nations Educational, Scientific and Cultural Organization, 2014).
In an increasing number of publications (e.g., Ceballos et al., 2017; Hughes et al., 2017; Intergovernmental Panel on Climate Change, 2018; Ripple et al., 2017; Steffen et al., 2018), the scientific community warns humanity against the critical state of climate, nature, and societies on Earth in the Anthropocene and shows that decisive actions have to be urgently taken to prevent unprecedented, damageable, and irreversible consequences. In this context and among other actions, World Heritage gla-ciers conservation could be both used as a leverage and a target for planetary‐scale climate change miti-gation. Indeed, the safeguarding of these iconic and important natural features could mobilize global‐ scale conservation and mitigation benefits. As for all glaciers and ice sheets on Earth, their preservation reinforces the compelling priority for strong and rapid reduction of greenhouse gas emissions and thereby a deep modification of human impacts on the climate. World Heritage glaciers are thus analogous to umbrella species(Simberloff, 1998), and their conservation will automatically allow and imply the conser-vation of other features threatened by global warming. As all glaciers and ice sheets, World Heritage gla-ciers have also the characteristics of keystone species (Simberloff, 1998) because of their disproportionately large impacts on nature and societies on Earth. Glaciers and ice sheets have an important influence on global climate and sea level (e.g., Intergovernmental Panel on Climate Change, 2013; Marzeion et al., 2018; Marzeion & Levermann, 2014; Steffen et al., 2018). In many regions, they strongly impact fresh-water, sediment and biogeochemicalfluxes, biodiversity, and geohazards and provide many nature's con-tributions to people(e.g., Díaz et al., 2018; Huss et al., 2017; Huss & Hock, 2018; Milner et al., 2017). Their vanishing will thus have significant natural, social, economical, and migratory cascading consequences and could contribute to push and lock our planet beyond a threshold where the Earth would become a dangerous and uncontrollable hothouse (Steffen et al., 2018). Endangered World Heritage glaciers are finally similar to flagship species (Simberloff, 1998) because these emblematic and sensitive features have a large potential to raise global awareness, especially in view of the clear international commitment to protect World Heritage sites from damage or loss.
All of this emphasizes the compelling need and opportunity to act against worldwide (World Heritage) glacier decline. Supporting recentfindings (Marzeion et al., 2018), our results show how drastic reduc-tions of emissions (notably the achievement of RCP2.6) will rapidly curb melt rates to safeguard a large glacier volume in the long‐term, limiting sea level rise and other cascading consequences. Within this scope, individual and collective actions (e.g., Intergovernmental Panel on Climate Change, 2014, 2018; Ripple et al., 2017; Wynes & Nicholas, 2017) are proposed to achieve the rapid and far‐reaching societal transition required to respect the commitments made during thefirst worldwide climate agreement in 2015 in Paris.
References
Allan, J. R., Venter, O., Maxwell, S., Bertzky, B., Jones, K., Shi, Y., & Watson, J. E. M. (2017). Recent increases in human pressure and forest loss threaten many natural World Heritage Sites. Biological Conservation, 206, 47–55. https://doi.org/10.1016/j.biocon.2016.12.011 Bauder, A., Funk, M., & Huss, M. (2007). Ice‐volume changes of selected glaciers in the Swiss Alps since the end of the 19th century. Annals
of Glaciology, 46, 145–149.
Berthling, I. (2011). Beyond confusion: Rock glaciers as cryo‐conditioned landforms. Geomorphology, 131, 98–106. https://doi.org/10.1016/ j.geomorph.2011.05.002
Bosson, J. B., & Lambiel, C. (2016). Internal structure and current evolution of small debris‐covered glacier systems located in alpine permafrost environments. Frontiers in Earth Science, 4, 39. https://doi.org/10.3389/feart.2016.00039
Brun, F., Berthier, E., Wagnon, P., Kääb, A., & Treichler, D. (2017). A spatially resolved estimate of High Mountain Asia glacier mass balances from 2000 to 2016. Nature Geoscience, 10, 668–673. https://doi.org/10.1038/ngeo2999
Acknowledgments
All data are available on the archived storage (https://zenodo.org/record/ 2558185#.XFxHMKd7TxV). This research was designed at the IUCN's World Heritage Programme under the supervision of T. Badman. The content of this article was noticeably improved through discussions with many scientists over the last months. Among them N. Deluigi, R. Darbellay, F. Arthaud, S. Cauvy‐Fraunié, D. Samyn, N. Mugnier, G. Coste, I. Joughin, S. Vivero, E. R. Bosson, M. Fischer, and M. Loridon especially helped us during stages of data collection, processing, and results discussions. We also thank all the colleague involved in the global effort of glacier inventories (especially the RGI Consortium), who made this study possible. We acknowledge Aletsch Arena for the picture in Figure 2. Wefinally thank the Editor and the two anonymous reviewers for their very constructive comments that improved this article.
Ceballos, G., Ehrlich, P. R., & Dirzo, R. (2017). Biological annihilation via the ongoing sixth mass extinction signalled by vertebrate population losses and decline. Proceedings of the National Academy of Sciences of the United States of America, 114, E6089–E6096. https:// doi.org/10.1073/pnas.1704949114
Church, J. A., Clark, P. U., Cazenave, A., Gregory, J. M., Jevrejeva, S., Levermann, A., et al. (2013). Sea level change. In T. F. Stocker et al. (Eds.), Climate change 2013: The physical science basis. Contribution of Working Group I To the Fifth Assessment Report of the
Intergovernmental Panel on Climate Change(pp. 1137–1216). Cambridge: Cambridge University Press.
Clarke, G. K., Jarosch, A. H., Anslow, F. S., Radić, V., & Menounos, B. (2015). Projected deglaciation of western Canada in the twenty‐first century. Nature Geoscience, 8(5), 372.
Das, I., Hock, R., Berthier, E., & Lingle, C. S. (2014). 21st‐century increase in glacier mass loss in the Wrangell Mountains, Alaska, USA, from airborne laser altimetry and satellite stereo imagery. Journal of Glaciology, 60, 283–293. https://doi.org/10.3189/2014JoG13J119 Dee, D. P., Uppala, S. M., Simmons, A. J., Berrisford, P., Poli, P., Kobayashi, S., et al. (2011). The ERA‐Interim reanalysis: Configuration and
performance of the data assimilation system. Quarterly Journal of the Royal Meteorological Society, 137(656), 553–597. https://doi.org/ 10.1002/qj.828
Díaz, S., Pascual, U., Stenseke, M., Martín‐López, B., Watson, R. T., Molnár, Z., Hill, R., et al. (2018). Assessing nature's contributions to people. Science, 359(6373), 270–272. https://doi.org/10.1126/science.aap8826
Gachev, E., Stoyanov, K., & Gikov, A. (2016). Small glaciers on the Balkan Peninsula: State and change in the last several years. Quaternary
International, 415, 33–54. https://doi.org/10.1016/j.quaint.2015.10.042
Gardner, A. S., Moholdt, G., Cogley, J. G., Wouters, B., Arendt, A. A., Wahr, J., et al. (2013). A reconciled estimate of glacier contributions to sea level rise: 2003 to 2009. Science, 340(6134), 852–857. https://doi.org/10.1126/science.1234532
Haran, T., Bohlander, J., Scambos, T., & Joughin, I. (2017). MEaSUREs Greenland Monthly Image Mosaics from MODIS, Version 1. [mog100_201609_hp1_v01]. Boulder, Colorado. NASA National Snow and Ice Data Center Distributed Active Archive Center. https://doi.org/10.5067/6L166FFRPCPP
Howat, I. M., Ahn, Y., Joughin, I., van den Broeke, M. R., Lenaerts, J. T. M., & Smith, B. (2011). Mass balance of Greenland's three largest outlet glaciers, 2000–2010. Geophysical Research Letters, 38, L12501. https://doi.org/10.1029/2011GL047565
Howat, I. M., Negrete, A., & Smith, B. E. (2014). The Greenland Ice Mapping Project (GIMP) land classification and surface elevation data sets. The Cryosphere, 8, 1509–1518. https://doi.org/10.5194/tc‐8‐1509‐2014
Hughes, T. P., Kerry, J. T., Álvarez‐Noriega, M., Álvarez‐Romero, J. G., Anderson, K. D., Baird, A. H., et al. (2017). Global warming and recurrent mass bleaching of corals. Nature, 543(7645), 373–377. https://doi.org/10.1038/nature21707
Huss, M., Bookhagen, B., Huggel, C., Jacobsen, D., Bradley, R. S., Clague, J. J., et al. (2017). Toward mountains without permanent snow and ice. Earth's Future, 5(5), 418–435. https://doi.org/10.1002/2016EF000514
Huss, M., & Farinotti, D. (2012). Distributed ice thickness and volume of all glaciers around the globe. Journal of Geophysical Research, 117, F04010. https://doi.org/10.1029/2012JF002523
Huss, M., & Hock, R. (2015). A new model for global glacier change and sea‐level rise. Frontiers in Earth Science, 3, 54. https://doi.org/ 10.3389/feart.2015.00054
Huss, M., & Hock, R. (2018). Global‐scale hydrological response to future glacier mass loss. Nature Climate Change, 135–140. https://doi. org/10.1038/s41558‐017‐0049‐x
Huss, M., Jouvet, G., Farinotti, D., & Bauder, A. (2010). Future high‐mountain hydrology: A new parameterization of glacier retreat.
Hydrology and Earth System Sciences, 14, 815.
Intergovernmental Panel on Climate Change (2013). Climate change 2013: The physical science basis: Working Group I Contribution to the
Fifth Assessment Report of the Intergovernmental Panel on Climate Change(p. 1535). Cambridge, UK, and New York: Cambridge University Press.
Intergovernmental Panel on Climate Change (2014). Climate change 2014: Mitigation of climate change. Contribution of Working Group III
Contribution to the Fifth Assessment Report of the Intergovernmental Panel on Climate Change. Cambridge, UK, and New York: Cambridge University Press.
Intergovernmental Panel on Climate Change (2018). Global warming of 1.5°C. IPCC special report on the impacts of global warming of 1.5 °C above pre‐industrial levels and related global greenhouse gas emission pathways, in the context of strengthening the global response to the threat of climate change, sustainable development, and efforts to eradicate poverty. Retrieved from https://www.ipcc.ch/report/ sr15/
Jarvis, A., Reuter, H. I., Nelson, A., & Guevara, E. (2008). Hole‐filled SRTM for the globe version 4. available from the CGIAR‐CSI SRTM 90m Database (https://srtm.csi.cgiar.org).
Joughin, I., Moon, T., Joughin, J., & Black. T. (2017), MEaSUREs annual Greenland outlet glacier terminus positions from SAR mosaics, Version 1. [termini_1617_v01.1]. Boulder, Colorado. NASA National Snow and Ice Data Center Distributed Active Archive Center. https://doi.org/10.5067/DC0MLBOCL3EL
Jouvet, G., Huss, M., Funk, M., & Blatter, H. (2011). Modelling the retreat of Grosser Aletschgletscher, Switzerland, in a changing climate.
Journal of Glaciology, 57(206), 1033–1045.
Kjeldsen, K. K., Korsgaard, N. J., Bjørk, A. A., Khan, S. A., Box, J. E., Funder, S., et al. (2015). Spatial and temporal distribution of mass loss from the Greenland Ice Sheet since AD 1900. Nature, 528(7582), 396–400. https://doi.org/10.1038/nature16183
Kraaijenbrink, P. D. A., Bierkens, M. F. P., Lutz, A. F., & Immerzeel, W. W. (2017). Impact of a global temperature rise of 1.5 degrees Celsius on Asia's glaciers. Nature, 549(7671), 257.
Li, H., Beldring, S., Xu, C. Y., Huss, M., Melvold, K., & Jain, S. K. (2015). Integrating a glacier retreat model into a hydrological model—Case studies of three glacierised catchments in Norway and Himalayan region. Journal of Hydrology, 527, 656–667.
López‐Moreno, J. I., Revuelto, J., Rico, I., Chueca‐Cía, J., Julián, A., Serreta, A., et al. (2016). Thinning of the Monte Perdido Glacier in the Spanish Pyrenees since 1981. The Cryosphere, 10(2), 681–694. https://doi.org/10.5194/tc‐10‐681‐2016.
Mackintosh, A. N., Anderson, B. M., Lorrey, A. M., Renwick, J. A., Frei, P., & Dean, S. M. (2017). Regional cooling caused recent New Zealand glacier advances in a period of global warming. Nature Communications, 8, 14202. https://doi.org/10.1038/ ncomms14202
Marzeion, B., Cogley, J. G., Richter, K., & Parkes, D. (2014). Attribution of global glacier mass loss to anthropogenic and natural causes.
Science, 345, 919–921. https://doi.org/10.1126/science.1254702
Marzeion, B., Kaser, G., Maussion, F., & Champollion, N. (2018). Limited influence of climate change mitigation on short‐term glacier mass loss. Nature Climate Change, 8(4), 305–308. https://doi.org/10.1038/s41558‐018‐0093‐1
Marzeion, B., & Levermann, A. (2014). Loss of cultural world heritage and currently inhabited places to sea‐level rise. Environmental
Meinshausen, M., Smith, S. J., Calvin, K., Daniel, J. S., Kainuma, M. L. T., Lamarque, J. F., et al. (2011). The RCP greenhouse gas con-centrations and their extensions from 1765 to 2300. Climatic Change, 109(1‐2), 213–241. https://doi.org/10.1007/s10584‐011‐0156‐z Milner, A. M., Khamis, K., Battin, T. J., Brittain, J. E., Barrand, N. E., Füreder, L., et al. (2017). Glacier shrinkage driving global changes in
downstream systems. Proceedings of the National Academy of Sciences of the United States of America, 114(37), 9770–9778. https://doi. org/10.1073/pnas.1619807114.
Morin, P., Porter, C., Cloutier, M., Howat, I., Noh, M.‐J., Willis, M., ... Peterman, K. (2016). ArcticDEM; A publically available, high resolution elevation model of the Arctic. In EGU General Assembly Conference Abstracts 18, 8396.
MRI Working Group (2015). Elevation‐dependent warming in mountain regions of the world. Nature Climate Change, 5, 424–430. https:// doi.org/10.1038/nclimate2563
Oerlemans, J., & Nick, F. M. (2005). A minimal model of a tidewater glacier. Annals of Glaciology, 42, 1–6.
Osipova E., Shadie, P., Zwahlen, C., Osti, M., Shi, Y., Kormos, C. F., et al. (2017). IUCN World Heritage Outlook 2: A conservation assessment of all natural world heritage sites, IUCN, Gland, Switzerland.
Pfeffer, W. T., Arendt, A. A., Bliss, A., Bolch, T., Cogley, J. G., Gardner, A. S., et al., & The Randolph Consortium (2014). The Randolph Glacier Inventory: A globally complete inventory of glaciers. Journal of Glaciology, 60(221), 537–552. https://doi.org/10.3189/ 2014JoG13J176
Radić, V., Bliss, A., Beedlow, A. C., Hock, R., Miles, E., & Cogley, J. G. (2014). Regional and global projections of twenty‐first century glacier mass changes in response to climate scenarios from global climate models. Climate Dynamics, 42, 37–58. https://doi.org/10.1007/s00382‐ 013‐1719‐7
Reimann, L., Vafeidis, A. T., Brown, S., Hinkel, J., & Tol, R. S. J. (2018). Mediterranean UNESCO World Heritage at risk from coastal flooding and erosion due to sea‐level rise. Nature Communications, 9, 4161. https://doi.org/10.1038/s41467‐018‐06645‐9
RGI Consortium (2017). Randolph Glacier Inventory—A dataset of global glacier outlines: Version 6.0. Technical Report, Global Land Ice Measurements from Space, Colorado. Digital Media. https://doi.org/10.7265/N5‐RGI‐60. Data available on https://www.glims.org/RGI Ripple, W. J., Wolf, C., Newsome, T. M., Galetti, M., Alamgir, M., Crist, E., et al. (2017). World scientists' warning to humanity: A second
notice. Bioscience, 67. https://doi.org/10.1093/biosci/bix125
Schaefer, M., Machguth, H., Falvey, M., Casassa, G., & Rignot, E. (2015). Quantifying mass balance processes on the Southern Patagonia Icefield. The Cryosphere, 9, 25–35. https://doi.org/10.5194/tc‐9‐25‐2015
Scheffer, M., Barrett, S., Carpenter, S. R., Folke, C., Green, A. J., Holmgren, M., et al. (2015). Creating a safe operating space for iconic ecosystems. Science, 347(6228), 1317–1319. https://doi.org/10.1126/science.aaa3769
Seibert, J., Vis, M. J., Kohn, I., Weiler, M., & Stahl, K. (2018). Representing glacier geometry changes in a semi‐distributed hydrological model. Hydrology and Earth System Sciences, 22(4), 2211–2224.
Simberloff, D. (1998). Flagships, umbrellas, and keystones: Is single‐species management passé in the landscape era. Biological
Conservation, 83, 247–257.
Steffen, W., Rockström, J., Richardson, K., Lenton, T. M., Folke, C., Liverman, D., et al. (2018). Trajectories of the Earth system in the Anthropocene. Proceedings of the National Academy of Sciences of the United States of America, 115(33), 8252–8259. https://doi.org/ 10.1073/pnas.1810141115
Tachikawa, T., Hato, M., Kaku, M., & Iwasaki, A. (2011). Characteristics of ASTER GDEM version 2. In IEEE International on Geoscience
and Remote Sensing Symposium (IGARSS)(pp. 3657–3660). Vancouver, Canada: IEEE.
Taylor, K. E., Stouffer, R. J., & Meehl, G. (2012). An overview of CMIP5 and the experiment design. Bulletin of the American Meteorological
Society, 93, 485–498.
Thompson, L. G., Mosley‐Thompson, E., Davis, M. E., & Brecher, H. H. (2011). Tropical glaciers, recorders and indicators of climate change, are disappearing globally. Annals of Glaciology, 52, 23–34.
United Nations Educational, Scientific and Cultural Organization (1972). Convention concerning the protection of the world cultural and natural heritage.
United Nations Educational, Scientific and Cultural Organization (2014). Climate change adaptations for natural world heritage sites, A practical guide, World Heritage Papers Series, 37, Paris, France.
Wynes, S., & Nicholas, K. A. (2017). The climate mitigation gap: Education and government recommendations miss the most effective individual actions. Environmental Research Letters, 12, 074024. https://doi.org/10.1088/1748‐9326/aa7541
Zekollari, H., Fürst, J. J., & Huybrechts, P. (2014). Modelling the evolution of Vadret da Morteratsch, Switzerland, since the little ice age and into the future. Journal of Glaciology, 60(224), 1155–1168.
Zemp, M., Frey, H., Gärtner‐Roer, I., Nussbaumer, S. U., Hoelzle, M., Paul, F., et al. (2015). Historically unprecedented global glacier decline in the early 21st century. Journal of Glaciology, 61(228), 745–762. https://doi.org/10.3189/2015JoG15J017.
Zemp, M., Frey, H., Gärtner‐Roer, I., Nussbaumer, S. U., Hoelzle, M., Paul, F., & Haeberli, W. (2012). WGMS, Fluctuations of glaciers 2005– 2010 (Vol. X), ICSU (WDS)/IUGG (IACS). UNEP/UNESCO/WMO, World Glacier Monitoring Service, Zurich, Switzerland.