HAL Id: hal-02565467
https://hal.archives-ouvertes.fr/hal-02565467
Submitted on 6 May 2020HAL is a multi-disciplinary open access
archive for the deposit and dissemination of sci-entific research documents, whether they are pub-lished or not. The documents may come from teaching and research institutions in France or abroad, or from public or private research centers.
L’archive ouverte pluridisciplinaire HAL, est destinée au dépôt et à la diffusion de documents scientifiques de niveau recherche, publiés ou non, émanant des établissements d’enseignement et de recherche français ou étrangers, des laboratoires publics ou privés.
Flow and fate of silver nanoparticles in small French
catchments under different land-uses: The first one-year
study
Jialan Wang, Enrica Alasonati, Mickael Tharaud, Alexandre Gelabert, Paola
Fisicaro, Marc F. Benedetti
To cite this version:
Jialan Wang, Enrica Alasonati, Mickael Tharaud, Alexandre Gelabert, Paola Fisicaro, et al.. Flow and fate of silver nanoparticles in small French catchments under different land-uses: The first one-year study. Water Research, IWA Publishing, 2020, 176, pp.115722. �10.1016/j.watres.2020.115722�. �hal-02565467�
Flow and fate of silver nanoparticles in small French catchments under
1different land-uses: The first one-year study
23
Jia-Lan Wang1, 2, Enrica Alasonati2, Mickaël Tharaud1, Alexandre Gelabert1, Paola
4
Fisicaro2, Marc F. Benedetti1*
5 6
1 Université de Paris, Institut de physique du globe de Paris, CNRS, F-75005 Paris,
7
France.
8
2 Department of Biomedical and Inorganic Chemistry, Laboratoire National de
Métro-9
logie et d Essais (LNE), 1 rue Gaston Boissier, Paris, 75015 France
10 11 12 13 *Corresponding author 14
Email: [email protected] (M. F. Benedetti)
15 Phone number: +33 1 83 95 76 95 16 17 18 19 20 *Manuscript
Abstract 21
This study focused on surface waters from three small creeks, within the Seine River
22
watershed, which are characterized by different land-uses, namely forested, agricultural
23
and urban. Silver nanoparticles (Ag-NPs) in these waters were detected and quantified
24
by single-particle ICPMS during one-year of monthly sampling. Their temporal and
25
spatial variations were investigated. Ag-NPs, in the three types of surface water, were
26
found to range from 1.5 x10⁷ to 2.3 x 10⁹ particles L-1 and from 0.4 to 28.3 ng L-1 at
27
number and mass concentrations, respectively. These values are in consistent with the
28
very few previous studies.
29
In addition, the role of factors driving process and potential sources are discussed with
30
correlations between Ag-NPs concentrations and biogeochemical parameters, like
dis-31
solved organic carbon concentration and divalent cations concentrations. For the
forest-32
ed watershed NOM controls the stability (number and mass) of the Ag-NPs as recently
33
observed in the field in lake water in Germany. In the case of the agricultural and urban
34
watersheds major cations such as Ca would control the number and mass of Ag-NPs.
35
Dilution processes are rejected as conductivity and Cl- ions do not show significant
cor-36
relations with Ag-NPs or other major geochemical parameters. The specific exportation
37
rates of Ag-NPs for artificial, agricultural and forested areas were calculated based on
38
the monthly data for the full year and are equal to 5.5 ± 3.0, 0.5 ± 0.3 and 0.2 ± 0.2 gy
-39
1km-2, respectively. These data suggest a constant release of Ag-NPs from consumer
40
products into freshwaters in artificial areas, for instance, from textiles, washing
ma-41
chines, domestic tap-water filters, outdoor paints.
42
These first data of Ag-NPs fluxes in surface waters of France enlarge the very limited
43
database of field measurements. Moreover, for the first time, the influence of time,
land-44
use and aquatic geochemistry parameters on Ag-NPs in real natural water samples is
reported. It is also helpful to further understand the fate and the process of Ag-NPs in
46
natural waters, as well as to the ecotoxicity studies in real-world environment.
47 48
Keywords 49
Silver nanoparticles; surface water; single particle ICPMS; land-use; fate; concentration
1. Introduction 51
The first report of silver colloids goes back to 130 years ago in 1889 (Lea, 1889). For
52
decades, nanosilver was mostly used under different names (Collargol, Argyrol, and
53
Protargol) in therapeutic treatments (Nowack et al., 2011). More recently, the
introduc-54
tion and rapid development of nanotechnology opened up wider applications of silver
55
nanoparticles, including textiles, cosmetics, food packaging, medical devices, catalysts,
56
electronics, biosensors Moreover, silver nanoparticles are reported by Vance (Vance,
57
2015) as the most frequently used nanomaterial and found in 435 consumer products
58
(24% of total items). In a more general way, these silver nanoparticles may find their
59
way into natural waters during their life-cycle. Even though wastewater treatment plants
60
(WWTPs) are effective to remove silver nanoparticles, nano-sized silver/silver sulfides
61
were found in the effluent of WWTPs (Wang et al., 2018). For Europe input rate via
62
WWTP residues to soils is estimated 0.37 tons.y-1 and 4.7 tons.y-1 to large rivers (Wang
63
et al., 2018). In addition to anthropogenic sources, silver nanoparticles could be also
64
naturally formed from the silver ions in the water or in soils as recently reported by
65
Huang et al (2019) for soils and Wimmer et. al. (2018) for fresh waters. Johnson et al.
66
(2005) have estimated for France an input of 11 tons y-1 of anthropogenic bulk silver
67
from waste management to surface environments. Official registration in France
recent-68
ly reported 10 kg in 2017 (R-nano: https://www.r-nano.fr) that is a very small amount,
69
so we would not expect so see too much engineered nano-Ag in waters. However, using
70
the data of Wang et al. (2018) for Europe and downscaling it to France, using Europe
71
and France populations as the scaling factor, we can also estimate that 27 kg Ag-Nano
72
y-1 and 425 kg Ag-Nano y-1 will be delivered to soils and waters, respectively.
73
This extensive spreading of nano-sized silver and the lack of information regarding their
74
long-term effect inevitably cause emerging concerns about their potential risks to
aquat-75
ic ecosystems and/or humans. Despite a long history of use, more and more studies
showed their adverse impacts on aquatic and terrestrial organisms, mammalian cells,
77
and potentially on human health (Bian et al., 2019; Dobrzyńska and Kruszewski, 2014;
78
Gaillet and Rouanet, 2015; Johnston et al., 2010). Musee (Musee, 2010) modeled their
79
possible toxicity to the aquatic ecosystems of the city of Johannesburg, witharisk
quo-80
tient (defined as the ratio of the estimated environmental exposure to the predicted
no-81
effect concentration) mostly > 1.
82
The detection and quantification of nanosized silver, from different sources ranging
83
from engineered and incidental to natural ones in the environment and named from here
84
and after Ag-NPs, is however quite limited because of their expected low concentrations
85
and the biogeochemical complexity of aquatic ecosystems. To circumvent this
limita-86
tion, material flow analysis models have been developed to predict environmental
con-87
centrations since 2007 (Boxall et al., 2007). The modeled concentrations of Ag-NPs in
88
surface waters vary significantly, from 0.008 to 619 ng L-1, depending on modeling
pa-89
rameters and studied sites (Dumont et al., 2015; Good et al., 2016; Gottschalk et al.,
90
2015; Mueller and Nowack, 2008; Musee, 2010; O Brien and Cummins, 2010; Silva et
91
al., 2011; Sun et al., 2016). However, these predictions are currently not validated due
92
to the lack of field measurements in aquatic environments which also limits the further
93
advancement of modeling in other domains, such as their fate and toxicology in
com-94
plex ecosystems. There is thus an urgent need for frequent and robust measurements of
95
Ag-NPs concentrations on fluxes in continental surface waters.
96
A first issue is that to date, only a limited number of studies are available on the
quanti-97
fication of Ag-NPs in freshwaters. Some of them confirmed the presence of colloidal
98
(Wen et al., 1997) and more recently nano silver in wastewater effluent and river water
99
(Mitrano et al., 2012; Peters et al., 2018; Yang and Wang, 2016). However, most studies
100
either focus on one sampling site or several sites along the same river for which a single
sampling is performed. Moreover, those studies do not try to relate changes in
concen-102
tration or size of Ag-NPs to bulk geochemical parameters (i.e., pH, dissolved organic
103
carbon concentration, ionic strength, redox ) of the aquatic ecosystems. As for any
104
other type of natural colloids (Benedetti et al., 2003b; Ilina et al., 2016), it is also
ex-105
pected that the Ag-NPs flux will vary along the river and with the hydrological and
cli-106
matic variations during the year. This knowledge is critical to build better material flow
107
analysis models that can take into account such variations if they exist, and give outputs
108
that can be compared to real field data like the one collected in this work.
109
The second issue is the identification, in the field, of the mechanisms and sources that
110
could account for the variations of measured concentrations and fluxes of Ag-NPs
111
among different type of waters. Indeed, most of the processes reported in literature are
112
determined from laboratory experiments (Shevlin et al., 2018) or small scale column
113
experiments to understand the fate of Ag-NPs in soils solutions and their migration
to-114
wards continental waters (Yang et al., 2014). This vast literature reports that organic
115
matter (OM), pH, ionic strength, redox conditions and the concentration of charged
cat-116
ions (i.e., Ca2+, Al3+ ) are critical parameters that will control the number and size of
117
Ag-NPs in such designed experiments. Only recently, Wimmer et al. (2018) showed
118
that in field, in lake water, OM promoted the formation of AgNPs. These factors were
119
also shown to be important for the fate of trace metals and contaminants in a watershed
120
under a high anthropogenic pressure like the Seine River (Bonnot et al., 2016). The
di-121
rect evidence, from field data, of the role played by such drivers is still missing. It is
122
therefore important to explore how they will be effectively related to changes in
concen-123
tration, size and flux of Ag-NPs in river watersheds.
124
The third issue, generally addressed in material flow analysis models but not in today
125
published field studies, is the impact of the land-use within a watershed. For instance,
for the whole Seine River watershed, an increase in trace metal concentrations from
127
« pristine » headwaters to heavily impacted urban-waters was reported (Chen et al.,
128
2014; Grosbois et al., 2006; Horowitz et al., 1999), with a significant impact of Paris
129
conurbation due to wastewater treatment plants and combined sewer overflow inputs
130
(Estebe, A., Mouchel, J.M. Thévenot, 1998; Garban B, Ollivon D, Carru AM, 1996). In
131
addition, a recent field monitoring of Ag-NPs was conducted on Meuse and Ijssel
wa-132
tersheds which are characterized by different land-uses (Peters et al., 2018). Based on
133
the measured concentrations of Ag-NPs from this study, a first order estimation of the
134
Ag-NPs normalized export-rates can be calculated using an annual average discharge
135
rate and watershed area (source Wikipedia, 2018). We calculated the export-rates
nor-136
malized per km2 or per capita and they are equal to 0.3 g km-2y-1 (1 mg Ag-NPs capita
-137
1y-1) and 2.0 g km-2y-1 (6 mg Ag-NPs capita-1y-1), for the Meuse and Ijssel rivers,
re-138
spectively. Using only the 10 kg of nano-engineered /year declared in the R-nano
data-139
base gives a rate of release equal to 0.15 mg Ag-NPs/ /capita for France . Potential
140
explanations for such differences in two rivers are: their different processes governing
141
the fate of the NPs along the rivers course, their differences in soils nature and in
com-142
positions, and may be the most importantly, their differences in land-use. For instance,
143
the Meuse basin is comprised by croplands (39%), forests (29%), pastures (18%) and
144
built up areas (12%) by the end of the 20th century (Lambert et al., 2017); while rural
145
areas characterize the Ijssel watershed with intensive agricultural dominating with
146
croplands covering 70% of the basin (Verwijmeren and Wiering, 2007). Putting aside
147
the obvious effect of the land-use for the contaminants and Ag-NPs sources
mobiliza-148
tion, one can wonder to what extent are the normalized fluxes of Ag-NPs governed by
149
the land-use, or if these fluxes are only regulated by the above mentioned
biogeochemi-150
cal drivers. The answers to these questions will help to better constrain the hypothesis
151
made in material flow analysis models. They will also provide an accurate range of
NPs environmental concentrations in combination with realistic biogeochemical
param-153
eter values to be tested in future studies on Ag-NPs toxicity toward aquatic fauna.
154
To address those issues, the best approach is to sample waters from low to heavily
hu-155
man-impacted territories and to precisely assess the seasonal dynamics of Ag-NPs under
156
such different land-uses. The present study relies on concentration analysis for the
dis-157
solved (< 1 kDa) and nano-particulate silver in three characteristic sub-basins (i.e.,
for-158
ested, agricultural, and urban), selected in a previous study on the identification of trace
159
element geochemical background values in the Seine River watershed (Bonnot et al.,
160
2016). Small size sub-watersheds (< 120 km2) were chosen as the water samples will be
161
prone to rapid modifications of their biogeochemical parameters as a function of
hydro-162
climatic and land-use changes, in order to identify their role on the Ag-NPs
concentra-163
tion and fate and to inter-compare export rates specific to these three land-uses.
164
2. Materials and Methods 165
2.1 Sampling sites and protocol 166
167
Figure 1: Characteristics of three sampling catchments (Agriculture, Forested and Urban) in the Seine River watershed of France.
168
Data to built the maps are from Bonnot et al, (2016). Arrows pointing to the sampling location, exact coordinates are given in the
169
supplementary material.
The three sampling sites are located on the west of Paris. Their lithology and land uses,
171
composed of artificial surfaces, agricultural areas and natural areas, are given in Fig. 1.
172
Detailed information on the watersheds area, distribution of land uses and discharge
173
rates as measured during this study are given in Table S1. A snapshot of the water
geo-174
chemistry was obtained by grab sampling of the three creek waters taken each month or
175
each two months from October 2016 to December 2017 for Ag-NPs detection, using 1 L
176
polyethylene containers. Before field sampling, the containers were previously washed
177
with 1 N HCl for 2 days, then rinsed three times with MQ water in the laboratory. On
178
each sampling site, one 1 L bottle was placed horizontally at the surface (about 10 cm)
179
of creek until filled by water and it was done within 5 to 10 seconds depending of the
180
flow rate. For the urban watershed, the water was collected from a bridge with a bucket
181
and the 1L bottle filed directly with the bucket in less than 5 seconds.
182
To evaluate the sampling effect, three additional samplings were performed for each
183
sampling site during three field missions. Sampling replicates were individually
ana-184
lyzed to evaluate the contribution of sampling to the overall uncertainty. The sampling
185
effect was evaluated by performing ANOVA test for water sampling replicates, and was
186
not significant.
187
The pH, dissolved oxygen and conductivity were measured in the field using Multi
188
3410 Multiparameter Meter. The sensors and electrodes were calibrated before field
189
measurements in the lab and the calibration verified in the field prior to measurements.
190
Various sub-aliquots were filtered in the field through 0.22 µm (cellulose acetate) for
191
analysis of the dissolved anions (non-acidified) and cations (acidified). Triplicate
sub-192
samples were acidified with 65% HNO3 for trace elements and rare earth elements
anal-193
ysis. Glass vials previously washed with acid, rinsed and pyrolyzed at 500°C were used
194
to store samples for the analysis of dissolved organic carbon (DOC) obtained from
an-195
other aliquot filtered through 0.7 µm glass microfiber filters, and acidified with 85%
H3PO4. All containers and materials used for sampling were rinsed three times with
riv-197
er waters in the field before collection.
198
Unacidified, unfiltered sub-samples were immediately analyzed back to laboratory for
199
alkalinity determination and all the others above-mentioned samples were stocked at
200
4°C prior to analysis. The alkalinity was measured by titration with 10-2 mol L-1 HCl
201
(Titrando 809, Metrohm). The DOC was analyzed with a Total Organic Carbon
Ana-202
lyzer (TOC-L, Shimazu). The anions were quantified with ion chromatography (Dionex
203
ICS 1100, Thermo Scientific®). The cations were analyzed with an ICP-AES (iCAP
204
6200 Series, Thermo Scientific®). So-called dissolved (i.e., < 0.22 µm and < 1 kDa)
205
trace element concentrations were determined with a HR-ICP-MS (Element II, Thermo
206
Scientific®) and the raw data were treated with uFREASI software (Tharaud et al.,
207
2015). Immediately after field sampling, in the laboratory, an aliquot (500 mL) of the
208
bulk 1 L sample, taken for Ag-NPs analysis, was ultra-filtered through 1 kDa
(regener-209
ated cellulose) in order to remove all the particles present in waters to get access to the
210
fraction of free Ag ions and Ag bound to organic matter or associated to nanoparticles
211
smaller than a few nanometers ( 1.3 nm) (Guo and Santschi, 2007). This ultra-filtrate
212
was further used as the matrix to prepare all standards and solutions for sp-ICPMS
213
analysis. It aims at conserving the same environment of Ag-NPs in waters and avoiding
214
matrix effect during measurement.
215
Digestion of bulk water 216
Additionally in 2019, the total silver was quantified after acid digestion in 9 samples,
217
which came from the urban watershed. A sub sample of 10 mL was taken for total silver
218
analysis in triplicates and mineralized with a mixture of 3 concentrated acids (3 mL
219
HCl, 1 mL HNO3 and 0.5 mL HF) in a PFA closed vessel and heated for 24 H at 105
220
°C. After the digestion the mixture was evaporated at 85 °C to dryness. The residue was
221
then dissolved in 10 mL of 2% HNO3. Blanks were run at the same time in triplicates
and PFA vessels were cleaned with a concentrated HNO3 at 120 °C before use and
223
rinsed 3 times with MQ water.
224 225
2.2 Single-particles ICPMS (sp-ICPMS) measurements of Ag-NPs 226
Instrumental parameter and standard preparation 227
A high resolution ICPMS - Thermo Scientific ELEMENT II was used for Ag-NPs
228
measurements in this study. It was joined with a quartz cyclonic spray chamber and a
229
PFA MicroFlow nebulizer. The peristaltic pump rate was set at 12 rpm generating a
230
sample uptake flow of 0.2 mL min-1. Certified reference material Au nanoparticles of 60
231
nm (RM8013, NIST) was used to determine sample loss during sample uptake (ca.
232
transport efficiency). The Au-NP stock suspension was diluted 2.5 x 10⁵ times in the
233
ultra-filtered matrix to achieve a proper particle concentration for sp-ICPMS
measure-234
ments and avoid NPs coincidence at milli-second dwell-time. Dissolved calibration
235
curves (Au: 50 to 5000 ng L-1; Ag: 50 to 1000 ng L-1) were prepared in the ultra-filtered
236
matrix to determine the element sensitivity in the same matrix as the water samples and
237
thus prevent matrix effect. The analysis of Ag-NPs in river waters was carried out with
238
1 ms dwell time, and 1 ms settling time (Tharaud et al., 2017). 10 000 data points were
239
acquired and the isotope 107Ag and 197Au were measured in low resolution mode and
240
each measurement was performed in triplicate which allows to calculate means and
241
standard deviations. The dilution of the natural water samples was unnecessary
consid-242
ering the expected low concentrations in natural waters. All suspensions and solutions
243
were freshly prepared, with the minimum delay between sampling and analysis.
244
Data processing 245
According to the literature, the transport efficiency (TE) is needed to determine the
con-246
centration and size of Ag-NPs in river waters and can be obtained by three methods,
247
based on 1) waste collection, 2) particle size, and 3) particle frequency (Pace et al.,
2011). Here, the second method is selected since the reference material used in this
249
study is better certified for the particle size than the particle concentration. Taking into
250
account the matrix effect, TE was determined independently for each type of river
wa-251
ter. The calculation method and the formula of TE are detailed in the supplementary
252
materials.
253
Before data processing can be performed, NPs must be correctly distinguished from the
254
dissolved background. Different methods exist to determine the threshold between
dis-255
solved and particulate fractions, such as average plus 3 (Pace et al., 2012), iterative
256
algorithms with 3 (Tuoriniemi and Hassellöv, 2012) or simply by using the first
mini-257
mum as the boundary between dissolved fraction and NPs (Montaño et al., 2014).
How-258
ever, for the size range expected for Ag-NPs (Peters et al., 2018), those approaches
259
could lead to a large number of false negatives during NPs counting (i.e.,
underestima-260
tion of the representative number of NPs events). Instead, we used in this study another
261
approach to prevent such artifacts: the subtraction method. It is analogous to the
262
deconvolution method (Cornelis and Hassellöv, 2014), but uses the ultra-filtered natural
263
waters as the blank. Because the ultra-filtrate was supposed to best represent the
realis-264
tic dissolved background in case of natural water samples. Basically, the histogram of
265
frequency vs intensity of the ultra-filtrate through 1 kDa is subtracted from that of the
266
raw water sample using the same bin-width (same range of intensity for each bin of both
267
histograms). The resulting histogram is then used to calculate the concentration and size
268
of Ag-NPs. Calculations of particle-number concentration from the signal frequency,
269
and of particle size from the signal intensity, are well-described in literature. Here we
270
used the procedure developed by Pace and co-workers (Pace et al., 2011).
271
3. Results and Discussion 272
3.1 Ag-NPs concentrations in three waters 273
Table 1. Concentration and size of Ag-NPs measured in surface waters from the literature and present study measurements. PEC:
274
Predicted Environmental Concentrations in surface water values taken from Peters et al., 2018. *10% most exposed rivers according
275
to Dumont et al., 2015. n.g. not given; n.a. not analyzed.
276 277
278
First of all, Ag-NPs are detected in all waters sampled throughout the year. The
concen-279
trations range, their average and their size and the results of previous studies are
sum-280
marized in Table 1. The presence of Ag-NPs can be directly observed by comparing the
281
signal of raw water and the matrix-blank with all particles removed (i.e., filtrate through
282
1 kDa) (Fig. S1). Ag-NPs number concentrations range from 1.5 x 10⁷ to 2.3 x 10⁹
par-283
ticles L-1, with an average of 9.1 x 10⁸ particles L-1. Their mass concentrations are in the
284
range of 0.4 - 28.3 ng L-1, with an average of 7.9 ng L-1. Compared with the scare
data-285
base of Ag-NPs in surface waters (Table 1), the particle number concentrations found
286
here are in a larger range and the average is 100 times higher than that of Dutch rivers
287
(Peters et al., 2018). It mostly results from the different data processing approach
ap-288
plied. The subtraction method in our study allows to better constrain the false negatives,
289
where the small Ag-NPs are counted as the dissolved background. Regarding the mass
290
concentration, our results cover the concentration range of the recent study in surface
291
waters of Netherland. They are in agreement with previous measurements of colloidal
292
Ag in Texas Rivers. Moreover, from the modeling view, Ag-NPs are expected in
face waters between 0.04 to 619 ng L-1 (Table 1). Our measured concentrations are
294
within this global range, but a bit higher than most estimations for Europe (0.002 to 2.3
295
ng L-1) (Dumont and Williams, 2015). However, the existence of naturally occurring
296
Ag-NPs is not included in the concentration estimation by modeling, resulting in an
297
underestimation in that case. Also, for now, the challenges raised by all modeling
stud-298
ies in natural rivers come from the complex transformations undergone by silver
nano-299
particles on one hand, and their interactions with environmental components on the
oth-300
er hand. Thus, the field data obtained here will constitute a strong constraint to better
301
refine the possible control factors in surface waters.
302
Among the three waters in this study, the largest Ag-NPs amount is found in the urban
303
site, with an average concentration of 1.2 x 10⁹ particle L-1 and of 12.3 ng L-1 (Table 1).
304
Ag-NPs mass concentrations in agricultural and forested waters are very close,
consid-305
ering the significant variations measured over the year. However, the forested water has
306
a higher particle-number concentration than the agricultural water. This is mainly
as-307
cribed to their different size populations of Ag-NPs (Table 1). The size might be related
308
to the water geochemistry affecting processes of Ag-NPs in this environment, which is
309
to be discussed in more details in following sections.
310
Monthly sampling was performed on each catchment to investigate temporal variations
311
of the Ag-NPs concentration over the year. The particle-number concentrations are
pre-312
sented in Fig. 2.
314
Figure 2. Flux of Ag-NPs measured in three waters for one-year sampling (except two contaminated cases). Error barres represent
315
the standard deviation (SD) of three measurements.
316
It shows that the flux in the urban site is quite constant throughout the whole year, but
317
the two other sites have larger temporal variations since average annual water flows are:
318
22 ± 9 L/sec and 51 ± 27 L/sec for the forested and agricultural creeks, respectively.
319
The larger variations in water flow rates reported for the agricultural and the forested
320
sites account therefore for the temporal variability showed in Figure 2. Indeed, forested
321
and agricultural sites, as small watersheds, react very quickly to the climatic and
hydro-322
logical effects, whereas the urban watershed of greater size has diverse contributions
323
(mixture of artificial, agricultural and natural areas) and its concentration variation can
324
thus be slighter over time. Additionally, an increase of Ag-NPs from winter to spring is
325
observed for forested and agricultural waters. The dissolved silver (< 1 kDa) is also
326
quantified by sp-ICPMS in order to investigate the speciation of silver in three natural
327
waters. The signal intensity in counts per second of ultra-filtered samples is converted
328
into ng L-1, using the dissolved Ag sensitivity calibration curve. Fig. 3 shows the
con-329
centrations of dissolved and nano Ag in three waters. It should be noted that values
un-330
der the limit of quantification (2.5 ng L-1) are not discussed here.
331 1 10 100 1000 10000
Ag
N
Ps
(10
6p
art.
/L)
332 2 4 6 8 10 12 14 16 18 20
Ag
con
ten
t
(n
g
/L)
Nano Dissolved333
334
Figure 3. Mass concentration of nano (dark color) and dissolved (light color) silver measured in three waters. Forested, agricultural
335
and urban are respectively represented by green, orange and grey bars.
336 337 2 4 6 8 10 12 14 16 18 20
Ag
con
te
n
t
(n
g
/L
)
Nano Dissolved 2 12 22 32 42 52 62Ag
con
ten
t
(n
g
/L)
Nano DissolvedFor most forested watershed water samples more nano silver is measured than
dis-338
solved, this is in agreement with results of (Delay et al., 2011). showing that NOM
sig-339
nificantly influences the particle size distribution, the stability and the surface properties
340
of Ag-NPs in the aqueous phase preventing it further dissolution, and that in presence
341
NOM, Ag-NPs suspensions are also stable at variable ionic strength, which will
facili-342
tate their transport. In addition it was recently shown that natural organic matter content
343
(i.e. 10 mgL-1 NOM) in lake water encourage the natural silver-based nanoparticle
344
formation (Wimmer et al., 2018).However, in agricultural and urban waters, the
distri-345
bution changes from one sampling period to another. No conclusion has been made for
346
these two sites, in which the transformation of silver is more complex and may be
con-347
trolled by multiple parameters and processes (size and coating of Ag-NPs, pH, DOC, IS,
348
dissolved oxygen, light irradiation, biofilm ) (Desmau et al., 2018; Shevlin et al.,
349
2018).
350
The total silver quantified in 2019 after acid digestion of the 9 remaining samples, from
351
the urban watershed are given in Table S4. The total amount of Ag is higher than the
352
addition of nanosized and dissolved fractions in almost all urban waters, except the
353
sample of 2016-11-30. This is most probably related to the ageing water samples since
354
those samples were stored in the refrigerator with no prior acidification for two or three
355
years, part of the silver may have been lost to the container wall. Besides, when
elimi-356
nating sample of 2016-11-30, the average of percentage of measured Ag (nano +
dis-357
solved) is equal to 70%. It means that a part of Ag is incorporated in larger particles or
358
aggregates not detected by sp-ICPMS.
359
3.2 Field mechanisms and the sources accounting for the variations of measured 360
concentrations 361
Correlation between elements and Ag-NPs concentrations (i.e., number or mass) can be
362
interpreted within a mass balance approach or as the identification of driving parameter
or process for small watersheds (Benedetti et al., 2003a). All related data in the
follow-364
ing discussion (pH, DOC, conductivity, IS and elements concentrations in the dissolved
365
fraction) are detailed in supplementary material (Table S2 and S3). The correlation
be-366
tween two variants is considered statistically significant when R2 0.6 and p-value
367
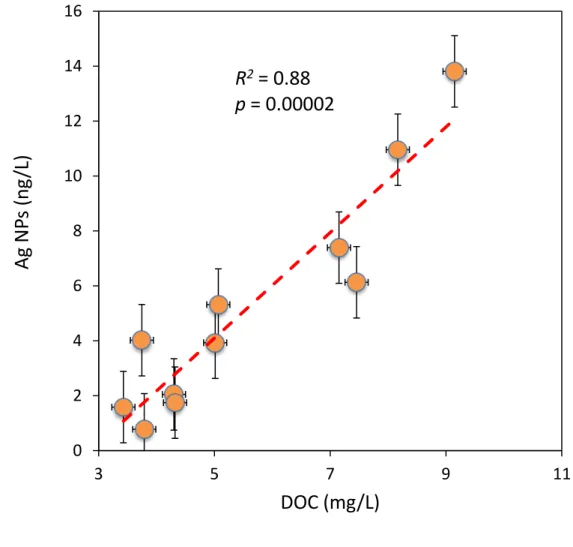
0.01. There is a positive correlation between DOC concentrations and Ag-NPs
concen-368
trations in forested water (Fig. 4 and S2).
369
370
Figure 4. Mass concentration of Ag-NPs as function as DOC concentration in water samples from the forested watershed.
371 372
This strong correlation reflects the control of the natural organic matter (NOM) on the
373
number and the mass of Ag-NPs. The more NOM, the more Ag-NPs are detected in
374
forested water samples. This trend is explained by two combined effects: stabilization
375
and reduction. The stabilization effect of NOM (humic and fulvic acids) on Ag-NPs has
376 0 2 4 6 8 10 12 14 16 3 5 7 9 11
Ag
NP
s
(n
g
/L
)
DOC (mg/L)
R
2= 0.88
p = 0.00002
been described in several studies (Topuz and Talinli, 2015; Yu et al., 2018; Zhang and
377
Jiang, 2017; Wimmer et al., 2018; Huang et al., 2019). High NOM concentration
inhib-378
its the dissolution and aggregations of Ag-NPs when released into surface waters, thus
379
making Ag-NPs more persistent in such natural matrices. The formation of Ag-NPs
380
through reduction of Ag+ by NOM can also lead to the increase of Ag-NPs
concentra-381
tion along with NOM (Akaighe et al., 2011; Sal nikov et al., 2009; Yin et al., 2012a,
382
Wimmer et al., 2018). As reported in Fig. 3 there is a large reservoir of dissolved Ag,
383
either as free Ag+ or Ag bound to NOM to justify the potential increase of Ag-NPs by
384
this process. For the agricultural and urban watersheds, no significant trends between
385
DOC and Ag-NPs number or mass concentrations were found. This lack of trend does
386
not mean that similar processes are not at work, but that the smaller range of NOM
con-387
centrations variations NOM = 2.2 mg L-1 and 1.7 mg L-1 versus 5.7 mg L-1 for
agricul-388
tural and urban versus forested watersheds, respectively, prevented the building of a
389
reliable correlation. Moreover, other potential processes which work more efficiently
390
might be operating in those two watersheds.
392
Figure 5. Number concentration of Ag-NPs as function as conductivity in water samples from the agricultural watershed.
393 394
Indeed, we found that the particle-number concentration and the equivalent size for
395
sphere of Ag-NPs correlate negatively with conductivity, and positively with Ca
con-396
centration, in agricultural and urban water samples, respectively (Fig. 5 and 6). This
397
means that Ag-NPs number concentration decreases with increasing charged ions
con-398
centration in the aquatic media. The agricultural and urban waters have higher
concen-399
trations of charged ions, while their average particle size is significantly higher than
Ag-400
NPs from the forested waters (Table 1). The charge-induced aggregation, and even
sed-401
imentation, of silver nanoparticles has been reported in simplified natural systems with
402
the presence of calcium ions (Topuz et al., 2014). These aggregates will interact with
403
colloids or induce further sedimentation (Labille et al., 2015), thus escape from the
top-404
layer sampling since the sampling river surfaces are quite small and water column is
405
shallow (< 0.3 m). In the case of the agricultural water samples the lack of increase in
406 0.00 0.20 0.40 0.60 0.80 1.00 1.20 1.40 1.60 500 550 600 650 700 750 800
Ag NP
s (
10
6p
art.
/m
L)
Conductivity (µS/cm)
R
2= 0.84
p = 0.0002
size with Ca2+ could be due to fast sedimentation or formation of nanoparticles outside
407
the range of our analytical detection window.
408
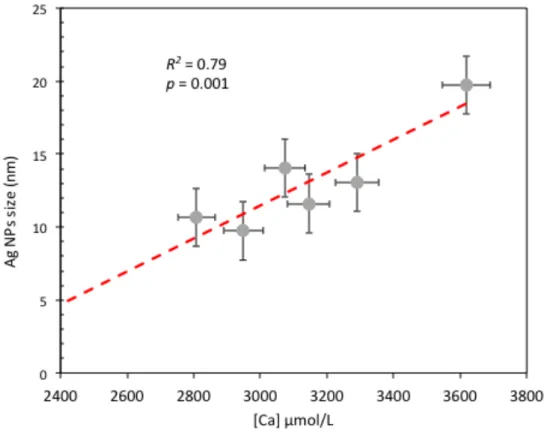
409
Figure 6. Size of Ag-NPs as function as the concentration of dissolved Ca2+ (< 0.22 µm) in water samples from the urban
water-410
shed.
411
Considering negative correlation between Ag-NPs concentration and conductivity,
to-412
gether with size growing with Ca2+ content, we can conclude that in the
charge-413
abundant river, the aggregation or even sedimentation is favorable and the fate is more
414
controlled by charge determining ions such as divalent cations (i.e., Ca2+ and Mg2+) or
415
Al3+ in extreme conditions with very low pH.
416
Another explanation for this correlation is that the observed changes are related to
vari-417
able inputs of different sources with time for instance the urban watershed is partly
cov-418
ered by agricultural land. But the differences in bulk geochemistry, especially for major
419
ions, are not that large for a single river (Table S3) and cannot totally explain the
ob-420
served trend.
422
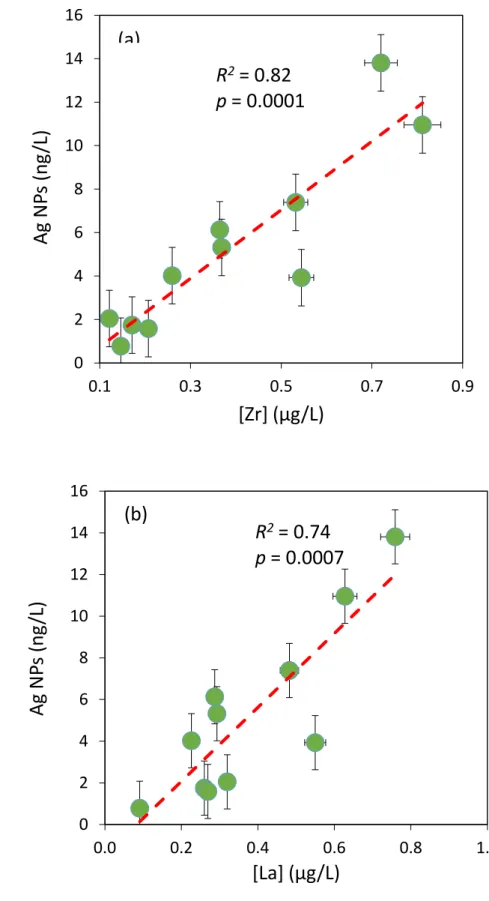
423
Figure 7. Mass concentration of Ag-NPs as function as the concentration of total Zr and La in water samples from the forested
424
watershed.
425
However, correlations can also help to identify sources of elements and colloids
426
(Benedetti et al., 2003a). For instance, for the forested site water samples, there is a
427 0 2 4 6 8 10 12 14 16 0.1 0.3 0.5 0.7 0.9
Ag
N
Ps
(n
g
/L)
[Zr] (µg/L)
R
2= 0.82
p = 0.0001
(a)
0 2 4 6 8 10 12 14 16 0.0 0.2 0.4 0.6 0.8 1.0Ag
N
Ps
(n
g
/L)
[La] (µg/L)
R
2= 0.74
p = 0.0007
(b)
strong correlation between the Ag-NPs mass concentration and trace elements (Zr, Y,
428
La and Ce) in the fraction < 0.22 µm (two examples are given in Fig. 7 and S3). Zr, is
429
often considered as a geological background indicator because of its limited
mobiliza-430
tion under most environmental conditions (Aja et al., 1995; Hodson, 2002). As for La
431
and Ce, their speciation is generally controlled by natural organic matter (Sonke, 2006),
432
which explains their good correlation with Ag-NPs number and mass concentrations.
433
Moreover, the Ce/La ratio is equal to 1.9 ± 0.1 for all water samples in the forested
wa-434
tershed, this value is equal to the geochemical background value of 1.9 given for French
435
soils and suspended matter sediments (Reimann et al., 2018). Thus, silver nanoparticles
436
in forest water are very likely to be of natural origin. In addition to the natural leaching
437
from bedrock (Qi et al., 2007), other potential pathways of naturally occurring
Ag-438
containing NPs include the reduction of dissolved Ag+ by natural organic matter
439
(Akaighe et al., 2011; Sal nikov et al., 2009; Yin et al., 2012a; Wimmer et al., 2018),
440
the oxidation and reduction of macroscale Ag objects (Qi et al., 2007), and biological
441
processes (Klaus et al., 1999; Kroll et al., 2014). Moreover, the stability of Ag-NPs in
442
the environment could be enhanced by surface sulfidation (Levard et al., 2011), via
in-443
teractions with extracellular polymeric substances (EPS) (Kroll et al., 2014; Li et al.,
444
2016) and with NOMs (Topuz and Talinli, 2015; Yu et al., 2018; Zhang and Jiang,
445
2017) present in the natural matrix.
446
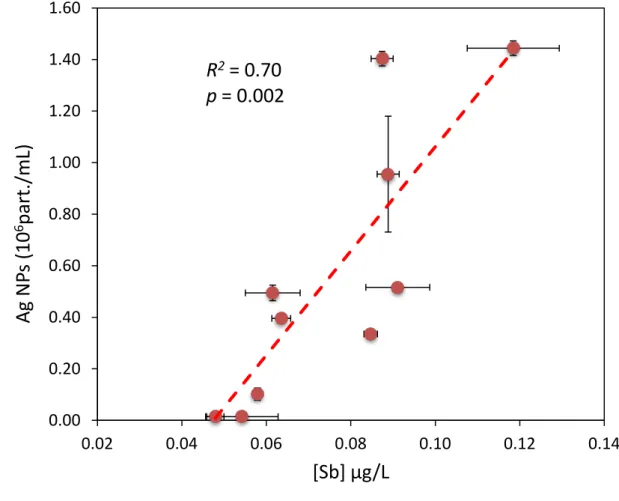
Le Pape et al. (2012) identified Antimony (Sb) as a typical anthropogenic element in the
447
Orge river catchment, very close to our sampled watersheds. They concluded that Sb
448
was of anthropogenic origin and carried by organic matter or sulfur containing species.
449
In the agricultural watershed we have a good correlation between Sb and Ag-NPs
num-450
ber concentration (Fig. 8). This could mean that both elements were trapped in or
car-451
ried by the same species. Organic matter or sulfur containing species could originate
from biosolids recycled from wastewater treatment plants (WWTPs) and used as
ferti-453
lizers and soil amendments (Healy et al., 2016; Le Pape et al., 2012).
454
455
Figure 8. Number concentration of Ag-NPs as function as the concentration of total Sb in water samples from the agricultural
water-456
shed.
457
Several studies have confirmed the release of Ag-NPs in the effluent of WWTPs, at the
458
level from < 12 ng L-1 up to 100 ng L-1 (Li et al., 2013; Mitrano et al., 2012). . An
his-459
torical pollution for Sb and As as well as Ag is reported and well known in the Seine
460
river watershed (Ayrault et al., 2010; Le Cloarec et al., 2011). We cannot exclude this
461
old source that because of its dispersion via the atmosphere all over the catchment has
462
probably reached the agricultural watershed under investigation. Therefore, it suggests
463
that silver nanoparticles in agricultural water would be of anthropogenic origin.
464 465
In the case of urban river water samples, no clear correlations with the previously
men-466
tioned drivers such as organic matter or trace elements issued from anthropogenic
activ-467 0.00 0.20 0.40 0.60 0.80 1.00 1.20 1.40 1.60 0.02 0.04 0.06 0.08 0.10 0.12 0.14
Ag NP
s (
10
6p
art.
/m
L)
[Sb] µg/L
R
2= 0.70
p = 0.002
ities are reported. A recent evaluation on historical trace pollutants load (Sb, Ag, Ni, Cu,
468
Zn, As, Pb) in the Seine River watershed reports lower values in sediments reflecting
469
the progressive decontamination of the catchment (Le Gall et al., 2018). Thus new
470
source of silver such as biocidal plastics and textiles (Vance, 2015) are uncorrelated to
471
those historical trace pollutant elements as seen in this study. In addition, the mixed
472
contribution of three type of waters (forested 19%, agricultural 44% and artificial 37%)
473
makes complex the interpretation of the source identification especially in the case of
474
small watersheds that promptly react to hydrological and environmental changes. A
475
weak trend is observed between Ag-NPs number concentration and the temperature of
476
the sampling river (r2 = 0.48, p = 0.0377). The higher the temperature the higher the
477
number of NPs. Temperature and sunlight, affects the reductive formation of
Ag-478
NPs (Yin et al., 2014, 2012b). In summer, warmer water temperature months, increased
479
exposition to UV-light would promote the reduction of Ag+ by organic compounds
lead-480
ing to higher Ag-NPs concentrations (Badireddy et al., 2014; Odzak et al., 2017; Yin et
481
al., 2015). Similar enhanced process by sunlight takes place for the reduction-formation
482
Ag-NPs by natural EPS components (Kroll et al., 2014). They thus result in the
persis-483
tence of Ag-NPs in sunlight waters.
484
The issue of the land-use effect is still standing even after identifying potential sources
485
for the forested watershed samples (natural) and the agricultural watershed
(contamina-486
tion). Calculation of normalized fluxes of Ag-NPs that can be obtained by the
combina-487
tion of the monthly water discharge data and the respective area of the three watersheds
488
may help to evidence clear differences between each of the studied sites.
489 490 491
3.3 Effect of Land-use on exportation fluxes 492
493
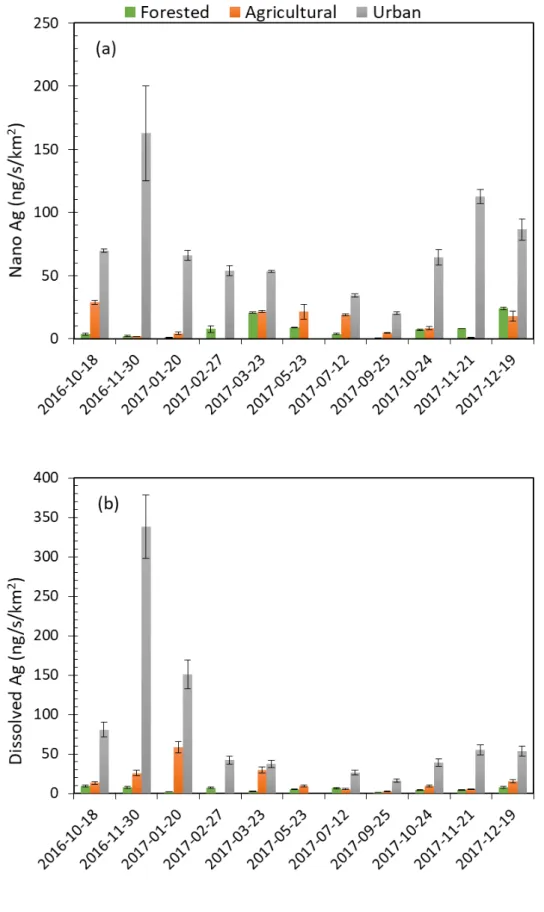
Figure 9. Export rate of nano (a) and dissolved (< 1 kDa) (b) Ag in three catchments throughout the sampling year. Error bars
494
represent the standard deviation of three measurements.
495 496 497
The measured normalized (in km-2 y-1) export rate for Ag-NPs and dissolved silver are
498
given in Fig. 9. It is clear in this figure that the flux from the urban site is the highest for
499
nano and dissolved silver. If the monthly export rates of Ag-NPs are averaged, an
annu-500
al export rate of 2.3 ± 1.3 g km-2 y-1 is obtained. This value is ten times higher than the
501
export rate calculated for the agricultural and forested watersheds whose respective
val-502
ues are 0.4 ± 0.3 and 0.2 ± 0.2 g km-2 y-1. The difference between the urban site and the
503
two others is also seen for dissolved Ag export rates that are respectively equal to 2.6 ±
504
3.1, 0.6 ± 0.5 and 0.2 ± 0.1 g km-2 y-1 for urban, agricultural and forested sites. These
505
large difference cannot be due to due to the constant release of Ag-NPs from consumer
506
products into freshwaters as reported in several studies, (Benn and Westerhoff, 2008;
507
Mitrano et al., 2014); (Farkas and Thomas, 2011); Aznar et al., 2017; Kaegi and
508
Burkhardt, 2010). The amount of nanosized silver registered in the R-nano French
de-509
claration of use or production site (https://www.r-nano.fr/) is equal to 10kg in 2017 and
510
was equal to 1 kg in 2013. In addition for France, in the
511
https://www.nanotechproject.org/cpi/ data base of products with nano-sized silver, only
512
33 products are listed. Another approach is to use the data of Wang et al. (2018) for
513
Europe and downscale it to France, using Europe and France population as the scaling
514
factor, we can estimate that 27 kg Ag-Nano y-1 (i.e., 0.042 g km-2 y-1) and 425 kg
Ag-515
Nano y-1 (i.e. 0.66 g km-2 y-1) could be delivered to soils and waters, respectively. These
516
are very small numbers for the French territory. Other sources of Ag-NPs must be found
517
to account for the fluxes in all three watersheds. In table S4 we have compiled the
518
known input data of bulk Ag and Nano Ag to soils for the world, Europe, France and
519
Switzerland with available data from (Johnson et al., 2005; Muller and Novack, 2008
520
and Wang et al., 2018). We can clearly see that bulk Ag, issued mostly from WWTPs,
521
represents a much bigger source of Ag to soils and consequently to rivers or aquatic
522
ecosystems than the input of nano-Ag (Wang et al., 2018).
Material flow analysis, expressed in mass per capita per year or in mass per km2 per
524
year, relies on land-use or product use to simulate concentrations of Ag-NPs in aquatic
525
systems. As two of the three watersheds are experiencing different land-uses (i.e.,
for-526
estry, agricultural practices and artificial areas), we can recalculate the actual specific
527
export rate of Ag-NPs for agricultural practices and artificial areas. The forested
water-528
shed (0.2 ± 0.2 g km-2 y-1 or 80 mg.capita-1.y-1) is one end-member that will allow the
529
calculation of the agricultural end-member since the agricultural basin is only covered
530
by those two types of activities (i.e., 72% agriculture and 22% forestry). The calculated
531
rate of export of Ag-NPs is therefore equal to 0.5 ± 0.3 g km-2 y-1 or 5mg.capita-1.y-1 for
532
land only used for agricultural purposes. Now the same calculation can be done for the
533
artificial areas using the urban watershed data (i.e., 37% artificial areas, 44% agriculture
534
19% forestry). The calculated rate of export of Ag-NPs is therefore equal to 5.5 ± 3.0 g
535
km-2 y-1 or 3mg.capita-1.y-1 for artificial areas.
536
Considering the large uncertainties due to the high variability of Ag-NPs concentrations
537
along the year for artificial land and agricultural practices we can conclude that both
538
activities generate the same amounts of Ag-NPs expressed in mg.capita-1.y-1, the highest
539
of all being the forested watershed (i.e. 80 mg.capita-1.y-1vs 5 mg.capita-1.y-1). The
ma-540
jor characteristic of forested watershed is that its lithology corresponds to a sandy soil
541
vs. carbonated soils for the other watersheds and that it is richer in carbon in the top-soil
542
(Bonnot, 2015). Recent studies have shown that soils organic matter could significantly
543
contribute to the formation of silver nanoparticles in soils (Huang et al., 2019) . The low
544
number of inhabitants and the favored production of Ag-NPs by soils organic matter
545
would account for this higher number.
546
The origin of the Ag-NPs for the agricultural and urban watersheds is probably different
547
from the geochemical background and is from anthropogenic origin since in the Seine
548
river watershed, biosolids were and are used on agricultural land (Buzier et al., 2011;
Thévenot et al., 2007). Artificial areas will generate the highest flux of Ag-NPs by more
550
than one order of magnitude compared to the two other land uses when expressed in g
551
km-2 y-1. The CORINE Land Cover Map (updated in 2006) can be used to calculate the
552
total Ag-NPs annual export for the entire catchment of the Seine River (i.e., 78650 km2)
553
using two end-members. An urban one corresponding to 13% of the total catchment
554
(Ag-NPs = 5.5 ± 3.0 g km-2 y-1) and an average value corresponding to the agricultural
555
and forested end-members, which represents the rest of the land use in the catchment
556
(Ag-NPs = 0.4 ± 0.3 g km-2 y-1). The calculated flux is equal to 80 ± 51 kg y-1
corre-557
sponding to a release per capita of 4 mg.capita-1.y-1. The urban source representing 56 ±
558
30 kgy-1. The same calculation can be done for the dissolved fraction of Ag with the
559
same hypothesis. The dissolved flux of Ag is 94 ± 50 kg y-1 with the urban source
repre-560
senting 64 ± 30 kg y-1. In total a flux of 174 kg y-1 of silver would be exported from the
561
catchment dissolved and nano. This flux is much smaller than the particulate flux
calcu-562
lated by Ayrault equal to 1700 kgy-1 in 2003 (Ayrault et al., 2010) corresponding to a
563
flux of 85 mg.capita-1.y-1. Table S4 data show a huge input to soils of bulk silver in
564
France compared to the nano Silver (whatever the units used) and suggest that the
dif-565
ference between our seine river flux and the one from Ayrault et al., (2010) could be
566
due to a missing source input not captured by our 3 watersheds but existing at the scale
567
of the larger seine river watershed. For instance the cause could be higher inputs of
568
biosolids from WWTPs on agricultural land (Thevenot et al., 2007; Buzier et al., 2011)
569
since we do not have the mass of biosolids that are actually spread over the lands in our
570
three sites. In addition the data from Ayrault et al. (2010) was calculated with data from
571
sediments of two cores about 100 km downstream of Paris draining 96% of the Seine
572
River basin and are located within the last major meander of the Seine River before it
573
reaches its estuary. This location has been flooded at least once each year until 2004
574
(Ayrault et al., 2010). Flood events were never recorded in our small watersheds during
our year of survey and could explain part of the discrepancy as we are missing in our
576
calculations all the material arriving during the flood events. Thus despite the increased
577
use of Ag-NPs consumer products (Benn and Westerhoff, 2008; Farkas and Thomas,
578
2011; Kaegi and Burkhardt, 2010) their contribution to the general flow is still limited
579
(i.e., 7% Table XX), more long term surveys are needed to confirm this result.”
580 581
4. Conclusion 582
Our results clearly demonstrate that material flow analysis models should generate
ex-583
port rates that are land-use dependent in order to have improved predicting capabilities.
584
Ag-NPs in three surface waters were found in the range of 1.5 x10⁷ to 2.3 x 10⁹ particles
585
L-1 at number concentration and 0.4 to 28.3 ng L-1 at mass concentration. In addition,
586
some driving process factors and potential sources were identified by using correlations
587
between Ag-NPs concentrations and other parameters, like the control of natural organic
588
matters of Ag-NPs in the forested water. Whereas, various contributions and more
com-589
plex process were found in agricultural and urban waters. Besides, the export rate of
590
Ag-NPs from artificial, agricultural and forested areas were respectively, 5.5 ± 3.0, 0.5
591
± 0.3 and 0.2 ± 0.2 g km-2 y-1.
592
In addition, our study also demonstrates that the dissolved compartment should be taken
593
into account in material flow analysis and toxicity models since it is the most reactive as
594
well as the most toxic. Future studies should be focused on high resolution samplings
595
during a given specific month when climatic factor varies a lot and when farming and/or
596
hunting activities are active to better constrain the sources of the Ag-NPs as well as
597 their fluxes. 598 599 Acknowledgment 600
This project has been supported by Ile de France Region through the DIM Analytics
601
program (Convention ESPCI-RVT-IPGP-N°2015-3).
602
Part of this work was supported by grants from Région Ile-de-France R2DS and PIREN
603
Seine programs.
604
Parts of this work were supported by IPGP multidisciplinary program PARI, and by
605
Paris IdF region SESAME Grant no. 12015908.
References 607
Aja, S.U., Wood, S.A., Williams-Jones, A.E., 1995. The aqueous geochemistry of Zr
608
and the solubility of some Zr-bearing minerals. Appl. Geochemistry 10, 603 620.
609
https://doi.org/10.1016/0883-2927(95)00026-7
610
Akaighe, N., MacCuspie, R.I., Navarro, D.A., Aga, D.S., Banerjee, S., Sohn, M.,
611
Sharma, V.K., 2011. Humic Acid-Induced Silver Nanoparticle Formation Under
612
Environmentally Relevant Conditions. Environ. Sci. Technol. 45, 3895 3901.
613
https://doi.org/10.1021/es103946g
614
Ayrault, S., Priadi, C.R., Evrard, O., Lefèvre, I., Bonté, P., 2010. Silver and thallium
615
historical trends in the Seine River basin. J. Environ. Monit. 12, 2177 2185.
616
https://doi.org/10.1039/c0em00153h
617
Aznar, R., Barahona, F., Geiss, O., Ponti, J., José Luis, T., Barrero-Moreno, J., 2017.
618
Quantification and size characterisation of silver nanoparticles in environmental
619
aqueous samples and consumer products by single particle-ICPMS. Talanta 175,
620
200 208. https://doi.org/10.1016/j.talanta.2017.07.048
621
Badireddy, A.R., Farner Budarz, J., Marinakos, S.M., Chellam, S., Wiesner, M.R.,
622
2014. Formation of Silver Nanoparticles in Visible Light-Illuminated Waters:
623
Mechanism and Possible Impacts on the Persistence of AgNPs and Bacterial Lysis.
624
Environ. Eng. Sci. 31, 338 349. https://doi.org/10.1089/ees.2013.0366
625
Benedetti, M.F., Dia, A., Riotte, J., Chabaux, F., Gérard, M., Boulègue, J., Fritz, B.,
626
Chauvel, C., Bulourde, M., Déruelle, B., Ildefonse, P., 2003a. Chemical
627
weathering of basaltic lava flows undergoing extreme climatic conditions: The
628
water geochemistry record. Chem. Geol. 201, 1 17.
https://doi.org/10.1016/S0009-629
2541(03)00231-6
630
Benedetti, M.F., Mounier, S., Filizola, N., Benaim, J., Seyler, P., 2003b. Carbon and
631
metal concentrations, size distributions and fluxes in major rivers of the Amazon
basin. Hydrol. Process. 17, 1363 1377. https://doi.org/10.1002/hyp.1289
633
Benn, T.M., Westerhoff, P., 2008. Nanoparticle silver released into water from
634
commercially available sock fabrics. Environ. Sci. Technol. 42, 4133 4139.
635
https://doi.org/10.1021/es7032718
636
Bian, Y., Kim, K., Ngo, T., Kim, I., Bae, O.N., Lim, K.M., Chung, J.H., 2019. Silver
637
nanoparticles promote procoagulant activity of red blood cells: A potential risk of
638
thrombosis in susceptible population. Part. Fibre Toxicol. 16.
639
https://doi.org/10.1186/s12989-019-0292-6
640
Bonnot, C., 2015. L origine des m taux et la d namique du inc dans le bassin de la
641
Seine.
642
Bonnot, C.A., Gélabert, A., Louvat, P., Morin, G., Proux, O., Benedetti, M.F., 2016.
643
Trace metals dynamics under contrasted land uses: contribution of statistical,
644
isotopic, and EXAFS approaches. Environ. Sci. Pollut. Res. 1 21.
645
https://doi.org/10.1007/s11356-016-6901-0
646
Boxall, A., Chaudhry, Q., Sinclair, C., Jones, A., Aitken, R., Jefferson, B., Watts, C.,
647
2007. Current and future predicted environmental exposure to engineered
648
nanoparticles, Environment. Central Science Laboratory, York, UK.
649
https://doi.org/196111
650
Buzier, R., Tusseau-Vuillemin, M.H., Keirsbulck, M., Mouchel, J.M., 2011. Inputs of
651
total and labile trace metals from wastewater treatment plants effluents to the Seine
652
River. Phys. Chem. Earth 36, 500 505. https://doi.org/10.1016/j.pce.2008.09.003
653
Chen, J. Bin, Gaillardet, J., Bouchez, J., Louvat, P., Wang, Y.N., 2014. Anthropophile
654
elements in river sediments: Overview from the Seine River, France.
655
Geochemistry, Geophys. Geosystems 15, 4526 4546.
656
https://doi.org/10.1002/2014GC005516
657
Cornelis, G., Hassellöv, M., 2014. A signal deconvolution method to discriminate
smaller nanoparticles in single particle ICP-MS. J. Anal. At. Spectrom. 29, 134
659
144. https://doi.org/10.1039/c3ja50160d
660
Del Real, A.E.P., Castillo-Michel, H., Kaegi, R., Sinnet, B., Magnin, V., Findling, N.,
661
Villanova, J., Carriére, M., Santaella, C., Fernández-Martínez, A., Levard, C.,
662
Sarret, G., 2016. Fate of Ag-NPs in Sewage Sludge after Application on
663
Agricultural Soils. Environ. Sci. Technol. 50, 1759 1768.
664
https://doi.org/10.1021/acs.est.5b04550
665
Delay, M., Dolt, T., Woellhaf, A., Sembritzki, R., Frimmel, F.H., 2011. Interactions and
666
stability of silver nanoparticles in the aqueous phase: Influence of natural organic
667
matter (NOM) and ionic strength. J. Chromatogr. A 1218, 4206 4212.
668
https://doi.org/10.1016/j.chroma.2011.02.074
669
Desmau, M., Gélabert, A., Levard, C., Ona-Nguema, G., Vidal, V., Stubbs, J.E., Eng,
670
P.J., Benedetti, M.F., 2018. Dynamics of silver nanoparticles at the
671
solution/biofilm/mineral interface. Environ. Sci. Nano.
672
https://doi.org/10.1039/C8EN00331A
673
Dobr ska, M.M., Krus ewski, M., 2014. Genotoxicity of silver and titanium dioxide
674
nanoparticles in bone marrow cells of rats in vivo. Toxicology 315, 86 91.
675
https://doi.org/10.1016/j.tox.2013.11.012
676
Dumont, E., Johnson, A.C., Keller, V.D.J., Williams, R.J., 2015. Nano silver and nano
677
zinc-oxide in surface waters Exposure estimation for Europe at high spatial and
678
temporal resolution. Environ. Pollut. 196, 341 349.
679
https://doi.org/10.1016/j.envpol.2014.10.022
680
Dumont, E., Williams, R.J., 2015. Nano silver and nano zinc-oxide in surface waters
681
Exposure estimation for Europe at high spatial and temporal resolution. Environ.
682
Pollut. 196, 341 349. https://doi.org/10.1016/j.envpol.2014.10.022
683
Estebe, A., Mouchel, J.M. Thevenot, D.R., 1998. Urban Runoff impacts on Particulate
Metal Concentrations. Water. Air. Soil Pollut. 108, 83 50.
685
https://doi.org/10.1023/A:1005064307862
686
Estèbe, A., Boudries, H., Mouchel, J.M., Thévenot, D.R., 1997. Urban runoff impacts
687
on particulate metal and hydrocarbon concentrations in river Seine: Suspended
688
solid and sediment transport. Water Sci. Technol. 36, 185 193.
689
https://doi.org/10.1016/S0273-1223(97)00600-8
690
Farkas, J., Thomas, K.V., 2011. Characterization of the effluent from a nanosilver
691
producing washing machine. Environ. Int. 37, 1057 1062.
692
https://doi.org/10.1016/j.envint.2011.03.006
693
Gaillet, S., Rouanet, J.M., 2015. Silver nanoparticles: Their potential toxic effects after
694
oral exposure and underlying mechanisms - A review. Food Chem. Toxicol.
695
https://doi.org/10.1016/j.fct.2014.12.019
696
Garban B, Ollivon D, Carru AM, C.A., 1996. Origin, retention and release of trace
697
metals from sediments of the river seine 87, 363 381.
698
Good, K.D., Bergman, L.E., Klara, S.S., Leitch, M.E., VanBriesen, J.M., 2016.
699
Implications of engineered nanomaterials in drinking water sources. J. Am. Water
700
Works Assoc. 108, E1 E17. https://doi.org/10.5942/jawwa.2016.108.0013
701
Gottschalk, F., Lassen, C., Nowack, B., 2015. Modeling flows and concentrations of
702
nine engineered nanomaterials in the Danish environment. Int. J. Environ. Res.
703
Public Health 12, 5581 5602. https://doi.org/10.3390/ijerph120505581
704
Grosbois, C., Meybeck, M., Horowitz, A., Ficht, A., 2006. The spatial and temporal
705
trends of Cd, Cu, Hg, Pb and Zn in Seine River floodplain deposits (1994-2000).
706
Sci. Total Environ. 356, 22 37. https://doi.org/10.1016/j.scitotenv.2005.01.049
707
Guo, L., Santschi, P.H., 2007. Ultrafiltration and its Applications to Sampling and
708
Characterisation of Aquatic Colloids. Environ. Colloids Part., Wiley Online Books.
709
https://doi.org/doi:10.1002/9780470024539.ch4
Healy, M.G., Fenton, O., Forrestal, P.J., Danaher, M., Brennan, R.B., Morrison, L.,
711
2016. Metal concentrations in lime stabilised, thermally dried and anaerobically
712
digested sewage sludges. Waste Manag. 48, 404 408.
713
https://doi.org/10.1016/j.wasman.2015.11.028
714
Hodson, M.E., 2002. Experimental evidence for mobility of Zr and other trace elements
715
in soils. Geochim. Cosmochim. Acta 66, 819 828.
https://doi.org/10.1016/S0016-716
7037(01)00803-1
717
Horowitz, A.J., Meybeck, M., Idlafkih, Z., Biger, E., 1999. Variations in trace element
718
geochemistry in the Seine River Basin based on floodplain deposits and bed
719
sediments. Hydrol. Process. 13, 1329 1340.
https://doi.org/10.1002/(SICI)1099-720
1085(19990630)13:9<1329::AID-HYP811>3.0.CO;2-H
721
Huang, Y.-N., Qian, T.-T., Dang, F., Yin, Y.-G., Li, M., Zhou, D.-M., 2019. Significant
722
contribution of metastable particulate organic matter to natural formation of silver
723
nanoparticles in soils. Nat. Commun. 10, 4 11.
https://doi.org/10.1038/s41467-724
019-11643-6
725
Ilina, S.M., Lapitskiy, S.A., Alekhin, Y. V., Viers, J., Benedetti, M., Pokrovsky, O.S.,
726
2016. Speciation, Size Fractionation and Transport of Trace Elements in the
727
Continuum Soil Water Mire Humic Lake River Large Oligotrophic Lake of a
728
Subarctic Watershed. Aquat. Geochemistry 22, 65 95.
729
https://doi.org/10.1007/s10498-015-9277-8
730
Johnston, H.J., Hutchison, G., Christensen, F.M., Peters, S., Hankin, S., Stone, V., 2010.
731
A review of the in vivo and in vitro toxicity of silver and gold particulates: Particle
732
attributes and biological mechanisms responsible for the observed toxicity. Crit.
733
Rev. Toxicol. 40, 328 346. https://doi.org/10.3109/10408440903453074
734
Kaegi, R., Burkhardt, M., 2010. Release of silver nanoparticles from outdoor facades.
735
Environ. Pollut. 158, 2900 2905. https://doi.org/10.1016/j.envpol.2010.06.009