ELECTRONIC SUPPORTING INFORMATION
Alpha-helical folding of SilE models upon Ag(His)(Met) motif formation
Valentin Chabert,
aMaggy Hologne,
bOlivier Sénèque,
cOlivier Walker
band Katharina M. Fromm*
aaUniversity of Fribourg, Department of Chemistry, Chemin du Musée 9, 1700 Fribourg, Switzerland
bUniversité de Lyon, CNRS, UCB Lyon 1, ENS-Lyon, Institut des Sciences Analytiques, UMR 5280, 5 rue de la Doua, 69100 Villeurbanne, France.
cUniversité Grenoble Alpes, CNRS, CEA, BIG/LCBM (UMR 5249), 38000 Grenoble, France.
Electronic Supplementary Material (ESI) for Chemical Communications.
This journal is © The Royal Society of Chemistry 2018
Table of contents
Experimental methods ...3
Solid-Phase Peptide Synthesis ...3
Determination of peptide concentrations...3
NMR spectroscopy...3
Structure calculations...4
Spectrofluorimetry and CD spectroscopy...4
1
H NMR titrations ...5
DOSY experiments...8
CD titrations...14
Structure refinement...16
Characterization of AgHEWM...21
Determination of Ag
+/peptides binding constants...24
Experimental methods
Solid-Phase Peptide Synthesis
Peptides were synthesized by SPPS (Solid-Phase Peptide Synthesis) on a Rink-Amide resin (Novabiochem) on a 108 μmol scale with a Biotage Initiator+ Alstra automated peptide synthesizer. The resin has been swelled in DCM (dichloromethane) during 60 min. 9-fluoromethoxy-carbonyl (Fmoc)-protected amino acids (Bachem) were coupled by using HCTU (O-(1H-6-Chlorobenzotriazole-1-yl)-1,1,3,3-tetramethyluronium hexafluorophosphate, Novabiochem) and HObt (Hydroxybenzotriazole, Sigma-Aldrich) as coupling agents, DIPEA (N,N-diisopropylethylamine, Sigma-Aldrich) as organic base, and DMF (N,N′-dimethylformamide) and NMP (N-Methyl-2-Pyrrolidone) as solvents, during 60 min. After each coupling, a mixture of acetic anhydride (Acros Organics)/pyridine (Acros Organics)/DMF (1:2:7) has been added to the resin during 10 min in order to protect the unreacted functional groups. Fmoc deprotection steps were carried out twice (3 min and 10 min) by using 20% piperidine (Sigma-Aldrich) in DMF. The N-terminus was acetylated by using a mixture of acetic anhydride/pyridine/DMF (1:2:7) during 10 min. After each step, the solvent has been removed by filtration and the resin has been washed four times with DMF. Six washes with DCM have been performed after the final capping step. Side chain deprotection and peptide cleavage from the resin were carried out by adding 8 mL of a cocktail of 95.5 vol% TFA (trifluoroacetic acid, Sigma-Aldrich), 1.5 vol% EDT (ethane dithiol, Sigma-Aldrich), 1.5 vol% TIS (triisopropylsilane, Sigma-Aldrich) and 1.5 vol% water during 2h. The TFA has been evaporated under vacuum and the peptides were precipitated and washed 3 times with cold diethyl ether. Peptides were dried and purified by semi-preparative reverse-phase HPLC (Waters 600) on a NUCLEODUR C18 HTec Column (Macherey-Nagel) with a linear gradient from 20% to 50% (10% to 30% in the case of HEWM) acetonitrile in water with 0.1% TFA, and then lyophilized. Characterization of the peptides was performed by ESI-MS (Bruker Esquire HCT) and the purity (> 95%) was controlled by analytical HPLC (Waters alliance).
Determination of peptide concentrations
Lyophilized peptides (1-2 mg) were dissolved in 300 μL of D2O (Cambridge Isotope Laboratories) and the concentrations have been determined by UV-Vis spectroscopy. The molar absorptivity at 205 nm (ε205) of each peptide is given by the modified formula (from Anthis et al.1):
∑
(
𝜀𝑖𝑛𝑖)
+ 𝜀𝑏𝑏× 𝑟where for each amino acid i, εi is the molar absorptivity of the amino acid side chain (from Goldfarb et al.2 for all values, except for glutamine and asparagine values, which come from Saidel et al.3) and ni is the number of times that this amino acid appears in the peptide sequence. εbb is the molar absorptivity of a backbone peptide bond, and r is the number of residues in the peptide sequence. In the case of HEWM, the concentration determination has been performed from the molar absorptivity of the tryptophan residue at 280 nm (ε280 = 5540 M-1.cm-1).4
determined by ICP analysis (48.0 mM). For the structure resolution, peptide solutions (1 mM) were prepared in HEPES buffer (20 mM, pH = 7.2) and transferred to a 5 mm NMR tube containing a D2O capillary for NMR locking purpose and avoid contamination. NMR experiments were carried out on Bruker Avance II 600 MHz and 700 MHz spectrometers equipped with a triple resonance probe at 273 K. Due to strong signal overlap, only a few resonances of the SilE-derived peptides in the free state could be assigned. To ensure Ag+ saturating conditions, a solution of AgClO4 was added to all the samples until no chemical shift perturbation was observed. 1D 1H, 2D 1H-1H TOCSY (mixing time 80 ms) and 2D 1H-1H NOESY (mixing time 500 ms) experiments were recorded to assign peptides chemical shifts and extract NOE constraints.
Structure calculations
The ensemble of unambiguously assigned NOEs collected for the different peptides was incorporated in the modeling of the Ag+/SilE-derived peptide complexes as distance constraints (Table S1). Additional restraints were included with the use of dihedral angles derived from 3JHNH
α couplings measured on 1D 1H spectra. Structure refinement was performed by using the Xplor-NIH package where the structure search started with a 3D elongated structure that stretches along the SilE-derived peptides sequences.5 The N- and C-termini of the peptide sequences were modified as N-acetylated and C-amidated to reflect the experimental conditions. For the simulated annealing, 350 structure candidates were initially sampled starting with a temperature of 5000 K and progressively cooling down to 25 K with a step of 12.5 K. The force constants were ramped up multiplicatively. Finally, the structures were minimized using a conjugate gradient energy minimization for 4000 iterations. The calculated structures were ranked according to their potential energy and the ten lowest energy structures were retained for further analysis. The quality of the structures was assessed using the Procheck software (Table S2).6 Structure calculations with imposed linear His·N-Ag-S·Met geometry were calculated using XPLOR 3.851 including a home-made topology and parameter patch to account for the geometry around the silver ions.
Spectrofluorimetry and CD spectroscopy
Peptide concentrations have been determined as described above. Spectrofluorimetric measurements have been performed on a Varian Cary Eclipse at 298 K. Titration experiments of HEWM (10-50 µM) using MDQH, MNEH, HEFM and HQAM as competitors (10-20 µM), and titration experiments of B1, B2, A1 and A2 (10-50 µM) using HEWM (10-50 µM) as a competitor have been performed using HEPES (4 mM, pH 7.4) as a buffer. The titration curves were fitted using the DynaFit software7, with the previously determined binding constants of AgMDQH, AgMNEH, AgHEFM and AgHQAM complexes (LogKass = 5.8, 5.4, 6.6 and 5.9 respectively) and the herein determined binding constant of AgHEWM (LogKass = 6.4).8 CD measurements have been performed on a Jasco J-715 spectropolarimeter. CD spectra of the peptides (10 µM) have been measured in presence of increasing amounts of AgClO4 (0 to 48 µM for A1, A2, B1 and B1b, and 0 to 80 µM for B2b) in NH4Ac (1 mM, pH 7.4).
1
H NMR titrations
Figure S1. 1H NMR spectra of the SilE-derived peptides (500 µM for A1, A2, B2 and B1b, and 3 mM for B2b, in HEPES 20 mM, pD 7.8) in presence of increasing amounts of AgClO4 (additions of 0.4 eq. of AgClO4 for A1, A2 and B2 and additions of 0.5 eq. of AgClO4 for B2b). B1b: Adapted from Ref8 with permission from The Royal Society of Chemistry.
Figure S1 (follow up). 1H NMR spectra of the SilE-derived peptides (500 µM for A1, A2, B2 and B1b, and 3 mM for
B2b, in HEPES 20 mM, pD 7.8) in presence of increasing amounts of AgClO4 (additions of 0.4 eq. of AgClO4 for A1,
A2 and B2 and additions of 0.5 eq. of AgClO4 for B2b). B1b: Adapted from Ref8 with permission from The Royal Society of Chemistry.
In the case of B1b, the chemical shifts of His-Hδ2 and His-Hε1 of both histidine residues are shifted up to 2 eq. Ag+ and remain constant above. Regarding methionine residues, a large shift (Δδ = 0.4 ppm) is observed for Hε of Met83 and Met90 up to 2 eq. but not for Met91 (Δδ = 0.1 ppm). The latter goes on shifting after 2 eq. of Ag+, suggesting the binding of Met91 to a third Ag+ ion but with a weaker affinity in the mM range. As for His80-Hδ2/ε1, the Met83-Hε resonance remains constant above 2 eq. Ag+, indicating that the HQKM motif is not affected by the binding of the third Ag+ ion. On the contrary, a small but constant shift of Met90-Hε is observed after 2 eq., which parallels that of Met91-Hε. Moreover, the 1H,13C HSQC spectra of B1b in presence of increasing amounts of Ag+ shown in Figure S2 indicate a similar shift of the carbon resonance of Met-Cδ (Δδ 13C = 3.6 ppm)9 for the three methionine residues, although the maximal shift of 3.6 ppm is not obtained at the same Ag+ concentration for the three methionine residues (2 eq., 4 eq, and 8 eq. of AgClO4 are needed for Met83, Met90 and Met91 respectively). Together with the DOSY experiments that are in favor of the formation of species containing a single peptide upon Ag+ binding, this could be rationalized by the binding of the first two Ag+ ions by His80/Met83 and His87/Met90 (His-Ag-Met coordination) followed by the binding of the third loosely bound Ag+ to both Met90 and Met91 to give a His87-Ag-Met90-Ag-Met91 complex with bridging Met90 within the HQRMM motif.
Figure S2. 1H, 13C HSQC NMR spectra of B1b (4 mM B1b in HEPES 20 mM, pD 7.8) in presence of increasing amounts of AgClO4 (additions of 2 eq. of AgClO4).
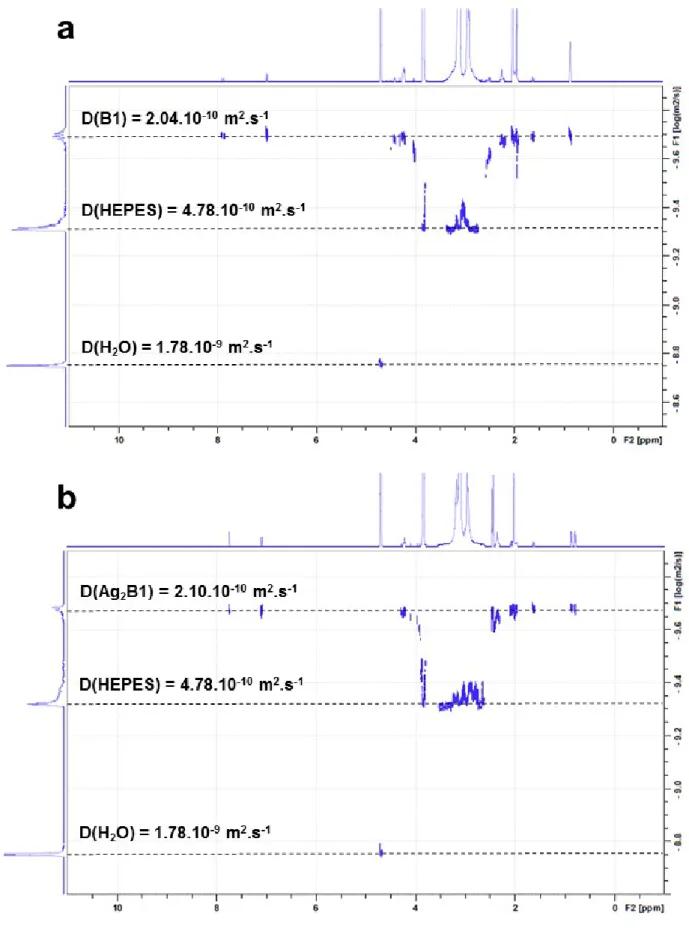
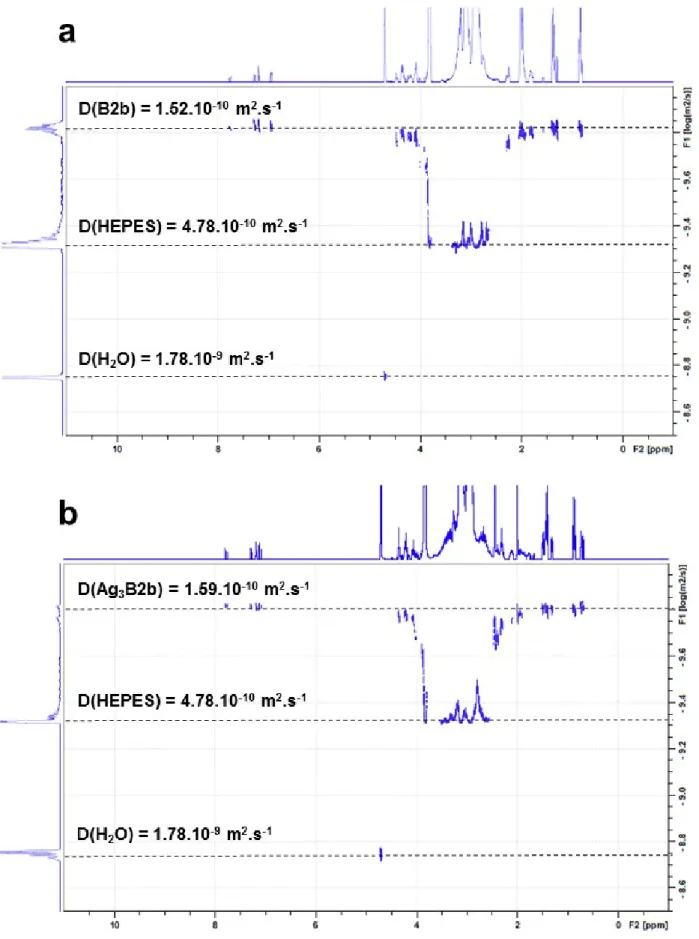
DOSY experiments
Figure S3. DOSY spectra of A1 (a) and Ag2A1 (b) (1 mM A1, HEPES 20 mM in D2O, pD 7.8, addition of 4 eq. of AgClO4).
Figure S5. DOSY spectra of B1 (a) and Ag2B1 (b) (1 mM B1, HEPES 20 mM in D2O, pD 7.8, addition of 4 eq. of AgClO4).
Figure S6. DOSY spectra of B2 (a) and Ag2B2 (b) (1 mM B2, HEPES 20 mM in D2O, pD 7.8, addition of 4 eq. of AgClO4).
Figure S7. DOSY spectra of B2b (a) and Ag3B2b (b) (200 µM B2b, HEPES 20 mM in D2O, pD 7.8, addition of 10 eq. of AgClO4).
CD titrations
Figure S9. CD spectra of the SilE-derived peptides (10 µM, in NH4Ac 1mM, pH 7.4) in presence of increasing amounts of AgClO4 (0 to 48 µM for A1, A2, B2 and B1b, and 0 to 80 µM for B2b).
Figure S9 (follow up). CD spectra of the SilE-derived peptides (10 µM, in NH4Ac 1mM, pH 7.4) in presence of increasing amounts of AgClO4 (0 to 48 µM for A1, A2, B2 and B1b, and 0 to 80 µM for B2b).
Structure refinement
The 1H NMR spectra of all apo-peptides exhibit a poor dispersion of their respective chemical shifts, which is a hallmark of disordered ensembles (Fig. S10).10 However, substantial changes are observed when Ag+ is added, and a larger spread of the chemical shifts is observed. In order to account for any structural changes, NOESY spectra were recorded in the free and Ag+-bound states. In the unbound state, only intra-residue and i,i+1 NOEs could be detected (Fig. S11). In the bound state, the NOE pattern associated with the different spectra of the type B peptides present a drastic change and several i,i+3 NOEs are present, bringing further evidence of an α-helical folding. Despite a larger spread of their chemical shifts, type A holopeptide spectra do not show any i,i+3 NOE signals (Fig. S11 and Table S1). Therefore, based on inter-residue NOEs, we can anticipate a less folded structure of the MX2HX6HX2M sequences of SilE.
Table S1. Summary of the number of NOEs used for structure refinement for the different SilE-derived peptides.
Model[a] Strong Medium Weak Total
A1 (14) 25 20 8 53 A2 (14) 22 26 20 68 B1 (11) 29 22 21 72 B2 (11) 28 28 18 74 B1b (14) 45 21 32 98 B2b (28) 98 47 55 200
Figure S11. NOESY spectra of the SilE-derived peptides in the free (blue) and Ag+-bound (red) states. The spectra were recorded by using a mixing time of 500ms. For the sake of clarity, the spectra are magnified around the amide NH region.
Figure S11 (follow up). NOESY spectra of the SilE-derived peptides in the free (blue) and Ag+-bound (red) states. The spectra were recorded by using a mixing time of 500ms. For the sake of clarity, the spectra are magnified around the amide NH region.
Table S2. Summary of the Procheck structure validation analysis.
Name RMFR (%)[a] RAAR (%)[a] RGAR (%)[a] RDR (%)[a]
A1 99.3 0.7 0 0 A2 96.7 3.3 0 0 B1 100 0 0 0 B2 100 0 0 0 B1b 100 0 0 0 B2b 98 1.6 0 0.4
[a] The 10 best structures were analyzed according to the percentage of residues in most favored regions (RMFR), Residues in additional allowed regions (RAAR), Residues in generously allowed regions (RDAR) and Residues in disallowed regions (RDR).
Figure S12. (a) Alignment of B2 and B2b NMR solution structures. (b) Alignment of B1 and B1b NMR solution
structures. For a sake of comparison, structures have been aligned with respect to their respective backbone. The backbone RMSD is equal to 0.15 Å for B1 and B1b while it is equal to 0.11 Å for B2 and B2b.
Characterization of AgHEWM
The differences between the molar concentration of the peptides used in NMR (mM range) and the estimated Kd of the complexes (µM range) make impossible an accurate measurement of the binding constant by direct NMR titration. On the other hand, despite the low concentrations needed for the CD titrations of the peptides by Ag+, the use of buffers turned out to be incompatible with the determination of the binding constants by CD, either because of their intrinsic optic properties (e.g. HEPES buffer absorbs in the 190-230 nm window), or because they interfered with the silver complexation (e.g. phosphate buffer). Therefore, a fluorescent probe (HEWM) has been designed to determine the binding constants of the complexes. The complexation of Ag+ by HEWM has been investigated by NMR and spectrofluorimetric studies. Both technics led to the conclusion that HEWM binds Ag+ and forms a complex with a 1:1 stoichiometry. Indeed, histidine, methionine and tryptophan (in a less dramatic fashion) 1H NMR resonances are shifted when Ag+ is added to the solution, reaching a plateau at 1 eq. of Ag+ (Fig. S13). The binding constant (LogKass) of AgHEWM has been determined by a series of competition experiments using four tetrapeptides as competitors (MDQH, MNEH, HEFM and HQAM)8 at different concentrations (10-20 µM). An example is given for each competitor in Figures 4, S14, S15 and S16.
Figure S13. HEWM/Ag+ NMR titration. Histidine imidazole (His-Hε1 and His-Hδ2), methionine methyl (Met-Hε) and tryptophan indole (Trp-H2,4,5,6,7) 1H resonances shift by addition of AgClO4 (0 to 2 mM) to a solution of HEWM (1 mM) in HEPES buffer (20 mM, pD 7.8).
The binding constant (LogKass) of AgHEWM has been determined by a series of competition experiments using four tetrapeptides as competitors (MDQH, MNEH, HEFM and HQAM)8 at different concentrations (10-20 µM). An example is given for each competitor in Figures 5, S14, S15 and S16.
Figure S14. HEWM/HEFM competition. (a) Tryptophan fluorescence
(λ
ex:280 nm)
quench by addition of AgClO4 (0 to 40 μM) to a solution of HEWM (10 μM) in competition with HEFM (10 μM), in a HEPES buffer (4 mM, pH 7.4). (b) Plot of the variation of fluorescence integrated intensities. The solid line corresponds to the fit obtained with Dynafit.7Figure S15. HEWM/HQAM competition. (a) Tryptophan fluorescence
(λ
ex:280 nm)
quench by addition of AgClO4 (0 to 80 μM) to a solution of HEWM (20 μM) in competition with HQAM (20 μM), in a HEPES buffer (4 mM, pH 7.4). (b) Plot of the variation of fluorescence integrated intensities. The solid line corresponds to the fit obtained with Dynafit.7Figure S16. HEWM/MNEH competition. (a) Tryptophan fluorescence
(λ
ex:280 nm)
quench by addition of AgClO4 (0 to 80 μM) to a solution of HEWM (20 μM) in competition with MNEH (20 μM), in a HEPES buffer (4 mM, pH 7.4). (b) Plot of the variation of fluorescence integrated intensities. The solid line corresponds to the fit obtained with Dynafit.7Table S3. Determination of the binding constant (LogKass) of AgHEWM
Competitor 10 µM[a] 20 µM[a]
MDQH LogKass = 6.5
-MNEH LogKass = 6.2 Log Kass = 6.3
HEFM LogKass = 6.6
-HQAM Log Kass = 6.4 Log Kass = 6.4
Determination of Ag
+/peptides binding constants
Silver binding constants (LogK1 and LogK2) of each complex have been determined from spectrofluorimetric Ag+ titrations of the peptides in competition with HEWM. Figures S17-S20 give an example of competition experiments for each of the four models, at different concentrations, and the fits obtained using Dynafit7.
Figure S17. B1/HEWM competition. (a) Tryptophan fluorescence
(λ
ex:280 nm)
quench by addition of AgClO4 (0 to 56 μM) to a solution of B1 (10 μM) in competition with HEWM (10 μM), in a HEPES buffer (4 mM, pH 7.4). (b) Plot of the variation of fluorescence integrated intensities. The solid line corresponds to the fit obtained with Dynafit.7Figure S18. B2/HEWM competition. (a) Tryptophan fluorescence
(λ
ex:280 nm)
quench by addition of AgClO4 (0 to 220 μM) to a solution of B2 (50 μM) in competition with HEWM (50 μM), in a HEPES buffer (4 mM, pH 7.4). (b) Plot of the variation of fluorescence integrated intensities. The solid line corresponds to the fit obtained with Dynafit.7Figure S19. A1/HEWM competition. (a) Tryptophan fluorescence
(λ
ex:280 nm)
quench by addition of AgClO4 (0 to 22μM) to a solution of A1 (5 μM) in competition with HEWM (5 μM), in a HEPES buffer (4 mM, pH 7.4). (b) Plot of the variation of fluorescence integrated intensities. The solid line corresponds to the fit obtained with Dynafit.7
Figure S20. A2/HEWM competition. (a) Tryptophan fluorescence
(λ
ex:280 nm)
quench by addition of AgClO4 (0 to220 μM) to a solution of A2 (50 μM) in competition with HEWM (50 μM), in a HEPES buffer (4 mM, pH 7.4). (b) Plot of the variation of fluorescence integrated intensities. The solid line corresponds to the fit obtained with Dynafit.7
Table S4. Determination of the binding constants (LogKass) of the different models
Model 5 µM[a] 10 µM[a] 50 µM[a] Average
B1 Log K1 = 6.2 Log K2 = 5.0 Log K1 = 6.2 Log K2 = 5.1 Log K1 = 6.2 Log K2 = 5.3 Log K1 = 6.2 ± 0.3 Log K2 = 5.1 ± 0.5 B1b Log K1 = 6.4 Log K2 = 5.0 Log K1 = 6.4 Log K2 = 4.9 Log K1 = 6.4 Log K2 = 5.0 Log K1 = 6.4 ± 0.3 Log K2 = 5.0 ± 0.4 B2 Log K1 = 6.5 Log K2 = 5.3 Log K1 = 6.5 Log K2 = 5.4 Log K1 = 6.5 Log K2 = 5.3 Log K1 = 6.5 ± 0.3 Log K2 = 5.3 ± 0.4 A1 Log K1 = 6.6 Log K2 = 5.6 Log K1 = 6.6 Log K2 = 5.7 Log K1 = 6.6 Log K2 = 5.6 Log K1 = 6.6 ± 0.3 Log K2 = 5.6 ± 0.4 A2 Log K1 = 6.7 Log K2 = 5.5 Log K1 = 6.8 Log K2 = 5.5 Log K1 = 6.7 Log K2 = 5.5 Log K1 = 6.7 ± 0.4 Log K2 = 5.5 ± 0.3
[a] The value corresponds to the concentration of the peptide and to the concentration of the probe.
References
1 N. J. Anthis and G. M. Clore, Protein Sci., 2013, 22, 851. 2 A. R. Goldfarb, J. Biol. Chem., 1951, 193, 397.
3 L. J. Saidel, J. Biol. Chem., 1952, 197, 285.
4 H. Mach, C. R. Middaugh and R. V Lewis, Anal. Biochem., 1992, 200, 74.
5 C. D. Schwieters, J. J. Kuszewski, N. Tjandra and G. M. Clore, J. Magn. Reson., 2003, 160, 65. 6 R. Laskowski, J. A. Rullmann, M. MacArthur, R. Kaptein and J. Thornton, J. Biomol. NMR, 1996, 8, 477. 7 P. Kuzmič, Anal. Biochem., 1996, 237, 260.
8 V. Chabert, M. Hologne, O. Sénèque, A. Crochet, O. Walker and K. M. Fromm, Chem. Commun., 2017, 53, 6105.
9 B. Bersch, K.-M. Derfoufi, F. De Angelis, V. Auquier, E. N. Ekendé, M. Mergeay, J.-M. Ruysschaert and G. Vandenbussche, Biochemistry, 2011, 50, 2194.
10 B. Brutscher, I. C. Felli, S. Gil-Caballero, T. Hošek, R. Kümmerle, A. Piai, R. Pierattelli and Z. Sólyom, Adv. Exp. Med. Biol., 2015, 870, 49.