HAL Id: hal-02447120
https://hal-univ-paris.archives-ouvertes.fr/hal-02447120
Submitted on 21 Jan 2020
HAL is a multi-disciplinary open access
archive for the deposit and dissemination of
sci-entific research documents, whether they are
pub-lished or not. The documents may come from
teaching and research institutions in France or
abroad, or from public or private research centers.
L’archive ouverte pluridisciplinaire HAL, est
destinée au dépôt et à la diffusion de documents
scientifiques de niveau recherche, publiés ou non,
émanant des établissements d’enseignement et de
recherche français ou étrangers, des laboratoires
publics ou privés.
Jean-Marc Noël, Mathias Vieira, Vitor Brasiliense, Jean-François Lemineur,
Catherine Combellas, Frédéric Kanoufi
To cite this version:
Jean-Marc Noël, Mathias Vieira, Vitor Brasiliense, Jean-François Lemineur, Catherine Combellas, et
al.. Effect of the driving force on nanoparticles growth and shape: an opto-electrochemical study.
Nanoscale, Royal Society of Chemistry, 2020, �10.1039/C9NR09419A�. �hal-02447120�
ARTICLE
Université de Paris, ITODYS, CNRS UMR 7086, 15 rue J.A. de Baïf, F-75013 Paris, France.
E-mail: [email protected], [email protected].
Electronic Supplementary Information (ESI) available: Videos SV1-3; Description of the videos; Au and Ag NPs SEM images with chronoamperometric curves; Voltammetry of Au UME in Fe2+ or Fe(bpy)
32+ solutions; MSD analysis of AgNF and
AgNCs electrogeneration; Optical vs MSD particle sizing; Ag NPs growth rate distributions; Cumulative frequency growth rates; Evidencing the dissolution of AuNC from growth rates distributions; Principle of growth rate estimate from MSD analysis. See DOI: 10.1039/x0xx00000x
Received 00th January 20xx, Accepted 00th January 20xx DOI: 10.1039/x0xx00000x
Effect of the driving force on nanoparticles growth and shape: an
opto-electrochemical study
Jean-Marc Noël,* Mathias Miranda Vieira, Vitor Brasiliense, Jean-Francois Lemineur, Catherine Combellas and Frédéric Kanoufi*
Most protocols developed to synthesize nanoparticles (NPs) and to control their shape are inspired from nucleation and growth theories. However, to rationalize the mechanisms of the shape-selective synthesis of NPs, experimental strategies allowing to probe in situ the growth of NPs are meant. Herein, metal Au or Ag nanoparticles (NPs) are produced by reaction of a metallic ion precursor with a reversible redox reducer. The process is explored by an oxidative electrosynthesis strategy using a sacrificial Au or Ag ultramicroelectrode to both trigger the metallic ion generation and control the local concentrations of the different reactants. The effect of the driving force for the metallic ions reduction over metal NP growth dynamics is inspected in situ and in real time at the single NP level by high-resolution optical microscopy from the tracking of the Brownian trajectories of the growing NPs in solution. The NPs reductive growth/oxidative etching thermodynamics, and consequently the NPs shape, are shown to be controlled electrochemically by the reversible redox couple, while the intervention of an Au(I) intermediate ion is suggested to account for the formation of gold nanocubes.
1. Introduction
Noble-metal nanoparticles (NPs) are of great interest because of their distinct physicochemical properties compared to bulk materials, such as their size or shape that have a significant influence on their chemical reactivity, catalysis or for the design of plasmonic materials.1 In order to tailor the final structure of NPs it is then crucial to identify and control the parameters influencing their growth mechanism. If the synthetic control over NP size is supported by mechanistic and modelling considerations, apprehending their nucleation and growth2-4 to explain the morphology of NPs during their synthesis is still challenging. It has been shown that the shape of NPs is set up during the growth phase,5 however the selection of shape is not only related to the transport of the different building blocks involved (metallic ions, metal nuclei, reducers,…) but also to the intricate thermodynamics and kinetics of metal growth, restructuring and redissolution. It makes shape selective NP growth a nonequilibrium process for which either computer-aided simulations6 or experimental
strategies probing in situ the time-resolved growth of NPs3-9 are meant to rationalize their formation mechanism. In this context, strategies relying on single NP inspection using high resolution microscopic observation are currently pursued. Whereas Transmission Electron Microscopy (TEM) enables high -in situ or ex situ- spatial and temporal resolution observations of various dynamic phenomena at the single NP level, including nucleation,10 growth,9,11 etching,12,13 or transformation,14-16 it is an expensive setup and the invasive electron beam strongly interferes with the chemical reduction of metal salts,17 making the study of the effect of different synthesis parameters on the final NP structure difficult. Moreover, since it is limited to a low depth of field, it provides images of samples in confined spaces, which may exalt surface compared to volume phenomena, and limit the amount of NPs studied in a single experiment. Alternatively, optical microscopies have the advantages of high throughput, high sensitivity, with high lateral and temporal resolution operando imaging of NPs dynamic processes.18 Such strategies have been coupled to electrochemistry to reveal, in 2D or 3D, insights into in situ bulk processes, such as NPs sizing and transport19-21 as well as surface and (electro)chemical transformations.22-24 This work aims at investigating, in situ and at the single entity level, structure-activity relationships dictating the dynamics of the growth of metallic, herein Au and Ag, NPs. Systematic mechanistic investigations in this area require high throughput and temporal resolution in situ monitoring of the reaction, together with a fine control over the experimental synthetic conditions such as the metal precursor to reducer concentration ratio, the reducer strength, temperature, etc…
The in situ and real time monitoring is provided here through a dark field optical microscopy, while the control of the experimental synthetic conditions is afforded by a multi-facet electrochemical strategy. On one hand, if most NP synthetic routes employ irreversible reducers, this work focuses on the use of reversible redox couples, which offer several advantages. Firstly, the reducing strength, measured through its standard redox potential, E°, and in turn the driving force of the reduction of a metallic salt, is easily modulated through its chemical structure. Here, Fe(II) organometallic complexes are used, the E° of which is modulated by an appropriate choice of ligands, as recently mentioned.25 It is also a simple way to investigate the role of the driving force of the reduction of the metal precursor ions on the synthesis of Ag or Au metal NPs. Secondly, the NP formation will produce an, also reversible, oxidant (Fe(III)), which may also participate in the etching of the NP surface. Oxidative etching strategies are pertinent in the preferential synthesis of single-crystal particles. The presence of both the reducer and the oxidant of the Fe(II)/Fe(III) redox couple may then bring some control over the shape and growth dynamics of the NPs.26,27 Solutions containing both components of a redox couple can be easily electrogenerated by a polarized electrode. It actually affords a spatial control within the diffusion layer of the electrode of the Fe(II)/Fe(III) ratio, and therefore over their chemical activity. Such strategy has been recently highlighted for in situ electrochemical generation of both the activating and deactivating components for the controlled living growth of polymers, by electrochemical mediated atom transfer radical polymerization (ATRP).28
On the other hand, the ratio of Fe(II)/Fe(III) NP-tailoring components is triggered electrochemically by the control of the polarization sequence of the electrode. It is a means to address fast growth processes with high temporal resolution, which are difficult to analyze kinetically under usual synthetic conditions where the growth mechanism is coupled to the reactants mixing step.
Finally, electrochemistry can also be used to generate the NP metal precursor. By appropriate anodic polarization, a sacrificial metal electrode, here Au or Ag, is electro-dissolved, generating metallic ions serving as the NP material precursor. Such strategy has already been used to synthesize colloidal metallic or metal oxides NPs,29,30 metallic31 or bimetallic32 nanoclusters at large scale.
These three facets are combined here to electrogenerate, as illustrated in Scheme 1A, reactive solutions containing metal, here Au or Ag, NP precursors and Fe(II)/Fe(III) reducer/oxidant. Particularly, we investigate the role of the driving force of the metal ion reduction by the reducing agent on the NP shape and growth rate. The growth of individual NPs within the electrogenerated reactant concentration gradients is monitored in situ by dark field optical microscopy, as shown in Scheme 1B. Such in situ dynamic NP sizing20,33 is used to correlate individual NP growth rates to the metal salt reduction driving force, providing mechanistic insight at the single NP level.
Scheme 1. Principle of NPs electrosynthesis by electrodissolution of a sacrificial
ultramicroelectrode (UME) of metal M, in the presence of a reversible electron donor, Red, in solution: the anodic polarization of the UME (EUME) generates in its vicinity
concentration gradients of Mn+ by dissolution of M, Red and Ox. The presence of all three components at controlled concentrations, from a control of the current (iUME),
allows the production in the diffusion layer of the UME of NPs of M whose presence (bright features in image) and growth dynamics is probed in situ by dark field optical microscopy (B).
2. Materials and methods
2.1. Materials
Iron(II) sulphate heptahydrate 99+% (FeIISO4·7H2O) and KCl
99.5% were purchased from Acros Organics, KPF6 98% and
FcMeOH from Sigma-Aldrich and tris(dipyridyl)Iron(II) (Fe(bpy)32+) was homemade.
Homemade ultramicroelectrodes, UMEs, were fabricated using 1.0mm/0.5mm (outer diameter/inner diameter) borosilicate glass capillaries (Sutter Instruments, Novato, California), 25µm diameter Au or Ag wires (99.99%, Goodfellow Cambridge Ltd., Huntingdon, England), and a laser pipette puller (P2000, Sutter Instruments). The obtained 25μm diameter disc UMEs were carefully polished on polishing aluminum oxide tape (3µm) from Precision Surfaces International (Houston, Texas).
2.2. Electrochemical measurements
They were performed using a CHI660A or 760E instrument (CH-Instruments). A 2-electrode setup was used with Ag/AgCl wire as the reference.
2.3. Optical monitoring.
The UME was positioned in a drop cell mounted on a thin glass slide (1mm thickness) on top of an inverted microscope (Olympus IX71) equipped with a long working distance objective (x60, NA = 0.7). This assembly allows focusing on the apex of a working UME positioned far (> 0.5mm) from the glass slide. The apex of the UME was then observed under dark field illumination through a dark field condenser using a 100W halogen lamp (ULH100L-3 from Olympus). Images were acquired with a CCD Camera AndorIxon 897 at rate up to 30 frames per second.
2.4. SEM
The images were recorded using a SEM-FEG from Zeiss (Zeiss SUPRA 40).
A
B
Objective x60 N.A. 0.7 Dark field condenserJournal Name ARTICLE
This journal is © The Royal Society of Chemistry 20xx J. Name., 2013, 00, 1-3 | 3
3. Results and discussion
3.1. Principle of the NPs electrosynthesis
The local synthesis of NPs uses a sacrificial disk, Au or Ag, ultramicroelectrode (UME) in an electrolytic solution containing 1mM of a reversible electron donor Fe(II) (see Fig. 1), which is, in order of decreasing reducing strength or of increasing E° values, either, ferrocenemethanol (FcMeOH), Fe2+, or iron tris-dipyridyl (Fe(bpy)32+). At t=0, the UME is
polarized at a sufficiently positive potential, EUME, relative to all
components (with EUME>E°M and E°Fe(II), which are respectively
the standard redox potential of the Mn+/M and Fe(III)/Fe(II) couples (see Scheme 1), such as both the electron donor and the UME material are oxidized. Typically, EUME = 1.2V vs
Ag/AgCl for the Au UME or 0.7V vs Ag/AgCl for the Ag UME. On one hand, the electron donor is oxidized into its Fe(III) counterpart at the UME surface. Owing to its micrometric dimension, a steady-state mass transfer by diffusion of Fe(II) from the bulk solution to the UME is established in a relatively short time (of the order of a2/D, with a the UME radius and D the Fe(II) diffusion coefficient). Typically for the 25µm diameter UME and for t>5-10s, the UME is producing a steady state hemispherical concentration gradient of Fe(III) and Fe(II) within its diffusion layer, expanding approximately over a distance of 10a.
On the other hand, by the oxidation of the sacrificial UME (dissolution),34 a concentration gradient of Mn+ ions (AuCl4- or
Ag+) is generated in its diffusion layer, as for the Fe(II)/Fe(III) counterparts. This reaction serves to produce in large excess, compared to the Fe(II) species, the Mn+ precursors of the metallic NPs that are intended to be formed in solution in the diffusion layer of the UME. The flux of Mn+ produced is controlled by the UME current, iUME, while the time evolution
of iUME is recorded (chronoamperometry). Examples of such
chronoamperograms, CAs, are presented in ESI (Figs. S1 and S2) for the different electron donors and UME couples investigated. The UME current reaches rapidly, within <2-3s, a state value ensuring the UME is producing a steady-state concentration profile of the Mn+ ions. As will be detailed later, the synthetic procedure for both UME materials is set to a same flux f of metallic precursors estimated from the UME steady-state current, iUME, through:
f = iUME/nFa2 (1)
with F the Faraday constant, n=3 for the production of AuCl4-,
n=1 for Ag+, and typically f 5µmol.cm-2.s-1. Similarly to the Fe(II) and Fe(III) species, under these conditions the UME dissolution generates at its surface 60mM of Mn+ which, by diffusion towards the bulk, yield local [Mn+] between 26 and 3mM from 12 to 100µm from the UME surface.
The condition of the UME polarization then imposes a quasi steady-state control of the spatial concentration of all reactants, Fe(II), Fe(III) and Mn+ within the ca. 100µm of the UME diffusion layer and conditions of NPs synthesis under excess of Mn+ compared to the reducer/oxidant.
3.2. Reversible redox mediation of NPs growth.
The electron donors chosen to mediate the production of M NPs are reducers from reversible redox couples, here Fe(II)/Fe(III) whose E° values, modulated by ligands, were chosen to engage the reduction of the corresponding electrogenerated Mn+ ions, to yield either Au (2,3) or Ag (4,5): 𝐴𝑢𝐶𝑙4−+ 3𝐹𝑒2+ → 𝐴𝑢0+ 3𝐹𝑒3++ 4𝐶𝑙− (2)
𝐴𝑢𝐶𝑙4−+ 3 𝐹𝑒(𝑏𝑝𝑦)32+⥂ 𝐴𝑢0+ 3 𝐹𝑒(𝑏𝑝𝑦)33++ 4𝐶𝑙− (3)
𝐴𝑔++ 𝐹𝑐𝑀𝑒𝑂𝐻 → 𝐴𝑔0+ 𝐹𝑐𝑀𝑒𝑂𝐻+ (4)
𝐴𝑔++ 𝐹𝑒2+ ⥂ 𝐴𝑔0+ 𝐹𝑒3+ (5)
The reversibility of the redox transformation of the Fe(II)/Fe(III) couple is intended to induce physical or chemical control over the NP synthesis: spatial confinement, chemical control of the redissolution process and of the growth kinetics. The latter two chemical controls result particularly from the driving force of the Mn+ reduction, ΔG0 = –nFΔE°, with ΔE°=E°M
– E°Fe(II).
Fig. 1 SEM images of electrogenerated (A) Au and (B) Ag nanoflowers or nanocubes in
(A) a 0.1M KCl aqueous solution containing 1mM Fe2+ or Fe(bpy)
32+ by applying EUME =
1.2V vs Ag/AgCl or (B) a 0.05M KPF6 aqueous solution containing 1mM Fe2+ or FcMeOH
by applying EUME = 0.7V vs Ag/AgCl. Reducers and their redox potentials compared to
those of Ag and Au species35 are also given.
3.2.1. Spatial confinement of the NP formation
First, the mass transfer to and from the UME provides a spatial confinement over the synthesis. As the Fe(II) oxidation at the UME is mass-transfer limited, the UME surface is devoid of Fe(II), pushing the Mn+ reduction and therefore the metal formation toward the solution: it prevents the immediate re-deposition of the metal on the UME and ensures the production of metallic NPs in a range of 10 to 100µm from the UME surface. This range is compatible with the resolution of the dark field optical microscopy used to monitor, in situ, the electrosynthetic process in neighboring regions of the UME. Examples of videos showing the change in optical densities in these regions under different electrosynthesis conditions are provided in videos (videos SV1 and SV2 for Au UMEs with Fe2+ or Fe(bpy)32+ as reducer, respectively, EUME= 1.2V vs Ag/AgCl;
video SV3 for Ag UME, EUME= 0.7V vs Ag/AgCl, in a FcMeOH
solution; the video for the Ag UME in the presence of Fe2+ is available elsewhere33).
Immediately after the onset of the UME anodic polarization, at the beginning of all the videos, light-scattering features,
A
animated by Brownian motion, appear in solution. As shown in Figs. 2A and B extracted from the videos taken during the Au UME oxidation, these bright features are distributed around the UME within a hemispherical reaction layer of 80±20µm in the presence of Fe2+ or 40±15µm for Fe(bpy)32+. It suggests
that these bright features are Au NPs, generated in solution from the electrochemically driven mass transfer of the metal precursor and of the reversible reducer. Similar behaviors are observed during the anodic dissolution of Ag UME in the presence of either Fe2+ or FcMeOH: Brownian bright features attributed to Ag NPs appear within a reaction layer of 80-100µm.
The presence of metallic NPs in the solution is also confirmed
in situ from the UME current, iUME. Indeed, if metal NPs are
formed in solution, on their diffusive travel back to the UME surface, they will also be dissolved by oxidation upon collision with the anodically polarized UME. Such reactive NP-UME collisions, known as destructive electrochemical nanoimpacts,36,37 are indeed detected in the UME current response as stochastic oxidative short current spikes (see Figs. S2C and S3 -red curve- in ESI), complementing the light scattering observation.20
3.2.2. Shaping the NP through the reduction driving force.
The presence of the oxidizing Fe(III) counterpart in the UME diffusion layer provides a further chemical feedback over the NPs synthesis from their possible redissolution depending on the occurrence of the backward oxidation (see backward reactions 3 and 5). It is an interesting feature for shape-controlled NPs synthesis.
As NPs are detected over 100µm from the UME metallic disk,
ex situ SEM images of the body of the UME, and particularly of
the insulating glass surrounding the UME disk, have been recorded at the end of each electrosynthetic procedure. In all cases NPs were detected confirming the in situ detection of light-scatterers. The ex situ images particularly exemplify the role of the driving force of the Mn+ reduction on the final NP shape and size.
For the Au UME, using the stronger reducer, Fe2+, gold fractal nanoflowers with an apparent mean size of 680nm were obtained (AuNFs; Figs. 1A left and S1A in ESI), in agreement with what was found recently in classical colloidal syntheses from AuCl4- and Fe2+.25 If Fe2+ is replaced by the less reducing
Fe(bpy)32+, cubic NPs are obtained with an average edge length
of 250nm (AuNCs; Figs. 1A right and S1B in ESI). The shape preference of this new synthetic route of nanocubes, associated with a smaller NP size evidences the control of the NPs growth from the driving force of the metallic salt reduction: compare ΔE°AuNF=E°Au – E°Fe2+= 0.23V vs ΔE°AuNC=
E°Au – E°Febpy2+=-0.03V or equivalently ΔG0AuNF= –nFΔE°AuNF
=-0.69eV vs ΔG0AuNC=0.09eV.
A similar trend is confirmed for Ag NPs produced during the electrodissolution of the Ag UME in an aqueous solution containing either FcMeOH or Fe2+ reducing agents. Using FcMeOH (high driving force, ΔG0=-0.4eV), fractal shaped AgNPs (AgNFs) with an apparent size of 420nm were obtained (Figs. 1B left and S2A in ESI), confirming that highly exergonic ΔG0
produce fractal NPs. For the Ag NP system, Fe2+ is now a milder reducer, with a slightly exergonic driving force (ΔG0AgNC
=-0.03eV) and again Ag nanocubes (AgNCs) are preferentially produced with a mean edge length of 270nm (Fig. S2B in ESI). In agreement with AuNPs, AgNCs are smaller than AgNFs, suggesting that the driving force of the reduction also controls the NP growth rate. Noteworthy, the synthesis of cubic AgNPs in Fe2+/Fe3+ gradient is consistent with the reported role of Fe3+ oxidative etchant during the chemical synthesis of metallic nanocubes using either Ag or Pd ions precursors38 or from the reduction of octahedral AgCl.39 Under conditions of reversible growth thermodynamics, the presence of Fe3+ ions allows kinetics control and preferential facet growth. At higher driving force, as for the formation of AuNPs by Fe2+, the NPs etching by electrogenerated Fe3+ is thermodynamically unlikely, yielding a fractal growth from multiple seeds. Owing to the immediate observation of scattering features in the UME diffusion layer, the NPs are grown from the coalescence of highly mobile and concentrated seeds, most likely the small metal nuclei involved in coalescence-based growth mechanisms.2,4,40
In the most endergonic reduction case, when Au NCs are formed by reduction by Fe(bpy)32+, a slow redissolution of the
NPs could be monitored in situ. In video SV2 (SI), the scattering features, which appeared during the UME polarization progressively disappear after the polarization has been halted, which is not the case with Fe2+ or in any of the Ag NP electrosyntheses. This progressive redissolution of AuNPs by Fe(bpy)33+ generated at the UME (explained by the occurrence
of the backward reaction 3) can explain also why the reaction layer surrounding the UME (observed by dark field) is smaller than for all other cases.
3.3. In situ monitoring of the NP growth dynamics. 3.3.1. Average NP sizing from individual NP motion.
The previous section suggests how the Mn+ salt reduction driving force affects the NP shape and controls the NP size. Owing to the fast growth observed (>400nm in less than 10s), assessing the growth dynamics requires in situ monitoring. We use the ability of the dark field optical microscopy to dynamically localize the position of individual NPs while synthesized. The reactive trajectories of many individual NPs were extracted from the videos, allowing analyzing the mean square displacement (MSD) of these individual NPs during their electrosynthesis (Section 1 in ESI).
Examples of temporal MSDs were plotted in a log-log scale versus the time lag, tlag (time elapsed since the NP has been
first detected in the field of view and tracked) in Figs. 2C and D, and S4A and B in ESI for, respectively, the electrosynthesis of AuNFs, AuNCs, AgNFs and AgNCs. The linear MSD-time variation (unity slope in the log-log plot) observed for the different MSDs at the earliest times (t<1s) attests to a Brownian motion for which the MSD-time slope corresponds to 4DNP, where DNP is the average diffusion coefficient of the
tracked NP during its trajectory. This allows estimating the average hydrodynamic radius of individual NPs, Rp,MSD, from
Journal Name ARTICLE
This journal is © The Royal Society of Chemistry 20xx J. Name., 2013, 00, 1-3 | 5
the Boltzmann constant, T the temperature and η the solvent viscosity. The analysis of the MSDs yields a distribution of the NP apparent Rp,MSD (Figs. 2E and F, S4C and D in ESI, for,
respectively, AuNFs, AuNCs, AgNFs and AgNCs) that was compared to the apparent radius deduced from the SEM images, Rp,SEM (insets in the same Figs.): for NFs Rp,SEM was
estimated as the half of the NF size, while for NCs Rp,SEM was
estimated from the nanocubes edge length, l, with Rp,SEM=l(3/(4π))1/3. The mean values obtained from each
distribution, Rp,MSD,mean and Rp,SEM,mean, and for the different
electrosynthesis procedures are listed in Table 1. The distributions of Rp,SEM are comparable to those of Rp,MSD for
AgNFs and AgNCs, both in terms of mean value and size dispersion.
Fig. 2 A,B) Dark field optical images extracted from videos SV1 and SV2 in the region of
the apex of an Au UME, taken ~5s after the application of EUME=1.2V vs Ag/AgCl in 0.1M
KCl (aq) in the presence of 1mM of A) Fe2+or B) Fe(bpy)
32+. C,D) MSD analyses of
individual AuNFs and AuNCs trajectories, respectively. E, F) Distributions of AuNFs and AuNCs hydrodynamic radius (Rp,MSD), respectively, from MSD analysis of individual
2D-trajectories. Insets: distributions of the radius inferred from SEM images (Fig. S1 A and B in ESI).
For AuNFs, Rp,MSD,mean is significantly higher than Rp,SEM,mean (Fig.
2E). The presence of large AuNFs (Rp,MSD> 250nm), inferred
from the MSD analysis, was also confirmed from their optical sizing directly from the images in video SV1. Indeed, when particles become larger than the diffraction limit, their optically resolved radius, Rp,opt, was estimated from the
full-width at half maximum, FWHM, of the optical intensity profile of their corresponding scattering feature (Rp,opt = ½ FWHM, as
shown in Fig. S5A and B in ESI). For two examples of large Au NFs presented in Fig. S5B in ESI, the optically inferred Rp,opt
(840 and 330 nm) are in good agreement with the corresponding Rp,MSD extracted from the MSD (880 and 370
nm). The higher values of AuNFs size estimated optically likely correspond to NPs agglomerates, which are more prone to sedimentation rather than bonding to the UME and cannot be
detected by SEM analysis. The hypothesis of agglomeration phenomenon is further supported by the higher attractive van der Waals interactions for bigger NPs,4 as well as the higher Hamaker constant for Au than for Ag.41
The MSD analysis for AuNCs performed only during the growth phase provides higher Rp,MSD (Rp,MSD,mean≈ 270nm) than those
observed by SEM (Rp,SEM,mean≈ 170nm). This can be explained
by the partial dissolution of the NPs after the end of the electrosynthesis, as shown from video SV2.
Overall, the MSD analyses clearly evidence, in good agreement with the SEM characterizations, that Rp,AuNF>Rp,AuNC and
Rp,AgNF>Rp,AgNC. It follows the magnitude of the Mn+ ion
reduction driving force of the different electrosynthesis procedures (ΔG0AuNF<ΔG0AuNC and ΔG0AgNF<ΔG0AgNC, as shown in
Fig. 1 and Table 1).
3.3.2. Inspecting the driving force influence on single NPs growth dynamics.
If in average the size copped by both in situ and ex situ NP sizing approaches are correlated, a more detailed analysis of the MSD curves allows to account for the growth dynamics of the NPs according to the methodology previously described.33 Briefly, for time-dependent process such as NP growth, each growing NP is characterized by a time-dependent diffusion coefficient, DNP(t). Thus, from the Stokes-Einstein relationship,
it is possible to extract the time-dependence of the hydrodynamic radius Rp,MSD(t) of a given NP by segmenting its
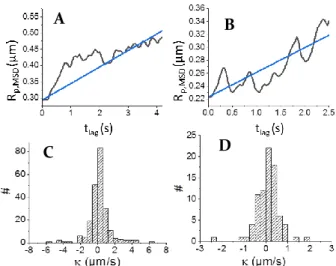
trajectory over discrete time lapses. Typical evolutions of Rp,MSD(t) are shown for the different syntheses in Figs. 3A and B
and S6A and B in ESI (black traces) for AuNFs, AuNCs, AgNFs and AgNCs, respectively. From such curves, the experimental growth rates of individual NPs were determined.
The apparent NP size increase with the reduction driving force suggests a kinetic control over the NP growth, likely by the reduction reaction, rather than a diffusion controlled process. A simple kinetic model using a first order kinetic growth is proposed in Section 2 of the ESI, it suggests a linear evolution of Rp,MSD(t) with time:
Rp,MSD(t) = Rp0,MSD+ κt (6)
where Rp0,MSD is the radius of a given individual NP at the
beginning of its tracking (taken as t=0 in equation 6) and
κ
is its individual apparent growth rate constant (in µm/s).Individual NP growth rates were then extracted by fitting the experimental size-transients, Rp,MSD(t), obtained from each NP
trajectory, by (6) (blue traces in Figs. 3A and B and S6A and B in ESI for AuNFs, AuNCs, AgNFs and AgNCs, respectively). For each synthesis procedure a distribution of individual NP growth rate constants, , is then produced (Figs. 3C and D and S6C and D (ESI) for AuNFs, AuNCs, AgNFs and AgNCs, respectively) from which median growth rates values (
κ
m) withassociated standard errors are extracted from the cumulative frequency of the individual growth rates, as explained in Fig. S7 (ESI), and reported in Table 1.
The growth of the NPs during the different synthetic procedures can then be discussed at the single and ensemble NP levels.
C
D
E
F
B
A
Fig. 3 A,B) Examples of experimental single Au NPs instantaneous radius evolution with
time (black); fit by A) κAuNF =0.16 µm/s and B) κAuNC =0.12 µm/s (blue). C, D) Distribution
of κAuNF extracted from video SV1 and κAuNC extracted from the first 7s of video SV2 and
another video in which the potential was applied continuously (> 70 images), respectively. Mean κ and associated standard deviation are given in Table 1. At the single entity level, the individual NP growth rate, , distributions are widely spread over the median value, which is due to propagation of errors intrinsically associated to MSD analysis. However different trends can be suggested from these distributions. First, the values for each NP whatever the synthesis procedure cannot be correlated to the NP initial size, Rp0,MSD, supporting the kinetic limitation assumption.
Then, the distributions suggests an overall growth (>0) of the NP during the UME polarization and therefore the electrogeneration of Mn+ ions for the majority of the tracked NPs and whatever the synthesis procedure and therefore whatever the NP shape. Except for the AuNCs, the NP size does not significantly change few seconds after the UME polarization is halted, suggesting the growth is driven by the continuous income of metal precursors from the electrode. In the case of the AuNCs, video SV2 suggests that AuNCs redissolve in solution when the electrogeneration of Au precursors is halted.
This redissolution can be resolved using the same methodology. The MSD analysis of the full video SV2 (SI) comprising both the period of UME polarization (first 7s of video SV2) followed by the period without polarization (last 8s of video SV2) may reveal, in Fig. S8B (ESI), a bimodal population of NPs with a dominant population of growing (>0) NPs and another population of dissolving NPs (<0). The situation is exalted when analyzing separately the trajectories during the UME polarization (Figs. 3D and S8C in ESI) or after it (Fig. S8D in ESI). If during the polarization the -distribution suggests an overall growth of NPs, after the polarization was halted, the whole -distribution is shifted toward negative values, allowing here too a means to quantify the NP dissolution kinetics.
At an ensemble NP level, the median growth rate constants
mextracted from in situ and individual NP behaviors during
all electrosyntheses decrease in the following order
m,AuNF>m,AuNC>m,AgNF>m,AgNC (Table 1). It confirms the same
trend observed when estimating the NP sizes ex situ at the end
of each synthesis and also supports that the higher the growth rate the larger the NP size at the end of the synthesis. Moreover, for AuNFs, AgNFs and AgNCs, this trend parallels the Mn+ ion reduction driving force variations: the more exergonic the reduction, the faster the NP growth. In the case of a kinetic control by the Mn+ ion reduction, one anticipates κ is proportional to the local concentration, [Mn+], and therefore to the Mn+ generated flux, f, given by the UME current, so that κm scales as iUME/n. As indicated in Section 2.1 (ESI), the
different syntheses were produced at approximately constant Mn+ ions flux (meaning constant iUME/n). In the proposed
simple first-order reaction rate framework, the variation of the NP growth with the reduction driving force may be rationalized by an activation-driving force relationship:
κ𝑚= e
αF
RT∆G° (7) where corresponds to the apparent transfer coefficient of the overall process. This activation-driving force relationship is presented as the line in Fig. 4A gathering the experimental variations of the different NP growth rates, m with G
0
. For the three AgNFs, AgNCs and AuNFs, a linear log m–G
0
trend holds reasonably with a rather low value of = 0.06. Such moderate effect of the driving force on the NP growth rates suggests an overall more complex growth mechanism. However, the Mn+ reduction contributes to this overall mechanism, which is in line with the in situ X-Ray probing of the speciation of metallic species present in solution during NP synthesis.40 Indeed, during the Au NP synthesis from the irreversible citrate reducer, even if metallic Au nuclei, which coalesce into NPs, are formed in the solution, Au(III) ions prevails in the solution.40a Our study suggests that this prevalence may be attributed to the kinetically limited reduction of the Au(III) ion.
3.3.3. Mechanism for the growth/dissolution process leading to AuNCs.
Noteworthy, the growth rate for the AuNCs, m,AuNC, is
significantly above the previously discussed structure-activity trendline. The faster growth rate observed for AuNCs than for AuNFs evidences that the shape is not only controlled by the growth rate. Indeed the re-dissolution of the NPs observed optically strongly suggests that the shape is rather controlled by the dissolution step.42 Moreover the voltammetric i-E curve recorded during the Au UME dissolution (see Fig. S3 in ESI) shows that the overall Au metal dissolution is shifted by ~0.14±0.02V toward more anodic potentials when Fe(bpy)32+ is
used instead of Fe2+. This potential difference is rationalized by the electrochemical dissolution of Au into another reactive Au ionic species.
The production of Au(I) species such as AuCl2- has been
proposed in aqueous media.43 From its tabulated standard potential, Au(I) is a stronger oxidant than Au(III) with difference in potential of E°(Au/AuCl2-) - E°(Au/AuCl4-) = 0.15V,
in line with the potential shift observed in the voltammetric curve (Fig. S3 in ESI). It is then likely that the presence of Fe(bpy)2+/3+ species inhibits the UME dissolution route into
A
B
D
C
Journal Name ARTICLE
This journal is © The Royal Society of Chemistry 20xx J. Name., 2013, 00, 1-3 | 7
Au(III), in favor of its one-electron dissolution according to equation 8:
Au0+ 2Cl−→ AuCl 2
−+ 1e− (8)
Fig. 4 A) log m for the different NP synthetic procedures as a function of the driving
force for the reduction of Mn+ by the reducer; : Au NPs, : Ag NPs and : AuNCs
according to the mechanism proposed in B). The slope of the green line yields an apparent value of α= 0.06.
The formation of AuNCs in solution would then result (Fig. 4B) from the 1-electron reduction of AuCl2- by Fe(bpy)32+, with now
a more exergonic driving force ΔG0 = -0.12eV (ΔE°=E°M – E°Fe(II)
= 0.12V):
AuCl2−+ Fe(bpy)32+→ Au0+ Fe(bpy)33++ 2Cl− (9)
The AuNCs formation by Fe(bpy)32+ would then rely on the
electrogeneration of AuCl2-, producing the AuNCs with a three times higher flux of metallic precursor (see equation 1, n=1
rather than n=3 in the presence of Fe2+). Noteworthy, taking into account a correction factor of 3 owing to the Au(I) precursor flux for the AuNCs growth rate constant, m, and the modification of the ΔG0 value, the corrected point for the AuNCs electrosynthesis now falls within the same trendline followed for the other synthesis processes (Fig. 4B). Together with the voltammetric curve, this further supports a mechanism implying the electrogeneration of Au(I) species. Finally, the position of the potentials of the different redox systems suggests that the strong oxidant Fe(bpy)33+, also
generated at the UME during its polarization, is able to etch Au by formation of AuCl4- (ΔG0diss = -0.09eV, backward reaction 3).
This reaction, depicted in Fig. 4B is most likely responsible for the observed AuNCs dissolution after the UME polarization was halted.
4. Conclusions
The electrosynthesis of colloidal Au and Ag NPs is performed from the anodic dissolution of sacrificial Au or Ag UMEs, without ligands in an aqueous solution containing various reversible redox reducers based on Fe(II) complexes. This electrochemical procedure allows a controlled triggering of the NP generation, which is monitored either ex situ by SEM or in
situ by dark field optical microscopy. The shape of the NPs is
related to the driving force given by ΔE° between the redox reducer and the metal ion precursor. Indeed, SEM images reveal that higher driving forces lead to fractal NPs whereas lower ones lead to well-defined nanocubes, suggesting a control of the NP formation by the reductive growth/oxidative etching thermodynamics.
In situ optical tracking of the trajectories of single NPs allows
analyzing the growth process of the individual NPs inside the diffusion layer of the UME for the different electrosynthesis procedures. The mean hydrodynamic radius extracted from the in situ tracking is in good agreement with the radius found by SEM for silver NPs. Thanks to the in situ visualization, more complicated growth processes can also be observed. For example the mechanism for AuNCs formation based on a reduction/dissolution process is highlighted. A deeper analysis of the individual NPs growth allows estimating the growth rate
m
A
B
UME Reducer ΔG° (eV) NP Rp,SEM,mean (nm) Rp,MSD,mean (nm) κm (µm/s) Au Fe2+ -0.69 AuNF 340 ± 130 700 ± 250 0.18± 0.03 Fe(bpy)32+ 0.09 (-0.12)a AuNC 170 ± 30 270 ± 90 0.13± 0.06 Ag FcMeOH -0.4 AgNF 200 ± 50 210 ± 20 0.08 ± 0.015 Fe2+ -0.03 AgNC 170 ± 50 120 ± 60 0.04 ± 0.015Table 1. Rp,SEM,mean, Rp,MSD,mean and median growth rate constant κm as a function of the metal and the reducer used for the NPs syntheses. aFor Fe(bpy)32+ the value in brackets considers AuCl2- as the Au NP precursor, rather than AuCl4-.
constants κ for each process and a structure-activity relationship between logκ and ∆G0 is found, attesting a kinetically limited growth. The extension of such relationship to other electron donors (irreversible included) should be promising for both size and shape control rationalization in NP synthesis. Based on such relationship and electrochemical observations, it was actually proposed a new synthetic route for the formation of AuNCs, which is based on the reduction of AuCl2- rather than AuCl4-. The accuracy of high resolution
optical microscopy analysis opens new routes to decipher in
situ the dynamics and the mechanistic investigation and
therefore in situ structure activity relationships for the formation of various other nanomaterials.
Conflicts of interest
There are no conflicts to declare.Acknowledgements
This work was financially supported by Labex MiChem, part of the French state funds managed by the Agence Nationale pour la Recherche, ANR, within the Investissement d’Avenir program under reference ANR-11-IDEX-004–02, by the Emergence call from Université de Paris within the Investissement d’Avenir program under reference ANR-18-IDEX-0001, CNRS, Paris Diderot University.
Reference
1 R. Narayanan and M. A. El-Sayed, Nano Lett. 2004, 4, 1343-1348.
2 E. E. Finney and R. G. Finke, J. Colloid Interface Sci. 2008, 317, 351-374.
3 N. T. K. Thanh, N. Maclean and S. Mahiddine, Chem. Rev. 2014, 114, 7610-7630.
4 J. Polte, Cryst Eng. Comm. 2015, 17, 6809-6830.
5 K. An and G. A. Somorjai, ChemCatChem 2012, 4, 1512-1524. 6 a) V. Gorshkov, A. Zavalov and V. Privman, Langmuir 2009,
25, 7940-7953; b) M. M. Mariscal, J. J. Velazquez-Salazar and
M. J. Yacaman, Cryst. Eng. Comm. 2012, 14, 544-549; c) M. Konuk and S. Durukanoglu, Phys. Chem. Chem. Phys. 2016,
18, 1876-1885.
7 H.-G. Liao, K. Niu and H. Zheng, Chem. Comm. 2013, 49, 11720-11727.
8 Y. Xia, Y. Xiong, B. Lim and S. E. Skrabalak, Angew.Chem. Int.
Ed. 2008, 48, 60-103.
9 H. Koerner, R. I. MacCuspie, K. Park and R. A. Vaia, Chem.
Mater. 2012, 24, 981-995.
10 H. E. M. Hussein, R. J. Maurer, H. Amari, J. J. Peters, L. Meng, R. Beanland, M. E. Newton and J. V. Macpherson, ACS Nano 2018, 12, 7388-7396.
11 a) E. Sutter, P. Sutter, A. V. Tkachenko, R. Krahne, J. de Graaf, M. Arciniegas and L. Manna, Nat. Commun. 2016, 7, 11213; b) K. Ouhenia-Ouadahi, A. Andrieux-Ledier, J. Richardi, P.-A. Albouy, P. Beaunier, P. Sutter, E. Sutter and A. Courty, Chem.
Mater. 2016, 28, 4380-4389; c) Q. Chen, H. Cho, K.
Manthiram, M. Yoshida, X. Ye and A. P. Alivisatos, ACS Cent.
Sci. 2015, 1, 33-39; d) H. M. Zheng, S. A. Claridge, A. M.
Minor, A. P. Alivisatos and U. Dahmen, Nano Lett. 2009, 9, 2460-2465; e) M. H. Nielsen, S. Aloni and J. J. De Yoreo,
Science 2014, 345, 1158-1162; f) D. S. Li, M. H. Nielsen, J. R. I.
Lee, C. Frandsen, J. F. Banfield and J. J. De Yoreo, Science 2012, 336, 1014-1018; g) E. A. Sutter and P. W. Sutter,
Nanoscale 2017, 9, 1271-1278.
12 T. Su, Z. L. Wang and Z. Wang, Small 2019, 15, 1900050. 13 M. R. Hauwiller, J. C. Ondry and A. P. Alivisatos, J. Vis. Exp.
2018, 135, 57665.
14 Y. Sun and Y. Wang, Nano Lett. 2011, 11, 4386-4392. 15 E. Sutter, K. Jungjohann, S. Bliznakov, A. Courty, E.
Maisonhaute, S. Tenney and P. Sutter, Nat. Comm. 2014, 5, 4946.
16 A. Hutzler, T. Schmutzler, M. P. M. Jank, R. Branscheid, T. Unruh, E. Spiecker and L. Frey, Nano Lett. 2018, 18, 7222-7229.
17 M. Wang, C. Park and T. J. Woehi, Chem. Mater. 2018, 30, 7727-7736.
18 a) S. Sun, M. Gao, G. Lei, H. Zou, J. Ma and C. Z. Huang, Nano
Research 2016, 9, 1125-1134; b) Y. Liu and C. Z . Huang, ACS Nano 2013, 7, 11026-11034.
19 a) A. N. Patel, A. Martinez-Marrades, V. Brasiliense, D. Koshelev, M. Besbes, R. Kuszelewicz, C. Combellas, G. Tessier and F. Kanoufi, Nano Lett. 2015, 15, 6454-6463; b) V. Brasiliense, P. Berto, C. Combellas, G. Tessier and F. Kanoufi, J. Am. Chem. Soc. 2016, 138, 3478-3483; c) V. Brasiliense, P. Berto, C. Combellas, G. Tessier and F. Kanoufi,
Acc. Chem. Res. 2016, 49, 2049; d) V. Brasiliense, J.
Clausmeyer, A. L. Dauphin, J.-M. Noël, P. Berto, G. Tessier, W. Schuhmann and F. Kanoufi, Angew. Chem. Int. Ed. 2017,
56, 10598-10601.
20 R. Xie, C. Batchelor-McAuley, N. Young and R. G. Compton,
Nanoscale, 2019, 11, 1720-1727.
21 a) D. A. Robinson, A. M. Kondajji, A. D. Castaneda, R. Dassari, R. M. Crooks and K. J. Stevenson, J. Phys. Chem. Lett. 2016, 7, 2512-2517; b) S. V. Sokolov, K. Tschulik, C. Batchelor-McAuley, K. Jurkschat and R. G. Compton, Anal. Chem. 2015,
87, 10033-10039; c) S. E. Fodsick, M. J. Anderson, E. G.
Nettleton and R. M. Crooks, J. Am. Chem. Soc. 2013, 135, 5994-5997.
22 a) C. M. Hill and S. Pan, J. Am. Chem. Soc. 2013, 135, 17250-17253; b) Y. Fang, H. Wang, H. Yu, X. Liu, W. Wang, H.-Y.
Journal Name ARTICLE
This journal is © The Royal Society of Chemistry 20xx J. Name., 2013, 00, 1-3 | 9
Chen and N. J. Tao, Acc. Chem. Res. 2016, 49, 2614-2624; c) C. P. Byers, B. S. Hoener, W. S. Chang, S. Link and C. F. Landes, Nano Lett. 2016, 16, 2314-2321.
23 C. Little, C. Batchelor-McAuley, K. Ngamchuea, C. Lin, N. Young and R. G. Compton, Chem. Open 2018, 7, 370-380. 24 a) K. Wonner, M. V. Evers and K. Tschulik, J. Am. Chem. Soc.
2018, 140, 12658-12661; b) K. Wonner, M. V. Evers and K. Tschulik, Electrochim. Acta 2019, 301, 458-464.
25 J. Djafari, A. Lodeiro, D. García-Lojo, J. Fernández-Lodeiro, B. Rodríguez-González, I. Pastoriza-Santos, J. Pérez-Juste, J. L. Capelo and C. Lodeiro, ACS Sustain. Chem. Eng. 2019, 7, 8295-8302.
26 A. Atesyan, O. Belhadj, C. Combellas, F. Kanoufi, V. Rouchon and J.-M. Noël, ChemElectroChem 2019, 6, 779–786.
27 G. Mettela and G. U. Kulkarni, Nano Res. 2015, 8, 2925– 2934.
28 A. J. D. Magenau, N. C. Strandwitz, A. Gennaro and K. Matyjaszewski, Science 2011, 332, 81-84.
29 a) L. Rodriguez-Sánchez, M. C. Blanco and M. A. López-Quintela, J. Phys. Chem. B 2000, 104, 9683-9688; b) G. R. Nasretdinova, R. R. Fazleeva, R. K. Mukhitova, I. R. Nizameev, M. K. Kadirov, A. Y. Ziganshina and V. V. Yanilkin,
Electrochem. Commun. 2015, 50, 69-72; c) V. V. Yanilkin, N.
V. Nastapova, G. R. Nasretdinova, R. R. Fazleeva and Y. N. Osin, Electrochem. Commun. 2016, 69, 36-40.
30 T. Yousefi, R. Davarkhah, A. N. Golikand, M. H. Mashhadizadeh and A. Abhari, Prog. Nat. Sci. Mater. 2013,
23, 51-54.
31 a) M. T. Reetz and W. Helbig, J. Am. Chem. Soc. 1994, 116, 7401-7402; b) M. T. Reetz and S. A. Quaiser, Angew. Chem.
Int. Ed. 1995, 56, 2240-2241; c) N. Vilar-Vidal, M. C. Blanco,
M. A. López-Quintela, J. Rivas and C. Serra, J. Phys. Chem. C 2010, 114, 15924-15930; d) B. S. González, M. C. Blanco and M. A. López-Quintela, Nanoscale 2012, 4, 7632-7635; e) C. Fernandez-Blanco, A. Colina, A. Heras, V. Ruiz and J. Lopez-Palacios, Electrochem. Commun. 2012, 18, 8-11.
32 M. T. Reetz, W. Helbig and S. A. Quaiser, Chem. Mater. 1995,
7, 2227-2228.
33 V. Brasiliense, J.-M. Noël, K. Wonner, K. Tschulik, C. Combellas and F. Kanoufi, ChemElectroChem 2018, 5, 3036-3043.
34 a) S. Meltzer and D. Mandler, J. Electrochem. Soc. 1995, 142, L82-L84; b) I. Turyan, M. Etienne, D. Mandler and W. Schuhmann, Electroanalysis 2005, 17, 538-542; c) E. Malel, R. Ludwig, L. Gorton and D. Mandler, Chem. Eur. J. 2010, 16, 11697-11706.
35 P. Vanýsek, in Electrochemical series in CRC Handbook of
Chemistry and Physics, 83rd ed., Ed: D. R. Lide, CRC Press,
Boca Raton, 2002, pp 8-21−8-31.
36 a) Y. G. Zhou, N. V. Rees and R. G. Compton, Angew. Chem.
Int. Ed. 2011, 50, 4219-421; b) E. J. E. Stuart, N. V. Rees, J. T.
Cullen and R. G. Compton, Nanoscale, 2013, 5, 174-177; c) B. Plowman, K. Tschulik, E. Walport, N. Young and R. G. Compton, Nanoscale, 2015, 7, 12361-12364.
37 W. Cheng and R. G. Compton, Trends Anal. Chem. 2014, 58, 79-89.
38 Y. Ma, W. Li, J. Zeng, M. McKiernan, Z. Xie and Y. Xia, J.
Mater. Chem. 2010, 20, 3586-3589.
39 S. Zhou, J. Li, K. D. Gilroy, J. Tao, C. Zhu, X. Yang, X. Sun and Y. Xia, ACS Nano 2016, 10, 9861-9870.
40 a) J. Polte, T. T. Ahner, F. Delissen, S. Sokolov, F. Emmerling, A. F. Thünemann and R. Kraehnert, J. Am. Chem. Soc. 2010,
132, 1296-1301; b) J. Polte, R. Erler, A. F. Thünemann, S.
Sokolov, T. T. Ahner, K. Rademann, F. Emmerling and R. Kraehnert, ACS Nano 2010, 4, 1076-1082.
41 K. Jiang and P. Pinchuk, Nanotechnology 2016, 27, 345710. 42 a) Y. Xiong, J. Chen, B. Wiley, Y. Xia S. Aloni, Y. Yin, J. Am. Chem.
Soc. 2005, 127, 20, 7332-7333. b) Y. Xiong, B. Wiley, J. Chen, Z.-Y. Li,
Y. Yin, Y. Xia, Angew. Chem. Int. Ed. 2005, 44, 7913-7917.
43 S. Seisko, M. Lampinen, J. Aromaa, A. Laari, T. Koiranen and M. Lundström, Miner. Eng 2018, 115, 131-141.