HAL Id: hal-01394335
https://hal.archives-ouvertes.fr/hal-01394335
Preprint submitted on 9 Nov 2016HAL is a multi-disciplinary open access
archive for the deposit and dissemination of sci-entific research documents, whether they are pub-lished or not. The documents may come from teaching and research institutions in France or abroad, or from public or private research centers.
L’archive ouverte pluridisciplinaire HAL, est destinée au dépôt et à la diffusion de documents scientifiques de niveau recherche, publiés ou non, émanant des établissements d’enseignement et de recherche français ou étrangers, des laboratoires publics ou privés.
On the mechanisms governing gas penetration into a
tokamak plasma during a massive gas injection
E Nardon, A Fil, Patrick Tamain, R Guirlet, H Koslowski, M Lehnen, C
Reux, F Saint-Laurent
To cite this version:
E Nardon, A Fil, Patrick Tamain, R Guirlet, H Koslowski, et al.. On the mechanisms governing gas penetration into a tokamak plasma during a massive gas injection. 2016. �hal-01394335�
On the mechanisms governing gas penetration into a tokamak
plasma during a massive gas injection
E. Nardon1, A. Fil1a, P. Tamain1, R. Guirlet1, H.R. Koslowski2,
M. Lehnen3, C. Reux1, F. Saint-Laurent1 and JET contributors4,∗
1CEA, IRFM, F-13108 Saint-Paul-Lez-Durance, France 2Forschungszentrum J¨ulich GmbH, Institut f¨ur Energie und
Klimaforschung - Plasmaphysik, 52425 J¨ulich, Germany
3ITER Organization, Route de Vinon sur Verdon,
13115 Saint Paul Lez Durance, France
4EUROfusion Consortium, JET, Culham Science Centre, Abingdon, OX14 3DB, UK and ∗See the Appendix of F. Romanelli et al.,
Proceedings of the 25th IAEA Fusion Energy Conference 2014, Saint Petersburg, Russia
Abstract
A new 1D radial fluid code, IMAGINE, is used to simulate the penetration of gas into a tokamak plasma during a Massive Gas Injection (MGI). The main result is that the gas is in general strongly braked as it reaches the plasma, due to mechanisms related to charge exchange and (to a smaller extent) recombination. As a result, only a fraction of the gas penetrates into the plasma. Also, a shock wave is created in the gas which propagates away from the plasma, braking and compressing the incoming gas. Simulation results are quantitatively consistent, at least in terms of orders of magnitude, with experimental data for a D2 MGI into a JET Ohmic plasma. Simulations of MGI into the background plasma surrounding a runaway electrons beam show that if the background electron density is too high, the gas may not penetrate, offering a possible explanation to the recent results of Reux et al. in JET [1].
I. INTRODUCTION
Due to the potentially deleterious consequences of disruptions in ITER, a Disruption Mitigation System (DMS) is needed [2] [3]. Its design, which is presently underway, is based on the use of massive material injection, in the form of either gas (Massive Gas Injection or MGI) or shattered pellets [4] [5]. This paper focuses on MGI and more specifically on its modelling. Our objective is to identify key mechanisms which determine the penetration of the gas into the plasma and to study their dependency on plasma parameters.
MGI consists in releasing a large amount of gas (compared to the plasma content) by suddenly opening a gas reservoir which can be located from a few cm to a few m away from the plasma. After a certain time of propagation in vacuum, the arrival of the gas into the plasma typically leads to an increase of the electron density ne and the propagation of a
cold and radiating front into the plasma (see for example Figure 12 in [6] for high-resolution profiles in MAST). At some point, a thermal quench (TQ) is triggered. There is evidence in several machines (e.g. MAST [6], Tore Supra [8] and TEXTOR [7]) that the TQ is triggered when the cold front reaches the q=2 surface.
Significant work has been devoted by experimentalists to the estimation of the ratio between the increase in the number of electrons ∆Ne and the number of gas atoms that
has reached the edge of the plasma, Ninj (the latter being estimated using models for the
gas propagation into vacuum) [8] [9] [10] [11]. This ratio, which is often called “fuelling efficiency” and noted Fef f, is indeed of importance regarding, for example, the objective
of suppressing Runaway Electrons (RE) by increasing ne [4] [5]. Depending on the type
of gas, the reservoir pressure and characteristics (e.g. its distance to the plasma) and the plasma parameters, Fef f can vary significantly, typically from a few % to a few tens of %.
This indicates that the gas penetrates only partially, and sometimes even marginally, into the plasma. This is consistent with, for example, the observation from DIII-D that “over a wide range of initial target conditions [...], visible camera images of neutral Ar emission indicate that the propagation of jet neutrals is stopped at the plasma edge (' 0 − 5 cm past the separatrix) during the TQ” [12]. Another important recent result possibly related to the question of gas penetration is the unsuccessful attempt to suppress an RE beam after its formation using MGI on JET [1]. One possible reason for this failure is indeed that the gas does not penetrate deep enough into the background plasma and thus cannot reach
the RE beam. Clearly, the above points motivate efforts to understand the mechanisms governing gas penetration during an MGI. The development of a new 1D radial fluid code called IMAGINE and its application to MGI simulations described below are part of these efforts.
A number of codes have been used for MGI modelling over the past, including ASTRA [13] [14], TOKES [15] [16], SOLPS [17], NIMROD [18] [19] [20] [21] [22], JOREK [23] and the code of Rozhansky et al. [24]. Compared to these works, the approach presented here is original in that it treats gas transport as purely convective (as it should be, according to first principles) and it includes the gas reservoir, vacuum region and plasma in the simulation domain. These ingredients are essential to simulate the processes described below.
The paper is constructed as follows. Section II presents the model and the IMAGINE code. Section III describes simulations of a D2 MGI into a JET Ohmic plasma, discusses
the mechanisms at play and compares the results to experimental observations. Section
IV presents simulations whose aim is to investigate the penetration of the gas into the background plasma co-existing with a RE beam. Finally, Section V concludes and gives perspectives.
II. MODEL
A. Geometry, equations and assumptions
The model is 1D in the radial direction and assumes a slab geometry. It is a fluid model, which seems reasonable given the large gas densities typical of MGI. The gas is assumed to be made of atoms of the same species as the plasma ions, with an atomic number Z = 1. Below, we simulate D2 MGI into D+ plasmas. We however ignore the existence of D2 molecules and
do as if the gas was made of D atoms, neglecting the dissociation energy of D2 molecules
(this seems reasonable since this energy is a factor 5 smaller than the ionization energy of two D atoms). The model consists of 6 equations describing the evolution of the electron density ne (which, due to quasi-neutrality, is equal to the ion density ni) and temperature
Te, the ion temperature Ti and the neutral density nn, velocity Vn and pressure Pn, written
∂tne = nennI − n2eR + ∂r(D∂rne) (1) ∂t( 3 2neeTe) = −ne(nnIEion+ nnLlines+ neR 3 2eTe) − n 2 eLbrem+rec+ ∂r(χne∂r(eTe)) (2) ∂t( 3 2neeTi) = 3
2ne(IPn− neReTi− σcxVcx(nneTi− Pn)) + ∂r(χne∂r(eTi)) (3)
∂tnn= −∂r(nnVn) − nennI + n2eR (4) ∂t(mnnnVn) = −∂r(mnnnVn2+ Pn) − nnne(I + σcxVcx)mnVn (5) ∂t( 3 2Pn+ 1 2mnnnV 2 n) = − ∂r( 5 2PnVn+ 1 2mnnnV 3 n) − nnne(I + σcxVcx)( 3 2Pn/nn+ 1 2mnV 2 n) + ne(neR + nnσcxVcx) 3 2eTi (6) In these equations, I, R and σcxVcxare the ionization, recombination and charge exchange
rates, Eion is the ionization energy and Llines and Lbrem+rec are the line and continuum (i.e.
bremmstrahlung plus recombination) radiation rates. Details on these coefficients are given in SectionII C. All quantities are in SI units except temperatures which are in eV. D and χ are particle and heat diffusivities which are meant to represent turbulent transport. These two parameters are the only ad hoc parameters of the model and their effect is in fact limited. In the simulations below, we use D = χ = 1 m2/s.
It is worth comparing our equations to those of the general non-linear fluid model for reacting plasma-neutral mixtures from Meier and Shumlak [26]. Equations 1-6 above cor-respond to Equations 48-56 of [26] under the following assumptions/modifications: charged species are assumed to be at rest; scattering collisions are neglected; radiation losses are added; the term Rcx
in is neglected; electron particle diffusion is added and electron and ion
heat fluxes are treated as diffusive as a way to account for turbulent transport, as mentioned above.
The assumption of charged species being at rest is probably the most important one and deserves some discussion. As mentioned by Rozhansky et al. [24], the gas tends to “push” charged species, i.e. to give rise to an E × B flow in the direction of the gas flow, but several mechanisms may damp this E × B flow. The physics involved is similar to the physics of pellet ablation clouds [25]. In the latter case, the strongest damping mechanism may be described as follows. The E × B flow is intimately related to an electric field E = −∇Φ in the cloud. If a field line connects the top and the bottom of the cloud (after a certain number of toroidal turns), the potential difference ∆Φ between its extremities will drive a parallel current. The current path will be closed (it has to be for quasi-neutrality to pertain) by a polarization current proportional to dE/dt circulating inside the cloud. The latter is associated to a reduction of |E| and therefore a damping of the flow. This mechanism, which is already strong for pellet ablation clouds, is likely to be even stronger in the MGI case because of the larger the cloud poloidal extent. Note that this mechanism, introduced by P´egouri´e et al. in [25], was not included in the slightly older work of Rozhansky et al. [24]. For simplicity we assume here that this braking mechanism is strong enough that charged species remain at rest. The question may however be addressed in future work by including a momentum equation for charged species in our model. Looking at our equations, one may notice that the term −ne(I+ < σv >cx)12mnnnVn2 in the neutral energy equation (Eq.
6), which represents kinetic energy transferred from neutrals to ions due to ionization and charge exchange, has no counterpart in the ion energy equation (Eq. 3). This is because this term is associated to a momentum transfer between neutrals and ions, and this momentum is assumed to be annihilated by the braking force(s) acting on charged species. Consistently, the associated energy is assumed to be annihilated by the work of the braking force(s).
B. Initial and boundary conditions
One key feature of our model is to treat in a unified way the plasma, the vacuum region and the gas reservoir: the above equations apply throughout these three domains and the simulations cover the gas propagation into the vacuum and its interaction with the plasma, as will be presented in Section III.
Boundary conditions are null gradients for all fields at the center of the plasma (r = 0) and Vn = 0 at the end of the gas reservoir (r = rmax).
Initial conditions for ne, Te and Ti are typically set according to pre-MGI experimental
measurements. Initial conditions for nn and Pn are a finite and homogeneous value in the
reservoir and 0 elsewhere, while Vn = 0 everywhere. The initial values of nn and Pn in the
reservoir, as well as the radial extent of the reservoir in the simulation, are chosen so as to match three critical experimental quantities: the initial number of D atoms and the sound velocity cs,res inside the reservoir and the initial flux of atoms out of it (technical details are
given in Appendix A). This allows reproducing the gas flow in the vacuum region, as we shall see below.
C. Atomic physics coefficients
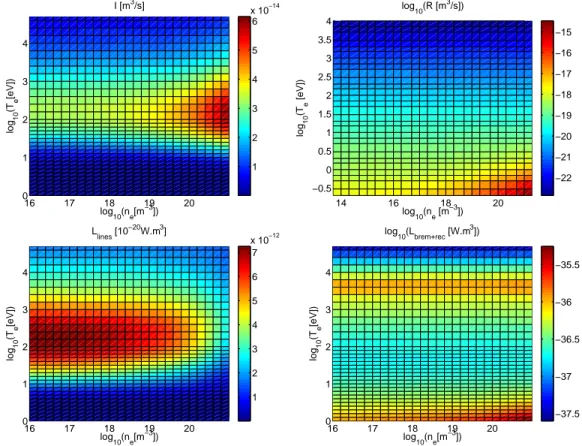
Coefficients I, R, Llinesand Lbrem+rec are taken from the ADAS database [27], where they
are given as function of ne and Te. They are represented in Figure 1.
16 17 18 19 20 0 1 2 3 4 log 10(ne[m −3]) log 10 (Te [eV]) I [m3/s] 1 2 3 4 5 6 x 10⁻¹⁴ 14 16 18 20 −0.5 0 0.5 1 1.5 2 2.5 3 3.5 4 log 10(ne [m −3]) log 10 (T e [eV]) log10(R [m3/s]) −22 −21 −20 −19 −18 −17 −16 −15 16 17 18 19 20 0 1 2 3 4 log 10(ne[m −3]) log 10 (T e [eV]) L lines [10 −20W.m3] 1 2 3 4 5 6 7 x 10⁻¹² 16 17 18 19 20 0 1 2 3 4 log 10(ne[m −3]) log 10 (T e [eV]) log 10(Lbrem+rec [W.m 3]) −37.5 −37 −36.5 −36 −35.5
FIG. 1. Atomic physics coefficients for deuterium from the ADAS database
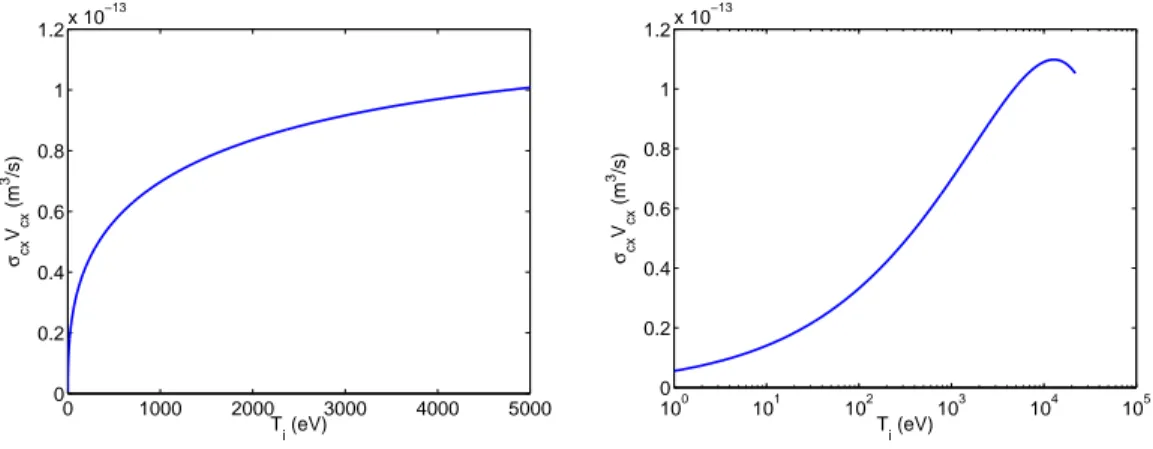
For the charge exchange rate σcxVcx, we use the expressions given in Meier and Shumlack
10−18− 7.15 × 10⁻²⁰ln(V
cx) (see Section III.D.2 in [26]) and Vcx = (π4v2T i + 4 πv
2
T n+ Vn2)1/2
(Eq. 17 in [26]), where vT α ' (2eTα/mα)1/2 is the thermal velocity of species α. Figure 2
shows σcxVcx as a function of Ti, assuming that vT n and Vn are negligible.
0 1000 2000 3000 4000 5000 0 0.2 0.4 0.6 0.8 1 1.2x 10 −13 T i (eV) σcx Vcx (m 3/s) 100 101 102 103 104 105 0 0.2 0.4 0.6 0.8 1 1.2x 10 −13 T i (eV) σcx Vcx (m 3/s)
FIG. 2. D−D+charge exchange rate σcxVcxas a function of Ti(left: linear scale; right: logarithmic scale), assuming that vT n and Vn are negligible (see text for explanation)
D. The IMAGINE code
Equations 1 to 6 have been implemented in a new code called IMAGINE. A MUSCL scheme (Monotonic Upstream-Centered Scheme for Conservation Laws) is used to advance the neutral equations ignoring the atomic physics terms. The MUSCL scheme is a finite volume method providing highly accurate numerical solutions even when the solutions ex-hibit shocks or discontinuities (which is the case here). The part related to atomic physics is advanced separately with an explicit scheme. The equations for electrons and ions are advanced with an explicit conservative scheme.
III. SIMULATION OF A D2 MGI INTO A JET OHMIC PLASMA
In this Section, we present IMAGINE simulations of MGI into a “hot” plasma. Section
A. Description of the experiment
We simulate JET pulse 86887. This is an Ohmic D plasma pulse with Bt= 2 T, Ip = 2
MA, q95 = 2.9 in which a disruption was triggered on a “healthy” plasma by activating
the Disruption Mitigation Valve number 2 (DMV2). Note that the same pulse has been modelled with the 3D non-linear MHD code JOREK, as reported in [23].
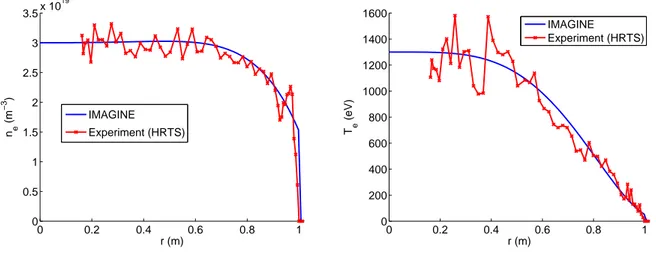
Electron density and temperature profiles just before the DMV2 trigger are shown in Fig-ure 3together with fits of these profiles used as initial conditions in IMAGINE simulations.
0 0.2 0.4 0.6 0.8 1 0 0.5 1 1.5 2 2.5 3 3.5x 10 19 r (m) n e (m − 3) IMAGINE Experiment (HRTS) 0 0.2 0.4 0.6 0.8 1 0 200 400 600 800 1000 1200 1400 1600 r (m) Te (eV) IMAGINE Experiment (HRTS)
FIG. 3. Experimental ne (left) and Te (right) profiles for JET pulse 86887 from High Resolution Thomson Scattering (HRTS) just before the DMV2 trigger (red crosses) and fits of these profiles used as initial conditions in IMAGINE (blue). (Note: the HRTS data has been remapped onto an EFIT equilibrium. The radial coordinate r used in the above profiles is defined as a · ψ0.5n , with a = 1 m, where ψn is the normalized poloidal flux from EFIT.)
In this pulse, DMV2 was pre-loaded with D2 at 5 bar, which represents 1.2 · 1023 D2
molecules (the volume of the DMV2 reservoir being Vres = 1 L and its temperature ' 300
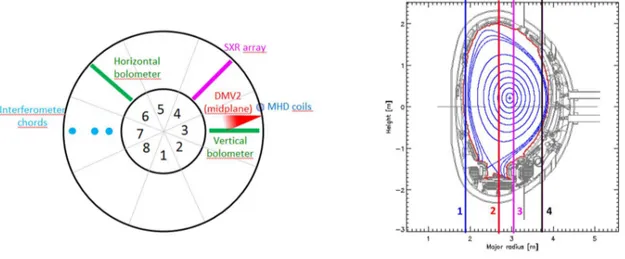
K), i.e. roughly 100 the initial D nuclei content of the plasma. After the valve opening, the gas propagates towards the plasma via a guiding tube of length Ltube = 2.36 m. The
gas is then delivered at the midplane of Octant 3, as shown in Figure 4. This figure also gives information on the position of diagnostics relevant to this paper, in particular vertical interferometry lines, which are located in Octant 7, i.e. opposite to DMV2. Figure 5 shows an overview of the disruption phase. First effects of the MGI are visible from about 2 ms (relative to the DMV2 trigger) in the form of increases in the line integrated density and radiated power. The thermal quench occurs at about 12 ms as can be seen from the fast collapse of the Soft X-Ray (SXR) signal accompanied by a burst of MHD activity and immediately followed by the characteristic Ip spike. The current quench ensues.
FIG. 4. Left: Schematic view of JET from the top, indicating octant numbers and the location of DMV2 and diagnostics used in Figure 5. Right: Poloidal cross-section showing magnetic flux contours from EFIT reconstruction just before the triggering of DMV2 and the interferometry vertical lines of sight.
1.5 2 2.5 [MA] I p −10 0 10 [V] dB/dt 0 100 200 [MW] P rad 0 2 4 [10 20 m −2 ] n el 0 0.002 0.004 0.006 0.008 0.01 0.012 0.014 0.016 0.018 0.02 0 10 20 [W.m −2 ] SXR
Time from DMV2 trigger [s]
LoS 2
LoS 3 LoS 4 LoS 1
FIG. 5. Experimental time traces for JET pulse 86887, from top to bottom: plasma current Ip, magnetic fluctuations from Mirnov coil, radiated power from bolometry, line integrated density from interferometry, and soft X-rays signal from a central chord (see Figure 4 for information on the diagnostics position). The time origin corresponds to the DMV2 trigger.
B. Simulation results
We shall now describe the IMAGINE simulation results, starting with the propagation of the gas into the vacuum region (i.e. the guiding tube).
1. Gas propagation into the vacuum region
In laboratory experiments, Bozhenkov et al. have found that the gas flow in the guiding tube is well described by the analytical solution of the 1D Euler equations with an infinite reservoir, under the condition that d
cs,res·t > 0.6, where d is the distance to the reservoir [9].
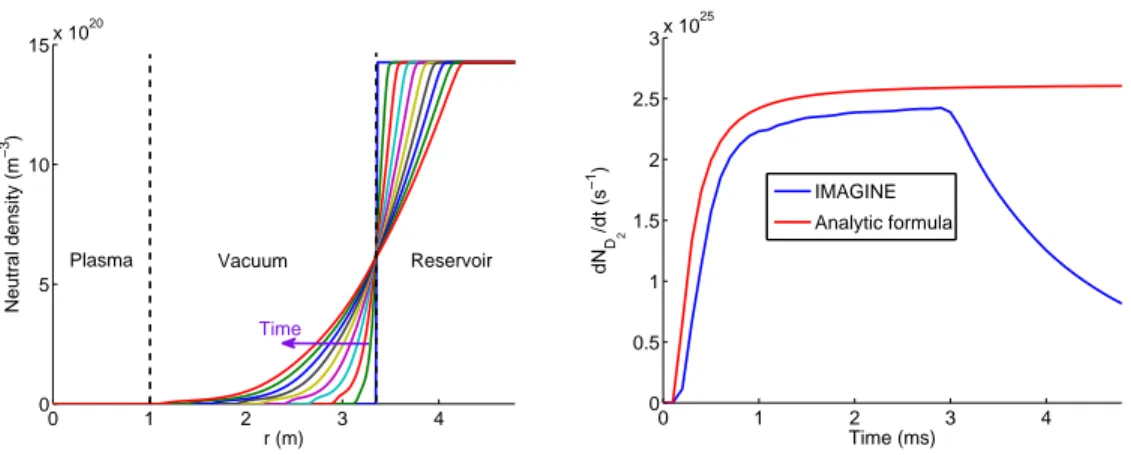
This type of flow is called a “rarefaction wave”. Since in the vacuum region the equations of IMAGINE boil down to the 1D Euler equations, we recover this flow in the simulations. Figure 6 (left) shows successive neutral density profiles calculated by IMAGINE. One can observe the typical self-similar behaviour of the rarefaction wave [9]. Figure 6(right) shows the flux of D2 molecules across r = 3 m, comparing IMAGINE and the analytical solution
(given explicitly in [9]). A good match (with a difference < 10 %) can be observed up to about 3 ms, from which point the IMAGINE solution starts to decrease due to the depletion of the reservoir, in contrast with the analytical solution which assumes an infinite reservoir. In Figure6(left), the reader may notice that the reservoir in IMAGINE has a radial extent of about 1.5 m, which is much larger than the typical dimension of the actual reservoir, whose volume is Vres= 1 L. Reasons for this are detailed in Appendix A. One consequence is that
the pressure equilibration time in the reservoir is much longer in the simulations than in the experiment. This must lead to a slightly inexact description of the gas flow. The real gas flux probably has a smoother behaviour, with no abrupt change at 3 ms as in Figure 6
(right). However, the discrepancy is probably not very large and, as stated above, the early gas flow calculated by IMAGINE matches well the laboratory measurements of Bozhenkov et al., giving confidence in the following results (which essentially have to do with the early interaction of the gas with the plasma).
0 1 2 3 4 0 5 10 15x 10 20 r (m) Neutral density (m − 3) Vacuum Reservoir Time Plasma 0 1 2 3 4 0 0.5 1 1.5 2 2.5 3x 10 25 Time (ms) dN D2 /dt (s −1 ) IMAGINE Analytic formula
FIG. 6. Left: Successive neutral density profiles (separated by 0.1 ms) from IMAGINE simulation. Right: Flux of D2 molecules in vacuum across r = 3 m as found with IMAGINE and with the analytical solution of the 1D Euler equations.
Let us now focus on what happens when the gas reaches the plasma. Here, charge exchange and recombination play a central role. In order to demonstrate this, we will first present a simulation without these effects and then a simulation with these effects.
2. Gas penetration into the plasma, neglecting charge exchange and recombination
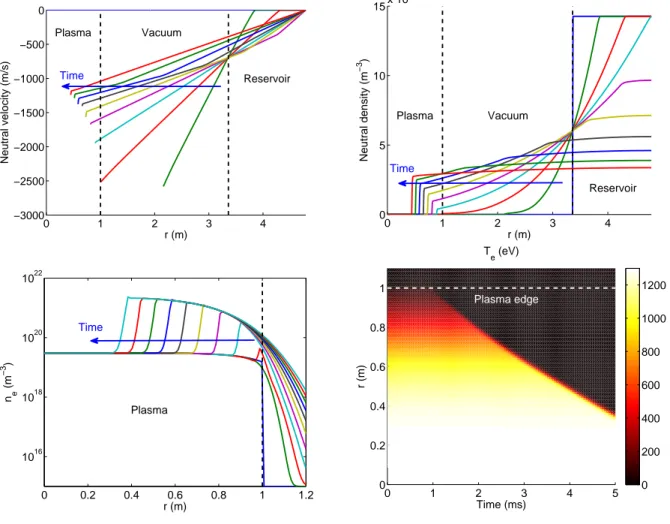
Without charge exchange and recombination, the gas penetrates easily into the plasma. This is apparent in Figure 7 (top left), which shows profiles of the neutral velocity Vn at
different times: the gas flow is not affected as the gas enters the plasma. On the neutral density profiles shown in Figure 7 (top right), one can see that the tip of the rarefaction wave is “eaten” by ionisation. This causes a dramatic increase in ne, which reaches values
on the order of 2 · 1021m−3, as can be seen in Figure 7 (bottom left) (note the
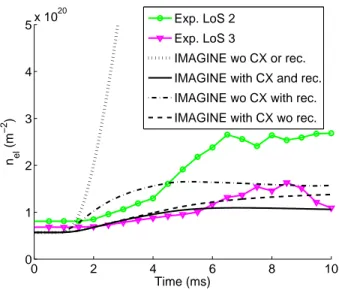
logarith-mic scale in this figure). This increase in ne is clearly incompatible with experimental
data, as can be seen in Figure 8, which compares experimental and synthetic interferom-etry data. In this figure, the synthetic data is calculated from the output of IMAGINE as nel = 2
Ra
0 nedr (the factor 2 comes from the fact that the experimental measurement
corresponds to Ra
−anedr = 2
Ra
0 nedr), and compared with experimental measurements from
lines of sight 2 and 3 of the interferometer, which are rather central, as can be seen in Figure
8 (right). Note that the comparison is meaningful only if the experimental ne is relatively
homogeneous on flux surfaces. This may indeed be the case due to the fast parallel expan-sion of the over-density created by the MGI. For example, JOREK simulations [23] find a parallel expansion velocity vk ' 30km.s−1, corresponding to a density homogenization time
τ ' 2πqRv
k ' 2ms. In Figure 8, the synthetic signal from the IMAGINE simulation without
charge exchange and recombination goes beyond the axis limit at about 2.5 ms and contin-ues increasing dramatically later, reaching valcontin-ues one order of magnitude higher than the experimental ones, clearly indicating that some assumptions of the model must be wrong. This process is accompanied by the penetration of a very sharp cold front, as can be seen in Figure 7 (bottom right). The cooling is mostly due to dilution, since ne increases by
roughly 2 orders of magnitude. It can be seen that within 1.5 ms from the DMV2 trigger, the cold front has reached r = 0.9 m, which corresponds to the q = 2 surface, and within 4 ms it has reached mid-radius. This is also incompatible with experimental data since the TQ is observed about 12 ms after the DMV2 trigger. Recall that in several machines, the
TQ has been observed to occur when the cold front reaches the q = 2 surface [6] [8] [7], and even though there is not clear experimental evidence for this fact in JET, JOREK modelling suggests that this is the case too [23].
0 1 2 3 4 −3000 −2500 −2000 −1500 −1000 −500 0 r (m) Neutral velocity (m/s) Plasma Vacuum Reservoir Time 0 1 2 3 4 0 5 10 15x 10 20 r (m) Neutral density (m − 3 ) Plasma Vacuum Reservoir Time 0 0.2 0.4 0.6 0.8 1 1.2 1016 1018 1020 1022 r (m) n e (m − 3) Plasma Time 0 1 2 3 4 5 0 0.2 0.4 0.6 0.8 1 Time (ms) r (m) T e (eV) Plasma edge 0 200 400 600 800 1000 1200
FIG. 7. Successive profiles of neutral velocity Vn (top left), neutral density nn (top right), and electron density ne (bottom left), separated by 0.5 ms; electron temperature Te versus time and radius (bottom right)
To summarize, when neglecting charge exchange and recombination, the gas and the cold front penetrate much too fast and easily compared to the experiment.
3. Gas penetration into the plasma, including charge exchange and recombination
Turning on the charge exchange and recombination terms changes the situation drasti-cally: the gas flow is now rapidly stopped at the edge of the plasma and a shock wave is
0 2 4 6 8 10 0 1 2 3 4 5x 10 20 Time (ms) n e l (m −2 ) Exp. LoS 2 Exp. LoS 3 IMAGINE wo CX or rec. IMAGINE with CX and rec. IMAGINE wo CX with rec. IMAGINE with CX wo rec.
FIG. 8. Comparison between experimental and synthetic interferometry data (see Figure 4 to visualize the interferometry lines of sight).
created which propagates away from the plasma, as is clearly visible on the successive neutral velocity (Vn) and density (nn) profiles from Figure 9 (top left and right plots). Concerning
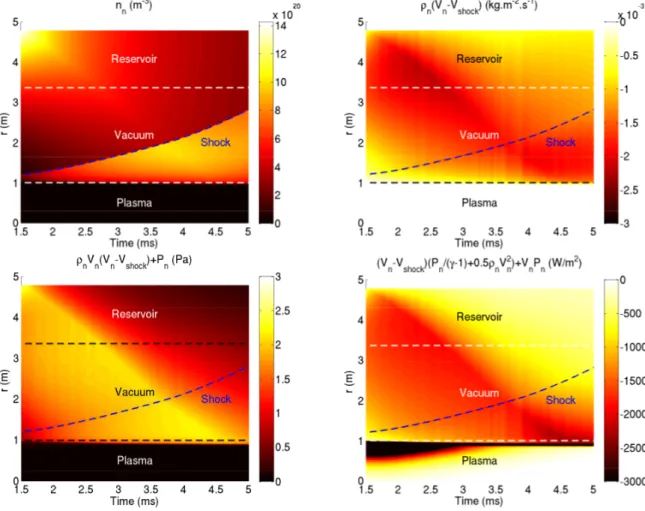
the shock wave, it is good to check whether Rankine-Hugoniot jump conditions [28] are satis-fied in the simulation. Figure10shows that this is the case: while nnis discontinuous across
the shock (top left plot), the quantities ρn(Vn− Vshock) (top right), ρnVn(Vn− Vshock) + Pn
(bottom left) and (Vn− Vshock)(γ−1Pn + 21ρnVn2) + VnPn (bottom right) are continuous (where
ρn = mnnn), in agreement with the conservation of mass, momentum and energy density.
This indicates that IMAGINE resolves the shock wave appropriately.
As a result of the strong braking, only a small fraction of the gas penetrates into the plasma and the ne increase is therefore much more modest than in the previous simulation.
Still, ne increases by a factor ' 6 at r = 0.9 m, as can be seen in Figure 9 (bottom left
plot). Looking at Figure8 again, this simulation (plain line) appears much more consistent with interferometry data than the previous one: the nel increase now has the right order of
magnitude. Figure9(bottom right) indicates that the cold front is less sharp and penetrates much more slowly than in the previous simulation. It takes about 5 − 10 ms for it to reach the q = 2 surface (r = 0.9 m), which is compatible with the experimental TQ onset time of 11 ms. In conclusion, when including charge exchange and recombination, IMAGINE simulations are rather consistent with experimental measurements. Let us now interprete these results.
0 1 2 3 4 −3000 −2500 −2000 −1500 −1000 −500 0 500 r (m) Neutral velocity (m/s)
Plasma Vacuum Reservoir
Time 0 1 2 3 4 0 5 10 15x 10 20 r (m) Neutral density (m − 3 ) Plasma Vacuum Reservoir Time 0 0.2 0.4 0.6 0.8 1 1.2 0 0.5 1 1.5 2 2.5x 10 20 r (m) ne (m − 3 ) Plasma Time
FIG. 9. Successive profiles of neutral velocity Vn (top left), neutral density nn (top right), and electron density ne (bottom left), separated by 0.5 ms; electron temperature Te versus time and radius (bottom right)
C. Interpretation
The above simulations demonstrate the crucial role of charge exchange and recombination in promptly braking the gas, limiting its penetration into the plasma and giving birth to a shock wave propagating away from the plasma. In order to identify the mechanisms responsible for this braking, let us consider the equation for the evolution of Vn (which can
be derived from Equations 4and 5):
mnnndtVn= −∂rPn− (ne2R + nennσcxVcx)mnVn (7)
FIG. 10. Verification of the Rankine-Hugoniot (RH) jump conditions: the shock (blue dashed line) corresponds to a discontinuity on the neutral density (top left) but not on ρn(Vn− Vshock) (top right), ρnVn(Vn− Vshock) + Pn (bottom left) or (Vn− Vshock)(γ−1Pn +12ρnVn2) + VnPn (bottom right), in agreement with the RH conditions.
the neutral pressure gradient and by a friction force (n2eR + nennσcxVcx)mnVn. The latter
comes from the fact that each charge exchange or recombination creates a neutral which, on average, is at rest, thereby decreasing the average neutral velocity Vn by a quantity
proportional to Vn/nn. Regarding the former, let us consider the equation for the evolution
of Pn (which can be derived from Equations4, 5 and 6):
∂tPn = − Vn∂rPn− 5 3Pn∂rVn+ nnneσcxVcx( 1 3mnV 2 n + eTi− Pn nn ) + n2eR(1 3mnV 2 n + eTi) − neIPn (8)
terms proportional to eTi. This is due to the fact that each charge exchange or recombination
creates a neutral whose energy, on average, is equal to 32eTi. This effect typically leads to
the formation of a Pn spike at the gas-plasma interface. The −∂rPn term in Equation 7
then tends to accelerate the gas on the inside of this spike and decelerate it on the outside. From a kinetic point of view, this may be understood as hot neutrals being created with a velocity pointing randomly either towards the plasma core or away from it (depending on the gyro-angle of the ion just before the charge exchange or recombination).
In summary, charge exchange and recombination influence the gas flow in two ways: via a friction force and via gas heating. The relative importance of these two mechanisms depends on the ion temperature. We will come back to this point in SectionIV.
The fact that a shock wave should appear when the gas reaches the plasma has been predicted already by Parks and Wu [29], who state (at the beginning of Section 3 of [29]) that “The plasma pressure impresses on the frontal surface driving a shock wave running inwards and backwards”. In our opinion, this statement may be misleading since the plasma pressure does not directly apply on the gas. However, the gas heating effect described above may be seen as a conversion of plasma pressure into neutral pressure and in that sense, plasma pressure may be considered to indirectly impress on the gas. But the above discussion shows that this is not the only type of interaction between the plasma and the gas: the frictional interaction should not be forgotten.
Another question is whether there is a dominant player between charge exchange and recombination. A partial answer is provided in Figure 8 (left), which contains simulation results with charge exchange and recombination turned off separately. This figure indicates that charge exchange has a stronger effect than recombination, but the most important point is probably that each of these two effects is strong enough to significantly brake the gas and create a shock wave by itself.
IV. GAS PENETRATION INTO THE BACKGROUND PLASMA SURROUND-ING A RUNAWAY BEAM
As mentioned in the introduction, multiple attempts to “kill” an RE beam with MGI (including with high Z gases like Kr or Xe) in JET have shown no effect [1]. A possible explanation may be that the RE beam, which is localized in the core of the plasma, extending perhaps up to mid-radius, is “shielded” by the cold background plasma surrounding it via a gas braking effect similar to the one described above. However, it is essential to note that on Tore Supra [30], DIII-D [31] or ASDEX-U [32], MGI clearly affects the RE beam, so the gas must reach the beam in these machines. It is therefore interesting to investigate possible reasons for differences in terms of gas penetration between the machines.
The electron density ne,bg and temperature Te,bg of the background plasma are one
possi-bility. Although measurements are not easy (especially for temperature), ne,bg seems to be
typically a few 1020m−3 in JET and DIII-D and a few 1019m−3 in Tore Supra and
ASDEX-U, and Te,bg is estimated to be at least 20 eV in JET while Te,bg ∼ 2eV in DIII-D and
ASDEX-U [1] [31] [32]. The background plasma therefore seems to be denser and/or hotter in JET than in DIII-D or ASDEX-U. IMAGINE allows investigating how gas penetration depends on ne,bg and Te,bg. For this purpose, we made simulations of D2 MGI in JET from
DMV2 at 20 bar. This setting was chosen because it corresponds to an actual pulse. The ne
and Te profiles were scaled from the profiles of the Ohmic pulse 86887 modelled above. We
assumed Ti = Te for the initial profiles. We also turned off the radiation and recombination
terms. Indeed, due to the low Te and to the absence of certain physical effects in the model
(e.g. Joule heating), the bulk plasma may otherwise undergo a radiative collapse and/or significant recombination over the timescale of the simulation, which are not the purpose of the present study. Figure 11presents the evolution of the sum of free plus bound electrons, i.e. ne+ nn, versus time and radius, for four simulations: (A) n0e,bg = 10
20 m−3, T0
e,bg = 2 eV
(top left); (B) n0
e,bg = 1019m −3, T0
e,bg = 2 eV (top right); (C) n0e,bg = 1019m −3, T0
e,bg = 20 eV
(bottom left); (D) n0e,bg = 1019 m−3, Te,bg0 = 2 keV (bottom right). The superscript 0 denotes the central value at the beginning of the simulation. We chose to represent ne+ nn because
both free and bound electrons may brake RE (although not exactly to the same extent). Simulation (A) shows that even at very low Te,bg, the gas is prevented from penetrating far
friction due to charge exchange, which remains significant even at very low plasma tempera-tures due to the weak Ti dependency of σcxVcxat low Ti, visible in Figure 2(right). At lower
densities, however, such as in simulation (B), the gas may penetrate much further. This is easily understood as the friction force is proportional to ne. Simulations (B), (C) and (D)
constitute a scan in T0
e,bg at fixed n0e,bg = 1019 m
−3. Moving from T0
e,bg = 2 eV to Te,bg0 = 20
eV, i.e. from (B) and (C), has almost no influence on the result, whereas at T0
e,bg = 2 keV
(case (D)), gas penetration is clearly hindered. This is due to the Ti dependency of the
above-mentioned mechanism of gas braking via charge exchange heating: for T0
e,bg < 20 eV,
this mechanism plays an almost negligible role, whereas for Te,bg0 = 2 keV, it is the dominant player. The simulations therefore reveal an important difference in gas penetration physics between a hot and a cold target plasma: in the former case, the gas is mainly braked via heating while in the latter, it is mainly braked by friction.
It may be that the situation at JET corresponds to simulation (A), where the superficial penetration of the gas would be insufficient to affect the RE beam if the latter is localized inside, say, r/a ' 0.5. The lower n0
e,bg at Tore Supra and ASDEX-U may on the other hand
correspond to simulation (C), where one would expect the gas to affect the beam. Simulation results however do not provide an obvious explanation for the difference between JET and DIII-D, since n0
e,bg has the same order of magnitude in these two machines and the factor
∼ 10 difference in terms of T0
e,bg is not expected to affect gas penetration significantly. Of
course, it may be that the explanation lies somewhere else, for example in a machine size effect (a larger machine means a thicker background plasma “shield” around the RE beam) or different MGI settings. Investigating these possibilities is left for future work. For now, the important practical conclusion of our study in view of further experiments in JET is that optimizing the RE beam production “recipe” in order to lower n0e,bg may help get an effect of MGI on the beam.
To finish this section, we would like to draw attention to an interesting observation made in the above-mentioned Tore Supra experiment. Figure 7b in [30] shows that the neutral pressure measured with a pressure gauge in the vacuum vessel decreases abruptly from ' 2.5 Pa to ' 1 Pa in about 20 ms (which is the response time of the gauge) just after the extinction of the plasma, after which it stabilizes slightly below 1 Pa, the latter being the expected pressure for a uniform filling of the vessel at the vessel temperature of 120 ◦C. The pressure of ' 2.5 Pa in the runaway plateau phase suggests that the gas
0 2 4 6 8 10 0 0.2 0.4 0.6 0.8 1 Time (ms) r (m) n e + nn (m −3) Plasma Vacuum 0 0.5 1 1.5 2 2.5 3 x 10²¹
FIG. 11. Electron plus neutral density as a function of time and radius for n0e,bg = 1020 m−3, Te,bg0 = 2 eV (top left); n0e,bg = 1019 m−3, Te,bg0 = 2 eV (top right); n0e,bg= 1019 m−3, Te,bg0 = 20 eV (bottom left); n0e,bg= 1019 m−3, Te,bg0 = 2 keV (bottom right)
is confined to a smaller volume and/or hotter than 120 ◦C. This is consistent with the findings presented in this paper that gas-plasma interaction prevents most of the gas from penetrating the plasma volume (even when part of the gas does penetrate the plasma and affects the runaway beam) and also heats up the gas. An interesting direction for future work is to investigate the possible role of this gas surrounding the plasma. This question cannot be addressed by a simple 1D model like the one used in IMAGINE.
V. CONCLUSION AND PERSPECTIVES
The model introduced in this paper is simple in several respects: it uses a 1D radial slab geometry, treats only D2 MGI into a D+ plasma, and assumes ionized species to be at rest.
However, the model comprises features which are essential to investigate the fundamental physics of gas penetration during an MGI: the gas equations are based on first principles, and the simulation domain encompasses the plasma, vacuum region and gas reservoir.
IMAGINE simulations have revealed that the gas delivered by MGI is in general strongly braked as it reaches the plasma. This occurs due to two different mechanisms: a gas-plasma friction force and a heating of the gas by the plasma. Both mechanisms are related to charge exchange and recombination. The heating mechanism typically dominates in high temperature, pre-TQ plasmas, whereas the friction mechanism dominates in cold, post-TQ plasmas. The strong gas braking results in a partial penetration of the gas into the plasma and provokes the appearance of a shock wave in the gas, which propagates away from the plasma, braking and compressing the incoming gas. It is important to note that, although the IMAGINE model is presently restricted to D2 MGI into a D+ plasma, we expect these
mechanisms to generalize to cases where the gas is of a different species than the plasma ions. Implementing other gases than D2 in MGI is a direction for future work. Another
important question for future research is whether the hypothesis of ionized species being at rest is justified or whether the gas may “push” the plasma.
Simulation results are quantitatively consistent, at least in terms of orders of magnitude, with experimental observations for a D2 MGI in an Ohmic JET pulse. We stress that no
parameter was adjusted in order to match experimental measurements. In fact, the model does not contain adjustable parameters besides the diffusion coefficients D and χ, which only have a small effect on the results. More simulations and comparisons to experiments are necessary to assess whether the model, in spite of its simple geometry, really has a predictive capability or whether the agreement reported in this paper is fortuitous.
IMAGINE allows investigating possible differences between machines regarding experi-ments aiming at RE beam mitigation with MGI. Simulations show that the gas penetration depth is a decreasing function of the electron density of the target plasma. It may be that at JET, the density of the background plasma co-existing with the RE beam, n0
e,bg, is too
high for the gas to be able to reach the beam, which would explain its absence of effect. In contrast, in Tore Supra and ASDEX-U, n0
e,bg is one order of magnitude lower and the gas
may penetrate, consistently with the positive experimental results. However, in DIII-D, in spite of a value of n0e,bg comparable to JET, a positive result is obtained. It may be noticed that T0
simula-tions indicate that this should not affect gas penetration much. Further investigasimula-tions are therefore needed to identify the origin of the difference between JET and DIII-D.
Another important area for future work is to implement the physics treated in IMAGINE in other models used for MGI simulations, e.g. 3D non-linear MHD codes such as JOREK or NIMROD: the gas deposition model is indeed rather ad hoc at present, which limits their predictive capability.
VI. ACKNOWLEDGEMENTS
We would like to thank H. Bufferand, E. Joffrin, B. P´egouri´e and C. Sommariva for helpful discussions or comments on the manuscript. This work has been carried out within the framework of the EUROfusion Consortium and has received funding from the Euratom research and training programme 2014-2018 under grant agreement No 633053. The views and opinions expressed herein do not necessarily reflect those of the ITER Organization or the European Commission.
[1] C. Reux et al., Nucl. Fusion 55 093013 (2015)
[2] ITER Physics Expert Group on Disruptions, Plasma Control, and MHD and ITER Physics Basis Editors, Nucl. Fusion 39 2251 (1999)
[3] T.C. Hender et al., Nucl. Fusion 47 S128 (2007) [4] M. Lehnen et al., J. Nucl. Mater. 463 3948 (2015) [5] E.M. Hollmann et al., Phys. Plasmas 22 021802 (2015) [6] A.J. Thornton et al., Nucl. Fusion 52 063018 (2012)
[7] S.A. Bozhenkov et al., Plasma Phys. Control. Fusion 50 105007 (2008) [8] C. Reux et al., Nucl. Fusion 50 095006 (2010)
[9] S.A. Bozhenkov et al., Nucl. Fusion 51 083033 (2011) [10] M. Lehnen et al., Nucl. Fusion 51 123010 (2011) [11] G. Pautasso et al., Nucl. Fusion 55 033015 (2015)
[12] E.M. Hollmann et al., “DIII-D Studies of Massive Gas Injection Fast Shutdowns for Disruption Mitigation”, Proceedings of the 33rd EPS Conference on Plasma Phys., Rome, 19-23 June
2006, ECA Vol.30I, P-5.136 (2006)
[13] V.M. Leonov and V.E. Zhogolev, Plasma Phys. Control. Fusion 47 903918 (2005) [14] E. Fable et al., Nucl. Fusion 56 026012 (2016)
[15] I.S. Landman et al., Fusion Engineering and Design 86 16161619 (2011) [16] S. Pestchanyi et al., Fusion Engineering and Design 87 11951200 (2012)
[17] G. Pautasso et al., Proc. 22nd Int. Conf. on Fusion Energy 2008 (Geneva, Switzerland, 2008) (Vienna: IAEA) CD-ROM file [EX/P9-1]
[18] V.A. Izzo, Phys. Plasmas 20, 056107 (2013)
[19] V.A. Izzo, E.M. Hollmann, A.N. James, J.H. Yu, D.A. Humphreys, L.L. Lao, P.B. Parks, P.E. Sieck, J.C. Wesley, R.S. Granetz, G.M. Olynyk and D.G. Whyte, Nucl. Fusion 51, 063032 (2011)
[20] V.A. Izzo, P. B. Parks and L. L. Lao, Plasma Phys. Control. Fusion 51, 105004 (2009) [21] V.A. Izzo, D. G. Whyte, R. S. Granetz, P. B. Parks, E. M. Hollmann, L. L. Lao, and J. C.
Wesley, Phys. Plasmas 15, 056109 (2008) [22] V.A. Izzo, Nucl. Fusion 46, 541 (2006) [23] A. Fil et al., Phys. Plasmas 22 062509 (2015) [24] V. Rozhansky et al., Nucl. Fusion 46 367 (2006) [25] B. P´egouri´e et al., Nucl. Fusion 47 44 (2007)
[26] E.T. Meier and U. Shumlak, Phys. Plasmas 19 072508 (2012)
[27] See http://adas.ac.uk for: H. P. Summers, Atomic Data and Analysis Structure User Manual [28] L.D. Landau and E.M. Lifshitz, 1987, Course of Theoretical Physics, Vol. 6: Fluid Mechanics
2nd Ed., Pergamon Press
[29] P.B. Parks and W. Wu, Nucl. Fusion 54 023002 (2014)
[30] F. Saint-Laurent et al., Fusion Science and Technology 64 711 (2012) [31] E.M. Hollmann et al., Nucl. Fusion 53 083004 (2013)
[32] G. Pautasso et al., “Generation and suppression of runaway electrons in ASDEX Upgrade disruptions”, Proceedings of the 42nd EPS Conference on Plasma Phys., Lisbon, 22-26 June 2015, P-1.134 (2015)
Appendix A: Details on simulation settings
In this Appendix, we detail how the initial density nsim
res and pressure Pressim and of the
reservoir and its radial extent δsimr,res are set so as to match the initial number of D atoms in the reservoir Nres, the initial flux of D atoms out of it Φres, and the initial sound velocity
in the reservoir cs,res.
One should keep in mond that in the simulations, nnis the D atom density but in reality
the gas is made of D2 molecules. In the equations below, we use a superscript to specify
whether quantities refer to D atoms or D2 molecules.
Considering the simulation domain as a slab of length 2πR0 and height 2πa, with R0 the
major radius and a the minor radius of the machine, the three above-mentioned conditions translate to:
NresD = 2Vresexpnexp,D2
res = 4π 2R
0aδr,ressim n sim,D
res (A1)
ΦDres = 2Aexporif icecexp,D2
s,res n exp,D2 res = 4π 2 R0acsim,Ds,res n sim,D res (A2) cexp,D2 s,res = (γD2 Pexp,D2 res 2mDnexp,Dres 2 )1/2 = csim,Ds,res = (γD Pressim,D mDnsim,Dres )1/2 (A3) Equation A2 anticipates on the result presented in the next section that the gas velocity at the exit of the DMV is the sound velocity (both in the experiment and simulation).
After some simple algebra, Equations A1, A2and A3 yield the following expressions for the input parameters nsim,Dres , Pressim,D and δsimr,res:
nsim,Dres = 2A exp orif ice 4π2R 0a nexp,D2 res =
2Aexporif ice 4π2R 0a Pexp,D2 res kBTresexp,D2 (A4) Pressim,D = γD2 γD
Aexporif ice 4π2R 0a Pexp,D2 res (A5) δr,ressim = V exp res
Aexporif ice (A6)
where Vexp
res is the volume of the gas reservoir in the experiment.
In JET pulse 86887, the experimental parameters are Pexp,D2
res = 5 bar, Tresexp,D2 ' 300 K,
nsim,D
res = 1.43 · 1021m
−3, Psim,D
res = 2.48 Pa and δr,ressim = 1.43 m. It may be surprising that the
reservoir pressure in the simulation is so low compared to the experimental one (2.48 Pa vs. 5 bar). However, it should be kept in mind that in our model, the plasma is as completely surrounded by the gas reservoir and the incoming gas flow is spread over the whole plasma surface instead of being very localized.